Thailand - Yarn Of Synthetic Or Artificial Staple Fibers - Market Analysis, Forecast, Size, Trends and Insights
Get instant access to more than 2 million reports, dashboards, and datasets on the IndexBox Platform.
View PricingThailand's Synthetic Yarn Price Sees 7% Decrease, Reaches $2,585 per Ton
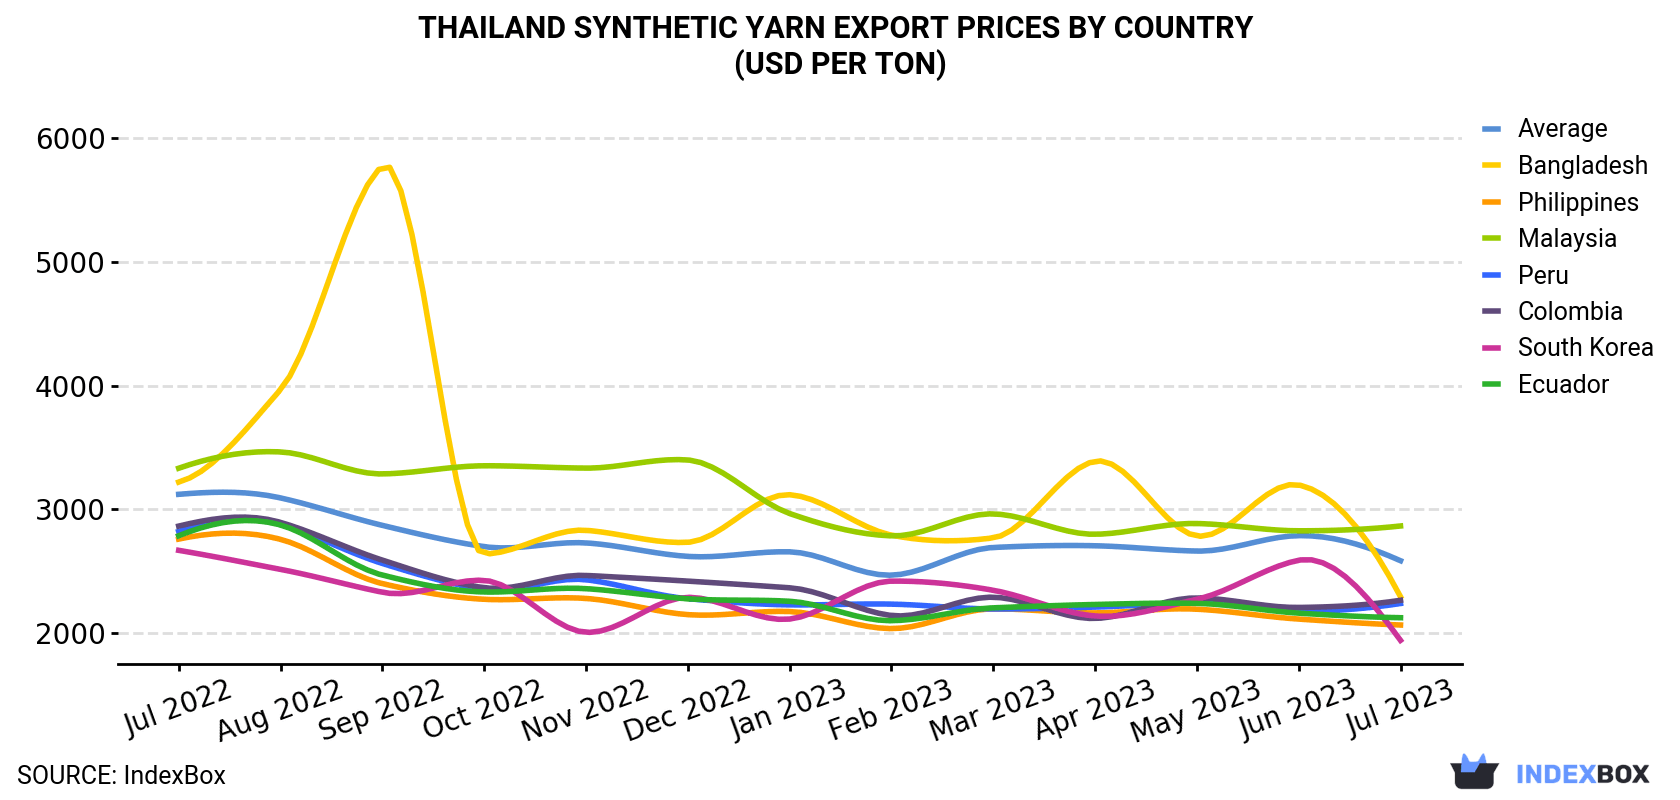
Thailand Synthetic Yarn Export Price in July 2023
In July 2023, the synthetic yarn price stood at $2,585 per ton (FOB, Thailand), which is down by -7.3% against the previous month. In general, the export price showed a slight setback. The pace of growth was the most pronounced in March 2023 an increase of 9.1% month-to-month. The export price peaked at $3,122 per ton in July 2022; however, from August 2022 to July 2023, the export prices failed to regain momentum.
Average prices varied somewhat for the major overseas markets. In July 2023, the countries with the highest prices were Malaysia ($2,866 per ton) and Bangladesh ($2,294 per ton), while the average price for exports to South Korea ($1,941 per ton) and the Philippines ($2,065 per ton) were amongst the lowest.
From July 2022 to July 2023, the most notable rate of growth in terms of prices was recorded for supplies to Malaysia (-1.3%), while the prices for the other major destinations experienced a decline.
| COUNTRY | Export Price of Synthetic Yarn in Thailand (USD per ton) | ||||||||||||
|---|---|---|---|---|---|---|---|---|---|---|---|---|---|
| Jul 2022 | Aug 2022 | Sep 2022 | Oct 2022 | Nov 2022 | Dec 2022 | Jan 2023 | Feb 2023 | Mar 2023 | Apr 2023 | May 2023 | Jun 2023 | Jul 2023 | |
| Malaysia | 3,333 | 3,465 | 3,287 | 3,353 | 3,334 | 3,400 | 2,967 | 2,786 | 2,964 | 2,799 | 2,886 | 2,827 | 2,866 |
| Bangladesh | 3,221 | 3,969 | 5,776 | 2,639 | 2,831 | 2,734 | 3,119 | 2,792 | 2,770 | 3,390 | 2,785 | 3,198 | 2,294 |
| Colombia | 2,865 | 2,895 | 2,590 | 2,367 | 2,466 | 2,420 | 2,366 | 2,142 | 2,290 | 2,118 | 2,284 | 2,207 | 2,265 |
| Peru | 2,821 | 2,877 | 2,563 | 2,353 | 2,431 | 2,278 | 2,228 | 2,234 | 2,195 | 2,210 | 2,247 | 2,178 | 2,239 |
| Ecuador | 2,787 | 2,874 | 2,469 | 2,332 | 2,359 | 2,277 | 2,257 | 2,100 | 2,204 | 2,231 | 2,240 | 2,161 | 2,124 |
| Philippines | 2,760 | 2,758 | 2,400 | 2,273 | 2,280 | 2,149 | 2,174 | 2,036 | 2,196 | 2,163 | 2,193 | 2,113 | 2,065 |
| South Korea | 2,669 | 2,515 | 2,330 | 2,426 | 2,006 | 2,289 | 2,113 | 2,420 | 2,346 | 2,138 | 2,273 | 2,589 | 1,941 |
| Average | 3,122 | 3,093 | 2,871 | 2,699 | 2,729 | 2,620 | 2,657 | 2,468 | 2,692 | 2,706 | 2,663 | 2,788 | 2,585 |
Thailand Synthetic Yarn Export Prices by Type
Prices varied noticeably by the product type; the product with the highest price was yarn (not sewing thread), of man-made staple fibres, put up for retail sale ($15,575 per ton), while the average price for exports of yarn (other than sewing thread) of synthetic staple fibres, not put up for retail sale ($2,519 per ton) was amongst the lowest.
From July 2022 to July 2023, the most notable rate of growth in terms of prices was recorded for the following types: yarn (other than sewing thread) of artificial staple fibres, not put up for retail sale (+1.1%), while the prices for the other products experienced a decline.
Thailand Synthetic Yarn Exports
In July 2023, after three months of decline, there was significant growth in shipments abroad of yarn of synthetic or artificial staple fibers, when their volume increased by 25% to 3K tons. Over the period under review, exports, however, continue to indicate a abrupt contraction.
In value terms, synthetic yarn exports skyrocketed to $7.7M (IndexBox estimates) in July 2023. Overall, exports, however, saw a abrupt decrease. The pace of growth was the most pronounced in March 2023 with an increase of 22% against the previous month.
Thailand Synthetic Yarn Exports by Type
Yarn (other than sewing thread) of synthetic staple fibres, not put up for retail sale (2.7K tons) was the largest type of synthetic yarn exported from Thailand, with a 92% share of total exports. Moreover, yarn (other than sewing thread) of synthetic staple fibres, not put up for retail sale exceeded the volume of the second product type, yarn (other than sewing thread) of artificial staple fibres, not put up for retail sale (222 tons), more than tenfold.
From July 2022 to July 2023, the average monthly growth rate of the volume of export of yarn (other than sewing thread) of synthetic staple fibres, not put up for retail sale totaled -6.1%. With regard to the other exported products, the following average monthly rates of growth were recorded: yarn (other than sewing thread) of artificial staple fibres, not put up for retail sale (+1.8% per month) and yarn (not sewing thread), of man-made staple fibres, put up for retail sale (+2.2% per month).
In value terms, yarn (other than sewing thread) of synthetic staple fibres, not put up for retail sale ($6.9M) remains the largest type of synthetic yarn exported from Thailand, comprising 90% of total exports. The second position in the ranking was held by yarn (other than sewing thread) of artificial staple fibres, not put up for retail sale ($676K), with an 8.8% share of total exports.
From July 2022 to July 2023, the average monthly rate of growth in terms of the export volume of yarn (other than sewing thread) of synthetic staple fibres, not put up for retail sale amounted to -7.8%. With regard to the other exported products, the following average monthly rates of growth were recorded: yarn (other than sewing thread) of artificial staple fibres, not put up for retail sale (+2.9% per month) and yarn (not sewing thread), of man-made staple fibres, put up for retail sale (+0.2% per month).
Thailand Synthetic Yarn Exports by Country
South Korea (394 tons), Malaysia (390 tons) and Brazil (271 tons) were the main destinations of synthetic yarn exports from Thailand, with a combined 35% share of total exports.
From July 2022 to July 2023, the most notable rate of growth in terms of shipments, amongst the main countries of destination, was attained by Brazil (with a CAGR of +24.4%), while the other leaders experienced mixed trend patterns.
In value terms, Malaysia ($1.1M), South Korea ($765K) and Bangladesh ($604K) were the largest markets for synthetic yarn exported from Thailand worldwide, with a combined 32% share of total exports. These countries were followed by Peru, Ecuador, Colombia, Japan, Vietnam, Brazil, the Philippines, Lao People's Democratic Republic and Spain, which together accounted for a further 53%.
In terms of the main countries of destination, Brazil, with a CAGR of +18.7%, recorded the highest growth rate of the value of exports, over the period under review, while shipments for the other leaders experienced mixed trend patterns.
This report provides an in-depth analysis of the synthetic yarn market in Thailand. Within it, you will discover the latest data on market trends and opportunities by country, consumption, production and price developments, as well as the global trade (imports and exports). The forecast exhibits the market prospects through 2030.
Product coverage:
- Prodcom 13108210 - Yarn (other than sewing thread) containing . .85 % by weight of synthetic staple fibres, n.p.r.s.
- Prodcom 13108250 - Yarn (other than sewing thread) containing . .85 % by weight of synthetic staple fibres, p.r.s.
- Prodcom 13108320 - Yarn containing < .85 % by weight of polyester staple fibres (other than sewing thread), mixed with artificial fibres, n.p.r.s.
- Prodcom 13108340 - Yarn containing < .85 % by weight of synthetic staple fibres (other than sewing thread), mixed with cotton, n.p.r.s.
- Prodcom 13108380 - Other yarns, containing < .85 % by weight of synthetic staple fibres (other than sewing thread), n.p.r.s., n.e.c.
- Prodcom 13108390 - Yarn containing < .85 % by weight of synthetic staple fibres (other than sewing thread), p.r.s.
- Prodcom 131083Z0 - Yarn of synthetic staple fibres mixed with wool, n.p.r.s
- Prodcom 13108410 - Yarn (other than sewing thread) of artificial staple fibres, n .p.r.s.
- Prodcom 13108430 - Yarn (other than sewing thread) of artificial staple fibres, p.r.s.
Country coverage:
- Thailand
Data coverage:
- Market volume and value
- Per Capita consumption
- Forecast of the market dynamics in the medium term
- Trade (exports and imports) in Thailand
- Export and import prices
- Market trends, drivers and restraints
- Key market players and their profiles
Reasons to buy this report:
- Take advantage of the latest data
- Find deeper insights into current market developments
- Discover vital success factors affecting the market
This report is designed for manufacturers, distributors, importers, and wholesalers, as well as for investors, consultants and advisors.
In this report, you can find information that helps you to make informed decisions on the following issues:
- How to diversify your business and benefit from new market opportunities
- How to load your idle production capacity
- How to boost your sales on overseas markets
- How to increase your profit margins
- How to make your supply chain more sustainable
- How to reduce your production and supply chain costs
- How to outsource production to other countries
- How to prepare your business for global expansion
While doing this research, we combine the accumulated expertise of our analysts and the capabilities of artificial intelligence. The AI-based platform, developed by our data scientists, constitutes the key working tool for business analysts, empowering them to discover deep insights and ideas from the marketing data.
-
1. INTRODUCTION
Making Data-Driven Decisions to Grow Your Business
- REPORT DESCRIPTION
- RESEARCH METHODOLOGY AND AI PLATFORM
- DATA-DRIVEN DECISIONS FOR YOUR BUSINESS
- GLOSSARY AND SPECIFIC TERMS
-
2. EXECUTIVE SUMMARY
A Quick Overview of Market Performance
- KEY FINDINGS
- MARKET TRENDS This Chapter is Available Only for the Professional Edition PRO
-
3. MARKET OVERVIEW
Understanding the Current State of The Market and Its Prospects
- MARKET SIZE
- MARKET STRUCTURE
- TRADE BALANCE
- PER CAPITA CONSUMPTION
- MARKET FORECAST TO 2030
-
4. MOST PROMISING PRODUCT
Finding New Products to Diversify Your Business
This Chapter is Available Only for the Professional Edition PRO- TOP PRODUCTS TO DIVERSIFY YOUR BUSINESS
- BEST-SELLING PRODUCTS
- MOST CONSUMED PRODUCT
- MOST TRADED PRODUCT
- MOST PROFITABLE PRODUCT FOR EXPORT
-
5. MOST PROMISING SUPPLYING COUNTRIES
Choosing the Best Countries to Establish Your Sustainable Supply Chain
This Chapter is Available Only for the Professional Edition PRO- TOP COUNTRIES TO SOURCE YOUR PRODUCT
- TOP PRODUCING COUNTRIES
- TOP EXPORTING COUNTRIES
- LOW-COST EXPORTING COUNTRIES
-
6. MOST PROMISING OVERSEAS MARKETS
Choosing the Best Countries to Boost Your Exports
This Chapter is Available Only for the Professional Edition PRO- TOP OVERSEAS MARKETS FOR EXPORTING YOUR PRODUCT
- TOP CONSUMING MARKETS
- UNSATURATED MARKETS
- TOP IMPORTING MARKETS
- MOST PROFITABLE MARKETS
7. PRODUCTION
The Latest Trends and Insights into The Industry
- PRODUCTION VOLUME AND VALUE
8. IMPORTS
The Largest Import Supplying Countries
- IMPORTS FROM 2012–2023
- IMPORTS BY COUNTRY
- IMPORT PRICES BY COUNTRY
9. EXPORTS
The Largest Destinations for Exports
- EXPORTS FROM 2012–2023
- EXPORTS BY COUNTRY
- EXPORT PRICES BY COUNTRY
-
10. PROFILES OF MAJOR PRODUCERS
The Largest Producers on The Market and Their Profiles
This Chapter is Available Only for the Professional Edition PRO -
LIST OF TABLES
- Key Findings In 2023
- Market Volume, In Physical Terms, 2012–2023
- Market Value, 2012–2023
- Per Capita Consumption In 2012-2023
- Imports, In Physical Terms, By Country, 2012–2023
- Imports, In Value Terms, By Country, 2012–2023
- Import Prices, By Country Of Origin, 2012–2023
- Exports, In Physical Terms, By Country, 2012–2023
- Exports, In Value Terms, By Country, 2012–2023
- Export Prices, By Country Of Destination, 2012–2023
-
LIST OF FIGURES
- Market Volume, In Physical Terms, 2012–2023
- Market Value, 2012–2023
- Market Structure – Domestic Supply vs. Imports, In Physical Terms, 2012-2023
- Market Structure – Domestic Supply vs. Imports, In Value Terms, 2012-2023
- Trade Balance, In Physical Terms, 2012-2023
- Trade Balance, In Value Terms, 2012-2023
- Per Capita Consumption, 2012-2023
- Market Volume Forecast to 2030
- Market Value Forecast to 2030
- Products: Market Size And Growth, By Type
- Products: Average Per Capita Consumption, By Type
- Products: Exports And Growth, By Type
- Products: Export Prices And Growth, By Type
- Production Volume And Growth
- Exports And Growth
- Export Prices And Growth
- Market Size And Growth
- Per Capita Consumption
- Imports And Growth
- Import Prices
- Production, In Physical Terms, 2012–2023
- Production, In Value Terms, 2012–2023
- Imports, In Physical Terms, 2012–2023
- Imports, In Value Terms, 2012–2023
- Imports, In Physical Terms, By Country, 2023
- Imports, In Physical Terms, By Country, 2012–2023
- Imports, In Value Terms, By Country, 2012–2023
- Import Prices, By Country Of Origin, 2012–2023
- Exports, In Physical Terms, 2012–2023
- Exports, In Value Terms, 2012–2023
- Exports, In Physical Terms, By Country, 2023
- Exports, In Physical Terms, By Country, 2012–2023
- Exports, In Value Terms, By Country, 2012–2023
- Export Prices, By Country Of Destination, 2012–2023


