
Thailand - Sardines (Prepared Or Preserved) - Market Analysis, Forecast, Size, Trends And Insights
Get instant access to more than 2 million reports, dashboards, and datasets on the IndexBox Platform.
View PricingThailand's January 2024 Export of Canned Sardines Reaches $11M
Thailand Preserved Sardines Exports
Preserved sardines exports from Thailand plummeted to 3.9K tons in January 2024, falling by -18.1% against December 2023 figures. In general, exports continue to indicate a deep reduction. The most prominent rate of growth was recorded in March 2023 when exports increased by 48% m-o-m.
In value terms, preserved sardines exports dropped to $11M (IndexBox estimates) in January 2024. Over the period under review, exports recorded a perceptible setback. The growth pace was the most rapid in March 2023 with an increase of 58% against the previous month.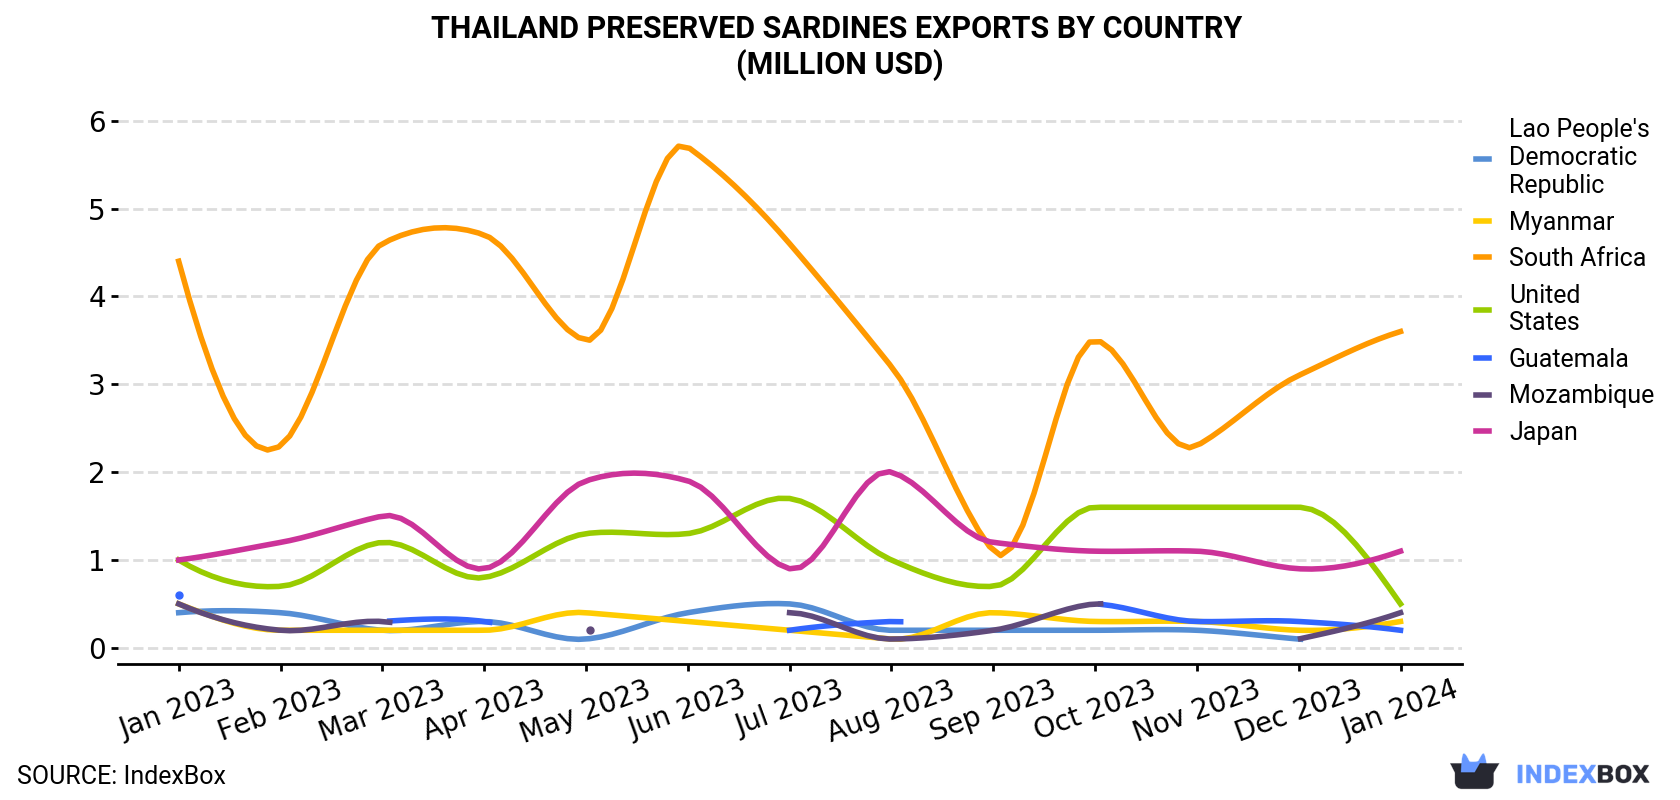
| COUNTRY | Export Value of Preserved Sardines in Thailand (million USD) | ||||||||||||
|---|---|---|---|---|---|---|---|---|---|---|---|---|---|
| Jan 2023 | Feb 2023 | Mar 2023 | Apr 2023 | May 2023 | Jun 2023 | Jul 2023 | Aug 2023 | Sep 2023 | Oct 2023 | Nov 2023 | Dec 2023 | Jan 2024 | |
| South Africa | 4.4 | 2.3 | 4.6 | 4.7 | 3.5 | 5.7 | 4.6 | 3.2 | 1.1 | 3.5 | 2.3 | 3.1 | 3.6 |
| Japan | 1.0 | 1.2 | 1.5 | 0.9 | 1.9 | 1.9 | 0.9 | 2.0 | 1.2 | 1.1 | 1.1 | 0.9 | 1.1 |
| United States | 1.0 | 0.7 | 1.2 | 0.8 | 1.3 | 1.3 | 1.7 | 1.0 | 0.7 | 1.6 | 1.6 | 1.6 | 0.5 |
| Mozambique | 0.5 | 0.2 | 0.3 | < 0.1 | 0.2 | < 0.1 | 0.4 | 0.1 | 0.2 | 0.5 | N/A | 0.1 | 0.4 |
| Myanmar | 0.5 | 0.2 | 0.2 | 0.2 | 0.4 | 0.3 | 0.2 | 0.1 | 0.4 | 0.3 | 0.3 | 0.2 | 0.3 |
| Guatemala | 0.6 | < 0.1 | 0.3 | 0.3 | < 0.1 | < 0.1 | 0.2 | 0.3 | < 0.1 | 0.5 | 0.3 | 0.3 | 0.2 |
| Lao People's Democratic Republic | 0.4 | 0.4 | 0.2 | 0.3 | 0.1 | 0.4 | 0.5 | 0.2 | 0.2 | 0.2 | 0.2 | 0.1 | < 0.1 |
| Others | 9.5 | 5.9 | 9.0 | 6.1 | 5.8 | 5.8 | 7.3 | 7.6 | 8.8 | 7.9 | 6.3 | 5.7 | 4.2 |
| Total | 17.8 | 11.0 | 17.4 | 13.4 | 13.2 | 15.7 | 15.8 | 14.6 | 12.8 | 15.4 | 12.2 | 12.1 | 10.5 |
Exports by Country
South Africa (1.4K tons) was the main destination for preserved sardines exports from Thailand, accounting for a 36% share of total exports. Moreover, preserved sardines exports to South Africa exceeded the volume sent to the second major destination, Japan (258 tons), fivefold. Mozambique (203 tons) ranked third in terms of total exports with a 5.2% share.
From January 2023 to January 2024, the average monthly growth rate of volume to South Africa stood at -2.1%. Exports to the other major destinations recorded the following average monthly rates of exports growth: Japan (+2.0% per month) and Mozambique (-0.0% per month).
In value terms, South Africa ($3.6M) remains the key foreign market for preserved sardines exports from Thailand, comprising 34% of total exports. The second position in the ranking was taken by Japan ($1.1M), with a 10% share of total exports. It was followed by the United States, with a 5.2% share.
From January 2023 to January 2024, the average monthly rate of growth in terms of value to South Africa totaled -1.7%. Exports to the other major destinations recorded the following average monthly rates of exports growth: Japan (+0.7% per month) and the United States (-5.0% per month).
Export Prices by Country
In January 2024, the preserved sardines price stood at $2,709 per ton (FOB, Thailand), with an increase of 6.3% against the previous month. Over the period under review, export price indicated a prominent expansion from January 2023 to January 2024: its price increased at an average monthly rate of +12.0% over the last twelve months. The trend pattern, however, indicated some noticeable fluctuations being recorded throughout the analyzed period. Based on January 2024 figures, preserved sardines export price increased by +6.3% against December 2023 indices. The most prominent rate of growth was recorded in February 2023 when the average export price increased by 251% month-to-month. Over the period under review, the average export prices hit record highs in January 2024.
Prices varied noticeably by the country of destination: the country with the highest price was the Dominican Republic ($7,177 per ton), while the average price for exports to Myanmar ($1,713 per ton) was amongst the lowest.
From January 2023 to January 2024, the most notable rate of growth in terms of prices was recorded for supplies to the Dominican Republic (+4.0%), while the prices for the other major destinations experienced more modest paces of growth.
This report provides an in-depth analysis of the preserved sardines market in Thailand. Within it, you will discover the latest data on market trends and opportunities by country, consumption, production and price developments, as well as the global trade (imports and exports). The forecast exhibits the market prospects through 2030.
Product coverage:
- Prodcom 10202530 - Prepared or preserved sardines, sardinella, brisling and sprats, whole or in pieces (excluding minced products and prepared meals and dishes)
Country coverage:
- Thailand
Data coverage:
- Market volume and value
- Per Capita consumption
- Forecast of the market dynamics in the medium term
- Trade (exports and imports) in Thailand
- Export and import prices
- Market trends, drivers and restraints
- Key market players and their profiles
Reasons to buy this report:
- Take advantage of the latest data
- Find deeper insights into current market developments
- Discover vital success factors affecting the market
This report is designed for manufacturers, distributors, importers, and wholesalers, as well as for investors, consultants and advisors.
In this report, you can find information that helps you to make informed decisions on the following issues:
- How to diversify your business and benefit from new market opportunities
- How to load your idle production capacity
- How to boost your sales on overseas markets
- How to increase your profit margins
- How to make your supply chain more sustainable
- How to reduce your production and supply chain costs
- How to outsource production to other countries
- How to prepare your business for global expansion
While doing this research, we combine the accumulated expertise of our analysts and the capabilities of artificial intelligence. The AI-based platform, developed by our data scientists, constitutes the key working tool for business analysts, empowering them to discover deep insights and ideas from the marketing data.
-
1. INTRODUCTION
Making Data-Driven Decisions to Grow Your Business
- REPORT DESCRIPTION
- RESEARCH METHODOLOGY AND AI PLATFORM
- DATA-DRIVEN DECISIONS FOR YOUR BUSINESS
- GLOSSARY AND SPECIFIC TERMS
-
2. EXECUTIVE SUMMARY
A Quick Overview of Market Performance
- KEY FINDINGS
- MARKET TRENDS This Chapter is Available Only for the Professional Edition PRO
-
3. MARKET OVERVIEW
Understanding the Current State of The Market and Its Prospects
- MARKET SIZE
- MARKET STRUCTURE
- TRADE BALANCE
- PER CAPITA CONSUMPTION
- MARKET FORECAST TO 2030
-
4. MOST PROMISING PRODUCT
Finding New Products to Diversify Your Business
This Chapter is Available Only for the Professional Edition PRO- TOP PRODUCTS TO DIVERSIFY YOUR BUSINESS
- BEST-SELLING PRODUCTS
- MOST CONSUMED PRODUCT
- MOST TRADED PRODUCT
- MOST PROFITABLE PRODUCT FOR EXPORT
-
5. MOST PROMISING SUPPLYING COUNTRIES
Choosing the Best Countries to Establish Your Sustainable Supply Chain
This Chapter is Available Only for the Professional Edition PRO- TOP COUNTRIES TO SOURCE YOUR PRODUCT
- TOP PRODUCING COUNTRIES
- TOP EXPORTING COUNTRIES
- LOW-COST EXPORTING COUNTRIES
-
6. MOST PROMISING OVERSEAS MARKETS
Choosing the Best Countries to Boost Your Exports
This Chapter is Available Only for the Professional Edition PRO- TOP OVERSEAS MARKETS FOR EXPORTING YOUR PRODUCT
- TOP CONSUMING MARKETS
- UNSATURATED MARKETS
- TOP IMPORTING MARKETS
- MOST PROFITABLE MARKETS
7. PRODUCTION
The Latest Trends and Insights into The Industry
- PRODUCTION VOLUME AND VALUE
8. IMPORTS
The Largest Import Supplying Countries
- IMPORTS FROM 2012–2023
- IMPORTS BY COUNTRY
- IMPORT PRICES BY COUNTRY
9. EXPORTS
The Largest Destinations for Exports
- EXPORTS FROM 2012–2023
- EXPORTS BY COUNTRY
- EXPORT PRICES BY COUNTRY
-
10. PROFILES OF MAJOR PRODUCERS
The Largest Producers on The Market and Their Profiles
This Chapter is Available Only for the Professional Edition PRO -
LIST OF TABLES
- Key Findings In 2023
- Market Volume, In Physical Terms, 2012–2023
- Market Value, 2012–2023
- Per Capita Consumption In 2012-2023
- Imports, In Physical Terms, By Country, 2012–2023
- Imports, In Value Terms, By Country, 2012–2023
- Import Prices, By Country Of Origin, 2012–2023
- Exports, In Physical Terms, By Country, 2012–2023
- Exports, In Value Terms, By Country, 2012–2023
- Export Prices, By Country Of Destination, 2012–2023
-
LIST OF FIGURES
- Market Volume, In Physical Terms, 2012–2023
- Market Value, 2012–2023
- Market Structure – Domestic Supply vs. Imports, In Physical Terms, 2012-2023
- Market Structure – Domestic Supply vs. Imports, In Value Terms, 2012-2023
- Trade Balance, In Physical Terms, 2012-2023
- Trade Balance, In Value Terms, 2012-2023
- Per Capita Consumption, 2012-2023
- Market Volume Forecast to 2030
- Market Value Forecast to 2030
- Products: Market Size And Growth, By Type
- Products: Average Per Capita Consumption, By Type
- Products: Exports And Growth, By Type
- Products: Export Prices And Growth, By Type
- Production Volume And Growth
- Exports And Growth
- Export Prices And Growth
- Market Size And Growth
- Per Capita Consumption
- Imports And Growth
- Import Prices
- Production, In Physical Terms, 2012–2023
- Production, In Value Terms, 2012–2023
- Imports, In Physical Terms, 2012–2023
- Imports, In Value Terms, 2012–2023
- Imports, In Physical Terms, By Country, 2023
- Imports, In Physical Terms, By Country, 2012–2023
- Imports, In Value Terms, By Country, 2012–2023
- Import Prices, By Country Of Origin, 2012–2023
- Exports, In Physical Terms, 2012–2023
- Exports, In Value Terms, 2012–2023
- Exports, In Physical Terms, By Country, 2023
- Exports, In Physical Terms, By Country, 2012–2023
- Exports, In Value Terms, By Country, 2012–2023
- Export Prices, By Country Of Destination, 2012–2023


