
Thailand - MDF - Market Analysis, Forecast, Size, Trends and Insights
Get instant access to more than 2 million reports, dashboards, and datasets on the IndexBox Platform.
View PricingThailand's MDF Sees a 2% Price Surge, Reaching An Average of $243 per Cubic Meter.
Thailand MDF Export Price in July 2023
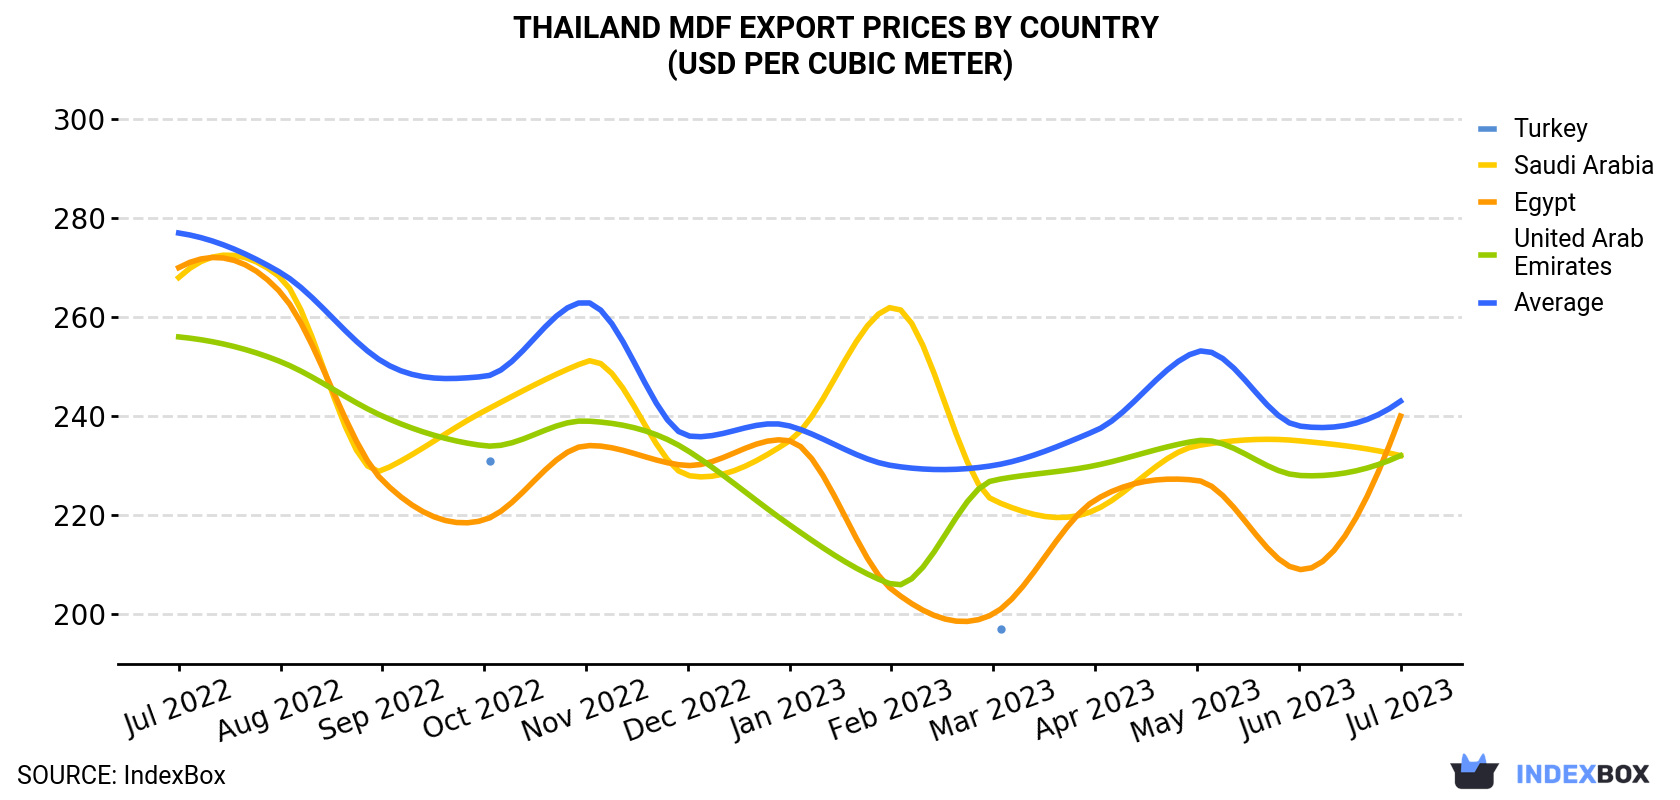
In July 2023, the mdf price stood at $243 per cubic meter (FOB, Thailand), increasing by 2.1% against the previous month. Over the period under review, the export price, however, showed a mild shrinkage. The most prominent rate of growth was recorded in May 2023 an increase of 7.1% month-to-month. Over the period under review, the average export prices hit record highs at $277 per cubic meter in July 2022; however, from August 2022 to July 2023, the export prices failed to regain momentum.
Average prices varied noticeably for the major export markets. In July 2023, the country with the highest price was Egypt ($240 per cubic meter), while the average price for exports to Saudi Arabia ($232 per cubic meter) was amongst the lowest.
From July 2022 to July 2023, the most notable rate of growth in terms of prices was recorded for supplies to the United Arab Emirates (-0.8%), while the prices for the other major destinations experienced a decline.
| COUNTRY | Export Price of MDF in Thailand (USD per cubic meter) | ||||||||||||
|---|---|---|---|---|---|---|---|---|---|---|---|---|---|
| Jul 2022 | Aug 2022 | Sep 2022 | Oct 2022 | Nov 2022 | Dec 2022 | Jan 2023 | Feb 2023 | Mar 2023 | Apr 2023 | May 2023 | Jun 2023 | Jul 2023 | |
| Egypt | 270 | 265 | 227 | 219 | 234 | 230 | 235 | 205 | 200 | 223 | 227 | 209 | 240 |
| Saudi Arabia | 268 | 268 | 229 | 241 | 251 | 228 | 235 | 262 | 223 | 221 | 234 | 235 | 232 |
| United Arab Emirates | 256 | 251 | 240 | 234 | 239 | 233 | 218 | 206 | 227 | 230 | 235 | 228 | 232 |
| Turkey | N/A | N/A | N/A | 231 | N/A | N/A | N/A | N/A | 197 | N/A | N/A | N/A | N/A |
| Average | 277 | 269 | 251 | 248 | 263 | 236 | 238 | 230 | 230 | 237 | 253 | 238 | 243 |
Thailand MDF Export Prices by Type
Average prices varied noticeably for the major types of exported product. In July 2023, the product with the highest price was medium density fibreboard (MDF) of thickness under 5 mm ($259 per cubic meter), while the average price for exports of medium density fibreboard (MDF) of thickness over 9 mm ($236 per cubic meter) was amongst the lowest.
From July 2022 to July 2023, the most notable rate of growth in terms of prices was recorded for the following types: medium density fibreboard (MDF) of thickness under 5 mm (-0.9%), while the prices for the other products experienced a decline.
Thailand MDF Exports
MDF exports from Thailand shrank markedly to 233K cubic meters in July 2023, dropping by -20.6% against June 2023. Over the period under review, total exports indicated a slight increase from July 2022 to July 2023: its volume increased at an average monthly rate of +1.4% over the last twelve months. The trend pattern, however, indicated some noticeable fluctuations being recorded throughout the analyzed period. Based on July 2023 figures, exports increased by +26.9% against May 2023 indices. The growth pace was the most rapid in June 2023 when exports increased by 60% month-to-month. Over the period under review, the exports attained the maximum at 305K cubic meters in March 2023; however, from April 2023 to July 2023, the exports remained at a lower figure.
In value terms, MDF exports dropped markedly to $57M (IndexBox estimates) in July 2023. Overall, exports, however, continue to indicate a relatively flat trend pattern. The pace of growth appeared the most rapid in June 2023 when exports increased by 50% m-o-m. Over the period under review, the exports reached the maximum at 70M cubic meters in March 2023; however, from April 2023 to July 2023, the exports remained at a lower figure.
Thailand MDF Exports by Type
Medium density fibreboard (MDF) of thickness over 9 mm (161K cubic meters) was the largest type of MDF exported from Thailand, accounting for a 69% share of total exports. Moreover, medium density fibreboard (MDF) of thickness over 9 mm exceeded the volume of the second product type, medium density fibreboard (MDF) of thickness under 5 mm (50K cubic meters), threefold.
From July 2022 to July 2023, the average monthly rate of growth in terms of the volume of export of medium density fibreboard (MDF) of thickness over 9 mm amounted to +2.8%. With regard to the other exported products, the following average monthly rates of growth were recorded: medium density fibreboard (MDF) of thickness under 5 mm (-0.9% per month) and medium density fibreboard (MDF) of thickness from 5 to 9 mm (-1.1% per month).
In value terms, medium density fibreboard (MDF) of thickness over 9 mm ($38M) remains the largest type of MDF exported from Thailand, comprising 67% of total exports. The second position in the ranking was taken by medium density fibreboard (MDF) of thickness under 5 mm ($13M), with a 23% share of total exports.
From July 2022 to July 2023, the average monthly growth rate of the export volume of medium density fibreboard (MDF) of thickness over 9 mm amounted to +1.7%. With regard to the other exported products, the following average monthly rates of growth were recorded: medium density fibreboard (MDF) of thickness under 5 mm (-1.8% per month) and medium density fibreboard (MDF) of thickness from 5 to 9 mm (-2.1% per month).
Thailand MDF Exports by Country
the United Arab Emirates (85K cubic meters), Saudi Arabia (55K cubic meters) and Israel (16K cubic meters) were the main destinations of MDF exports from Thailand, with a combined 67% share of total exports.
From July 2022 to July 2023, the biggest increases were in Israel (with a CAGR of +93.3%), while shipments for the other leaders experienced more modest paces of growth.
In value terms, the United Arab Emirates ($20M), Saudi Arabia ($13M) and Israel ($3.8M) constituted the largest markets for MDF exported from Thailand worldwide, together comprising 64% of total exports.
Israel, with a CAGR of +92.9%, saw the highest rates of growth with regard to the value of exports, among the main countries of destination over the period under review, while shipments for the other leaders experienced more modest paces of growth.
This report provides an in-depth analysis of the mdf market in Thailand. Within it, you will discover the latest data on market trends and opportunities by country, consumption, production and price developments, as well as the global trade (imports and exports). The forecast exhibits the market prospects through 2030.
Product coverage:
- FCL 1648 - MDF/HDF
Country coverage:
- Thailand
Data coverage:
- Market volume and value
- Per Capita consumption
- Forecast of the market dynamics in the medium term
- Trade (exports and imports) in Thailand
- Export and import prices
- Market trends, drivers and restraints
- Key market players and their profiles
Reasons to buy this report:
- Take advantage of the latest data
- Find deeper insights into current market developments
- Discover vital success factors affecting the market
This report is designed for manufacturers, distributors, importers, and wholesalers, as well as for investors, consultants and advisors.
In this report, you can find information that helps you to make informed decisions on the following issues:
- How to diversify your business and benefit from new market opportunities
- How to load your idle production capacity
- How to boost your sales on overseas markets
- How to increase your profit margins
- How to make your supply chain more sustainable
- How to reduce your production and supply chain costs
- How to outsource production to other countries
- How to prepare your business for global expansion
While doing this research, we combine the accumulated expertise of our analysts and the capabilities of artificial intelligence. The AI-based platform, developed by our data scientists, constitutes the key working tool for business analysts, empowering them to discover deep insights and ideas from the marketing data.
-
1. INTRODUCTION
Making Data-Driven Decisions to Grow Your Business
- REPORT DESCRIPTION
- RESEARCH METHODOLOGY AND AI PLATFORM
- DATA-DRIVEN DECISIONS FOR YOUR BUSINESS
- GLOSSARY AND SPECIFIC TERMS
-
2. EXECUTIVE SUMMARY
A Quick Overview of Market Performance
- KEY FINDINGS
- MARKET TRENDS This Chapter is Available Only for the Professional Edition PRO
-
3. MARKET OVERVIEW
Understanding the Current State of The Market and Its Prospects
- MARKET SIZE
- MARKET STRUCTURE
- TRADE BALANCE
- PER CAPITA CONSUMPTION
- MARKET FORECAST TO 2030
-
4. MOST PROMISING PRODUCT
Finding New Products to Diversify Your Business
This Chapter is Available Only for the Professional Edition PRO- TOP PRODUCTS TO DIVERSIFY YOUR BUSINESS
- BEST-SELLING PRODUCTS
- MOST CONSUMED PRODUCT
- MOST TRADED PRODUCT
- MOST PROFITABLE PRODUCT FOR EXPORT
-
5. MOST PROMISING SUPPLYING COUNTRIES
Choosing the Best Countries to Establish Your Sustainable Supply Chain
This Chapter is Available Only for the Professional Edition PRO- TOP COUNTRIES TO SOURCE YOUR PRODUCT
- TOP PRODUCING COUNTRIES
- TOP EXPORTING COUNTRIES
- LOW-COST EXPORTING COUNTRIES
-
6. MOST PROMISING OVERSEAS MARKETS
Choosing the Best Countries to Boost Your Exports
This Chapter is Available Only for the Professional Edition PRO- TOP OVERSEAS MARKETS FOR EXPORTING YOUR PRODUCT
- TOP CONSUMING MARKETS
- UNSATURATED MARKETS
- TOP IMPORTING MARKETS
- MOST PROFITABLE MARKETS
7. PRODUCTION
The Latest Trends and Insights into The Industry
- PRODUCTION VOLUME AND VALUE
8. IMPORTS
The Largest Import Supplying Countries
- IMPORTS FROM 2012–2023
- IMPORTS BY COUNTRY
- IMPORT PRICES BY COUNTRY
9. EXPORTS
The Largest Destinations for Exports
- EXPORTS FROM 2012–2023
- EXPORTS BY COUNTRY
- EXPORT PRICES BY COUNTRY
-
10. PROFILES OF MAJOR PRODUCERS
The Largest Producers on The Market and Their Profiles
This Chapter is Available Only for the Professional Edition PRO -
LIST OF TABLES
- Key Findings In 2023
- Market Volume, In Physical Terms, 2012–2023
- Market Value, 2012–2023
- Per Capita Consumption In 2012-2023
- Imports, In Physical Terms, By Country, 2012–2023
- Imports, In Value Terms, By Country, 2012–2023
- Import Prices, By Country Of Origin, 2012–2023
- Exports, In Physical Terms, By Country, 2012–2023
- Exports, In Value Terms, By Country, 2012–2023
- Export Prices, By Country Of Destination, 2012–2023
-
LIST OF FIGURES
- Market Volume, In Physical Terms, 2012–2023
- Market Value, 2012–2023
- Market Structure – Domestic Supply vs. Imports, In Physical Terms, 2012-2023
- Market Structure – Domestic Supply vs. Imports, In Value Terms, 2012-2023
- Trade Balance, In Physical Terms, 2012-2023
- Trade Balance, In Value Terms, 2012-2023
- Per Capita Consumption, 2012-2023
- Market Volume Forecast to 2030
- Market Value Forecast to 2030
- Products: Market Size And Growth, By Type
- Products: Average Per Capita Consumption, By Type
- Products: Exports And Growth, By Type
- Products: Export Prices And Growth, By Type
- Production Volume And Growth
- Exports And Growth
- Export Prices And Growth
- Market Size And Growth
- Per Capita Consumption
- Imports And Growth
- Import Prices
- Production, In Physical Terms, 2012–2023
- Production, In Value Terms, 2012–2023
- Imports, In Physical Terms, 2012–2023
- Imports, In Value Terms, 2012–2023
- Imports, In Physical Terms, By Country, 2023
- Imports, In Physical Terms, By Country, 2012–2023
- Imports, In Value Terms, By Country, 2012–2023
- Import Prices, By Country Of Origin, 2012–2023
- Exports, In Physical Terms, 2012–2023
- Exports, In Value Terms, 2012–2023
- Exports, In Physical Terms, By Country, 2023
- Exports, In Physical Terms, By Country, 2012–2023
- Exports, In Value Terms, By Country, 2012–2023
- Export Prices, By Country Of Destination, 2012–2023


