
Thailand - Frozen Fish - Market Analysis, Forecast, Size, Trends and Insights
Get instant access to more than 2 million reports, dashboards, and datasets on the IndexBox Platform.
View PricingThailand's Frozen Fish Import Plummets to $139M in July 2023
Thailand Frozen Fish Imports
In July 2023, overseas purchases of frozen fish decreased by -19.7% to 66K tons, falling for the second consecutive month after three months of growth. Overall, imports continue to indicate a perceptible curtailment. The growth pace was the most rapid in August 2022 with an increase of 30% month-to-month. As a result, imports reached the peak of 127K tons. From September 2022 to July 2023, the growth of imports remained at a somewhat lower figure.
In value terms, frozen fish imports reduced to $139M (IndexBox estimates) in July 2023. Over the period under review, imports recorded a mild decline. The most prominent rate of growth was recorded in August 2022 when imports increased by 35% m-o-m. 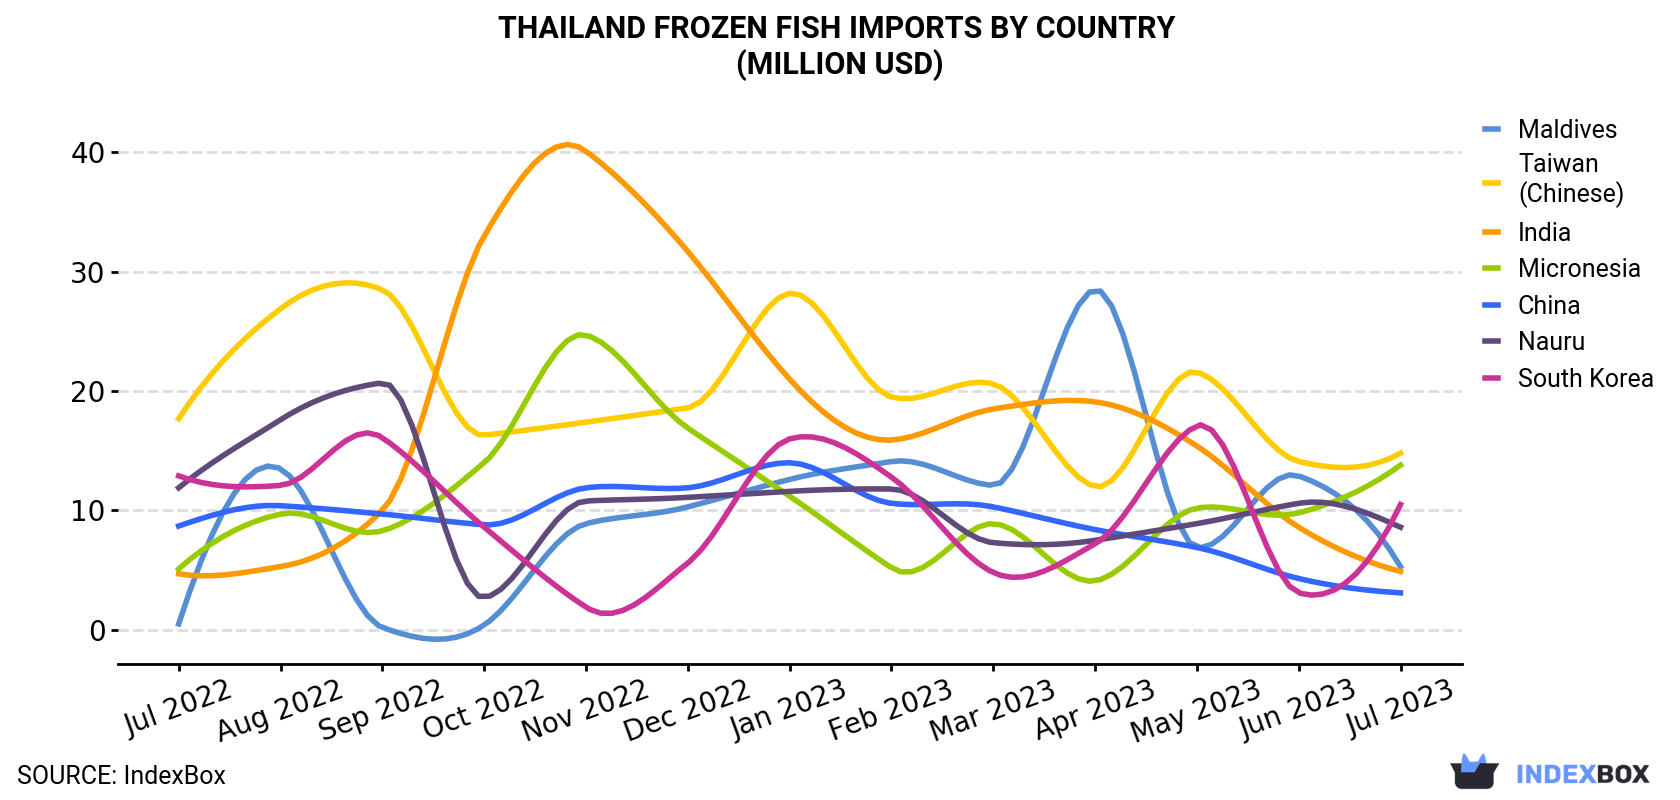
| COUNTRY | Import Value of Frozen Fish in Thailand (million USD) | ||||||||||||
|---|---|---|---|---|---|---|---|---|---|---|---|---|---|
| Jul 2022 | Aug 2022 | Sep 2022 | Oct 2022 | Nov 2022 | Dec 2022 | Jan 2023 | Feb 2023 | Mar 2023 | Apr 2023 | May 2023 | Jun 2023 | Jul 2023 | |
| Taiwan (Chinese) | 17.7 | 26.9 | 28.5 | 16.3 | 17.4 | 18.6 | 28.2 | 19.5 | 20.6 | 12.0 | 21.6 | 14.1 | 14.8 |
| Micronesia | 5.1 | 9.7 | 8.3 | 14.0 | 24.7 | 16.9 | 11.2 | 5.2 | 8.9 | 4.1 | 10.2 | 9.8 | 13.8 |
| South Korea | 12.9 | 12.1 | 16.1 | 8.6 | 1.9 | 5.6 | 16.0 | 12.8 | 4.8 | 7.2 | 17.1 | 3.1 | 10.5 |
| Nauru | 11.9 | 17.6 | 20.7 | 2.7 | 10.8 | 11.1 | 11.6 | 11.8 | 7.3 | 7.5 | 8.9 | 10.6 | 8.6 |
| Maldives | 0.5 | 13.5 | 0.2 | 0.4 | 8.9 | 10.3 | 12.6 | 14.1 | 12.1 | 28.5 | 6.9 | 12.9 | 5.3 |
| India | 4.7 | 5.3 | 10.0 | 33.0 | 40.1 | 31.7 | 21.0 | 15.9 | 18.5 | 19.1 | 15.4 | 8.6 | 4.9 |
| China | 8.7 | 10.4 | 9.7 | 8.8 | 11.9 | 11.9 | 14.0 | 10.6 | 10.3 | 8.4 | 6.9 | 4.3 | 3.1 |
| Others | 105 | 130 | 111 | 120 | 105 | 128 | 108 | 85.6 | 103 | 102 | 116 | 94.1 | 78.0 |
| Total | 167 | 226 | 204 | 204 | 221 | 234 | 223 | 176 | 185 | 189 | 203 | 157 | 139 |
Imports by Country
Micronesia (6.6K tons), Taiwan (Chinese) (6.4K tons) and South Korea (5K tons) were the main suppliers of frozen fish imports to Thailand, together comprising 27% of total imports. These countries were followed by Nauru, India, Maldives and China, which together accounted for a further 17%.
From July 2022 to July 2023, the biggest increases were in Maldives (with a CAGR of +20.5%), while purchases for the other leaders experienced more modest paces of growth.
In value terms, Taiwan (Chinese) ($15M), Micronesia ($14M) and South Korea ($11M) appeared to be the largest frozen fish suppliers to Thailand, together accounting for 28% of total imports. These countries were followed by Nauru, Maldives, India and China, which together accounted for a further 16%.
Maldives, with a CAGR of +22.2%, recorded the highest growth rate of the value of imports, among the main suppliers over the period under review, while purchases for the other leaders experienced more modest paces of growth.
Imports by Type
In July 2023, frozen whole fish (60K tons) was the main type of frozen fish supplied to Thailand, accounting for a 91% share of total imports. Moreover, frozen whole fish exceeded the figures recorded for the second-largest type, frozen fish meat (4.2K tons), more than tenfold.
From July 2022 to July 2023, the average monthly growth rate of the volume of import of frozen whole fish totaled -3.4%. With regard to the other supplied products, the following average monthly rates of growth were recorded: frozen fish meat (-1.6% per month) and frozen fish fillet (-3.3% per month).
In value terms, frozen whole fish ($124M) constituted the largest type of frozen fish supplied to Thailand, comprising 89% of total imports. The second position in the ranking was taken by frozen fish meat ($11M), with a 7.6% share of total imports.
Import Prices by Country
In July 2023, the frozen fish price stood at $2,114 per ton (CIF, Thailand), rising by 9.9% against the previous month. Over the last twelve months, it increased at an average monthly rate of +1.8%. As a result, import price reached the peak level and is likely to continue growth in the immediate term.
There were significant differences in the average prices amongst the major supplying countries. In July 2023, the country with the highest price was Norway ($2,860 per ton), while the price for Pakistan ($1,214 per ton) was amongst the lowest.
From July 2022 to July 2023, the most notable rate of growth in terms of prices was attained by Japan (+6.6%), while the prices for the other major suppliers experienced more modest paces of growth.
This report provides an in-depth analysis of the frozen fish market in Thailand. Within it, you will discover the latest data on market trends and opportunities by country, consumption, production and price developments, as well as the global trade (imports and exports). The forecast exhibits the market prospects through 2030.
Product coverage:
- Prodcom 10201330 - Frozen whole salt water fish
- Prodcom 10201360 - Frozen whole fresh water fish
- Prodcom 10201400 - Frozen fish fillets
- Prodcom 10201500 - Frozen fish meat without bones (excluding fillets)
- Prodcom 10201600 - Frozen fish livers and roes
Country coverage:
- Thailand
Data coverage:
- Market volume and value
- Per Capita consumption
- Forecast of the market dynamics in the medium term
- Trade (exports and imports) in Thailand
- Export and import prices
- Market trends, drivers and restraints
- Key market players and their profiles
Reasons to buy this report:
- Take advantage of the latest data
- Find deeper insights into current market developments
- Discover vital success factors affecting the market
This report is designed for manufacturers, distributors, importers, and wholesalers, as well as for investors, consultants and advisors.
In this report, you can find information that helps you to make informed decisions on the following issues:
- How to diversify your business and benefit from new market opportunities
- How to load your idle production capacity
- How to boost your sales on overseas markets
- How to increase your profit margins
- How to make your supply chain more sustainable
- How to reduce your production and supply chain costs
- How to outsource production to other countries
- How to prepare your business for global expansion
While doing this research, we combine the accumulated expertise of our analysts and the capabilities of artificial intelligence. The AI-based platform, developed by our data scientists, constitutes the key working tool for business analysts, empowering them to discover deep insights and ideas from the marketing data.
-
1. INTRODUCTION
Making Data-Driven Decisions to Grow Your Business
- REPORT DESCRIPTION
- RESEARCH METHODOLOGY AND AI PLATFORM
- DATA-DRIVEN DECISIONS FOR YOUR BUSINESS
- GLOSSARY AND SPECIFIC TERMS
-
2. EXECUTIVE SUMMARY
A Quick Overview of Market Performance
- KEY FINDINGS
- MARKET TRENDS This Chapter is Available Only for the Professional Edition PRO
-
3. MARKET OVERVIEW
Understanding the Current State of The Market and Its Prospects
- MARKET SIZE
- MARKET STRUCTURE
- TRADE BALANCE
- PER CAPITA CONSUMPTION
- MARKET FORECAST TO 2030
-
4. MOST PROMISING PRODUCT
Finding New Products to Diversify Your Business
This Chapter is Available Only for the Professional Edition PRO- TOP PRODUCTS TO DIVERSIFY YOUR BUSINESS
- BEST-SELLING PRODUCTS
- MOST CONSUMED PRODUCT
- MOST TRADED PRODUCT
- MOST PROFITABLE PRODUCT FOR EXPORT
-
5. MOST PROMISING SUPPLYING COUNTRIES
Choosing the Best Countries to Establish Your Sustainable Supply Chain
This Chapter is Available Only for the Professional Edition PRO- TOP COUNTRIES TO SOURCE YOUR PRODUCT
- TOP PRODUCING COUNTRIES
- TOP EXPORTING COUNTRIES
- LOW-COST EXPORTING COUNTRIES
-
6. MOST PROMISING OVERSEAS MARKETS
Choosing the Best Countries to Boost Your Exports
This Chapter is Available Only for the Professional Edition PRO- TOP OVERSEAS MARKETS FOR EXPORTING YOUR PRODUCT
- TOP CONSUMING MARKETS
- UNSATURATED MARKETS
- TOP IMPORTING MARKETS
- MOST PROFITABLE MARKETS
7. PRODUCTION
The Latest Trends and Insights into The Industry
- PRODUCTION VOLUME AND VALUE
8. IMPORTS
The Largest Import Supplying Countries
- IMPORTS FROM 2012–2023
- IMPORTS BY COUNTRY
- IMPORT PRICES BY COUNTRY
9. EXPORTS
The Largest Destinations for Exports
- EXPORTS FROM 2012–2023
- EXPORTS BY COUNTRY
- EXPORT PRICES BY COUNTRY
-
10. PROFILES OF MAJOR PRODUCERS
The Largest Producers on The Market and Their Profiles
This Chapter is Available Only for the Professional Edition PRO -
LIST OF TABLES
- Key Findings In 2023
- Market Volume, In Physical Terms, 2012–2023
- Market Value, 2012–2023
- Per Capita Consumption In 2012-2023
- Imports, In Physical Terms, By Country, 2012–2023
- Imports, In Value Terms, By Country, 2012–2023
- Import Prices, By Country Of Origin, 2012–2023
- Exports, In Physical Terms, By Country, 2012–2023
- Exports, In Value Terms, By Country, 2012–2023
- Export Prices, By Country Of Destination, 2012–2023
-
LIST OF FIGURES
- Market Volume, In Physical Terms, 2012–2023
- Market Value, 2012–2023
- Market Structure – Domestic Supply vs. Imports, In Physical Terms, 2012-2023
- Market Structure – Domestic Supply vs. Imports, In Value Terms, 2012-2023
- Trade Balance, In Physical Terms, 2012-2023
- Trade Balance, In Value Terms, 2012-2023
- Per Capita Consumption, 2012-2023
- Market Volume Forecast to 2030
- Market Value Forecast to 2030
- Products: Market Size And Growth, By Type
- Products: Average Per Capita Consumption, By Type
- Products: Exports And Growth, By Type
- Products: Export Prices And Growth, By Type
- Production Volume And Growth
- Exports And Growth
- Export Prices And Growth
- Market Size And Growth
- Per Capita Consumption
- Imports And Growth
- Import Prices
- Production, In Physical Terms, 2012–2023
- Production, In Value Terms, 2012–2023
- Imports, In Physical Terms, 2012–2023
- Imports, In Value Terms, 2012–2023
- Imports, In Physical Terms, By Country, 2023
- Imports, In Physical Terms, By Country, 2012–2023
- Imports, In Value Terms, By Country, 2012–2023
- Import Prices, By Country Of Origin, 2012–2023
- Exports, In Physical Terms, 2012–2023
- Exports, In Value Terms, 2012–2023
- Exports, In Physical Terms, By Country, 2023
- Exports, In Physical Terms, By Country, 2012–2023
- Exports, In Value Terms, By Country, 2012–2023
- Export Prices, By Country Of Destination, 2012–2023


