Thailand - Ethers - Market Analysis, Forecast, Size, Trends and Insights
Get instant access to more than 2 million reports, dashboards, and datasets on the IndexBox Platform.
View PricingThailand's September 2023 Ethereal Exports Plummet to $9.2M
Thailand Ether Exports
Ether exports from Thailand contracted notably to 9.1K tons in September 2023, reducing by -43.1% compared with August 2023. In general, exports continue to indicate a mild decrease. The pace of growth was the most pronounced in August 2023 with an increase of 416% m-o-m. As a result, the exports reached the peak of 16K tons, and then reduced dramatically in the following month.
In value terms, ether exports fell notably to $9.2M (IndexBox estimates) in September 2023. Over the period under review, exports saw a pronounced reduction. The growth pace was the most rapid in August 2023 with an increase of 296% against the previous month. As a result, the exports attained the peak of $16M, and then contracted remarkably in the following month.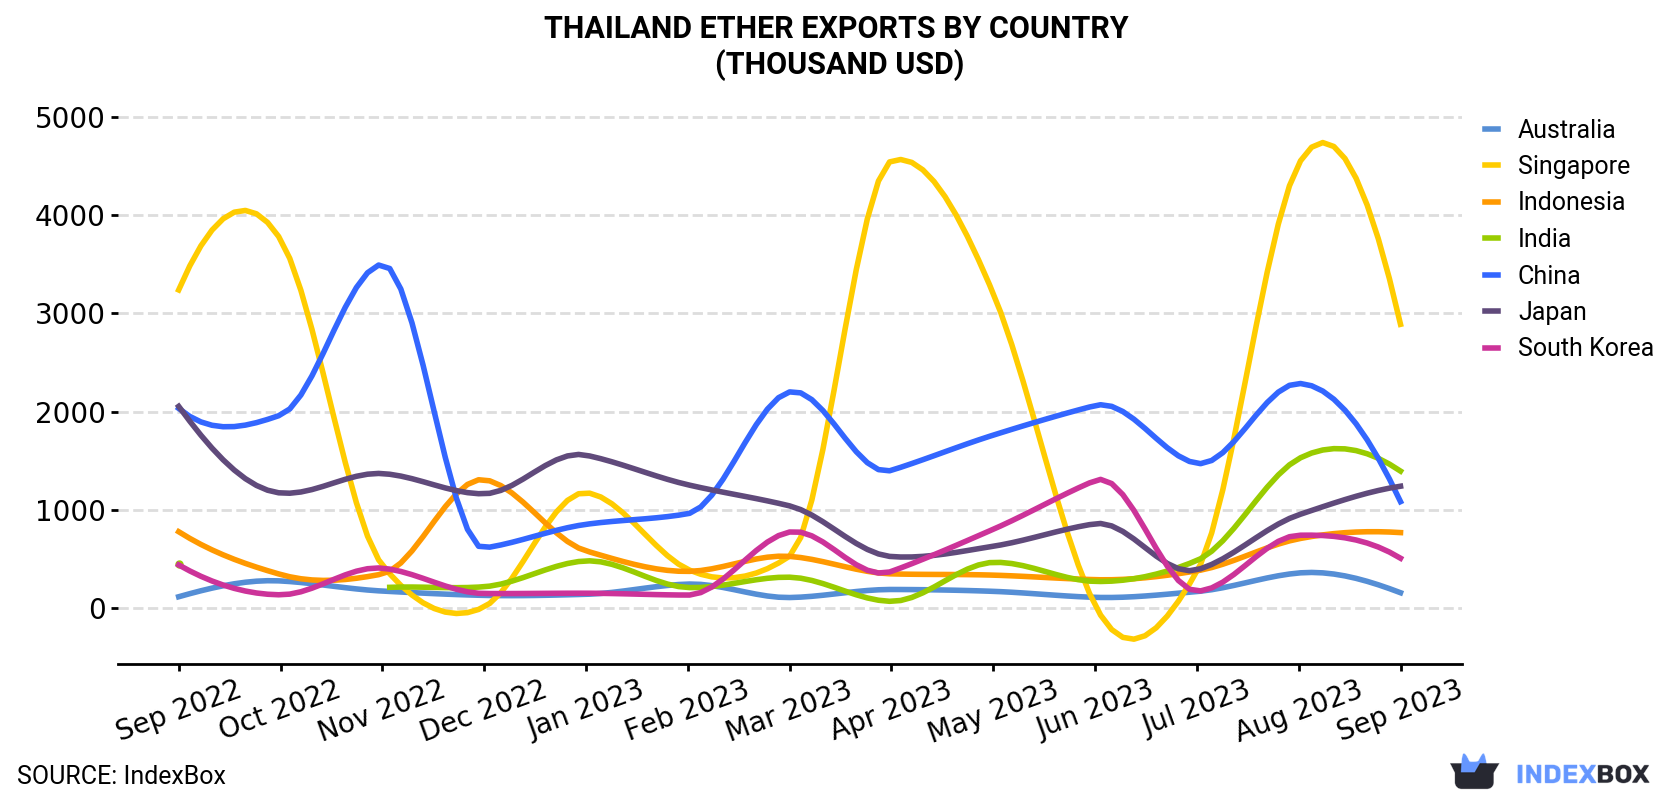
| COUNTRY | Export Value of Ether in Thailand (thousand USD) | ||||||||||||
|---|---|---|---|---|---|---|---|---|---|---|---|---|---|
| Sep 2022 | Oct 2022 | Nov 2022 | Dec 2022 | Jan 2023 | Feb 2023 | Mar 2023 | Apr 2023 | May 2023 | Jun 2023 | Jul 2023 | Aug 2023 | Sep 2023 | |
| Singapore | 3,239 | 3,753 | 438 | 12.4 | 1,175 | 395 | 529 | 4,552 | 3,203 | 30.2 | 372 | 4,521 | 2,889 |
| India | 454 | N/A | 208 | 218 | 481 | 210 | 315 | 69.3 | 466 | 272 | 485 | 1,521 | 1,395 |
| Japan | 2,054 | 1,172 | 1,370 | 1,164 | 1,557 | 1,256 | 1,041 | 525 | 630 | 859 | 390 | 950 | 1,241 |
| China | 2,033 | 1,965 | 3,499 | 612 | 853 | 961 | 2,201 | 1,403 | 1,761 | 2,062 | 1,473 | 2,287 | 1,084 |
| Indonesia | 778 | 343 | 348 | 1,308 | 583 | 374 | 527 | 349 | 336 | 290 | 380 | 706 | 769 |
| South Korea | 440 | 136 | 407 | 149 | 152 | 133 | 775 | 374 | 803 | 1,299 | 173 | 742 | 508 |
| Australia | 116 | 277 | 174 | 130 | 141 | 245 | 108 | 190 | 171 | 110 | 169 | 358 | 157 |
| Others | 3,425 | 3,179 | 3,098 | 159 | 294 | 299 | 3,019 | 1,802 | 2,787 | 2,924 | 487 | 4,480 | 1,113 |
| Total | 12,541 | 10,825 | 9,540 | 3,752 | 5,235 | 3,874 | 8,514 | 9,264 | 10,157 | 7,845 | 3,929 | 15,565 | 9,158 |
Exports by Country
Singapore (3K tons), India (1.7K tons) and Japan (1.1K tons) were the main destinations of ether exports from Thailand, together accounting for 64% of total exports.
From September 2022 to September 2023, the most notable rate of growth in terms of shipments, amongst the main countries of destination, was attained by India (with a CAGR of +12.0%), while the other leaders experienced more modest paces of growth.
In value terms, Singapore ($2.9M) remains the key foreign market for ether exports from Thailand, comprising 32% of total exports. The second position in the ranking was taken by India ($1.4M), with a 15% share of total exports. It was followed by Japan, with a 14% share.
From September 2022 to September 2023, the average monthly rate of growth in terms of value to Singapore was relatively modest. Exports to the other major destinations recorded the following average monthly rates of exports growth: India (+9.8% per month) and Japan (-4.1% per month).
Export Prices by Country
In September 2023, the ether price amounted to $1,002 per ton (FOB, Thailand), growing by 3.3% against the previous month. Overall, the export price, however, continues to indicate a relatively flat trend pattern. The most prominent rate of growth was recorded in December 2022 when the average export price increased by 16% against the previous month. As a result, the export price reached the peak level of $1,389 per ton. From January 2023 to September 2023, the the average export prices remained at a lower figure.
There were significant differences in the average prices for the major overseas markets. In September 2023, the country with the highest price was South Korea ($1,559 per ton), while the average price for exports to Vietnam ($799 per ton) was amongst the lowest.
From September 2022 to September 2023, the most notable rate of growth in terms of prices was recorded for supplies to Japan (+0.6%), while the prices for the other major destinations experienced mixed trend patterns.
This report provides an in-depth analysis of the ether market in Thailand. Within it, you will discover the latest data on market trends and opportunities by country, consumption, production and price developments, as well as the global trade (imports and exports). The forecast exhibits the market prospects through 2030.
Product coverage:
- Prodcom 20146310 - Acyclic ethers and their halogenated, sulphonated, nitrated or nitrosated derivatives
- Prodcom 20146323 - Cyclanic, cyclenic or cycloterpenic ethers and their halogenated, sulphonated, nitrated or nitrosated derivatives
- Prodcom 20146325 - Aromatic ethers and their halogenated, sulphonated, nitrated or nitrosated derivatives
- Prodcom 20146333 - 2,2-Oxydiethanol (diethylene glycol, digol)
- Prodcom 20146339 - Ether-alcohols and their halogenated, sulphonated, nitrated or nitrosated derivatives (excluding 2,2-Oxydiethanol)
- Prodcom 20146350 - Ether-phenols, ether-alcohol-phenols and their halogenated, s ulphonated, nitrated or nitrosated derivatives
- Prodcom 20146360 - Alcohol, ether and ketone peroxides and their halogenated, s ulphonated, nitrated or nitrosated derivatives
Country coverage:
- Thailand
Data coverage:
- Market volume and value
- Per Capita consumption
- Forecast of the market dynamics in the medium term
- Trade (exports and imports) in Thailand
- Export and import prices
- Market trends, drivers and restraints
- Key market players and their profiles
Reasons to buy this report:
- Take advantage of the latest data
- Find deeper insights into current market developments
- Discover vital success factors affecting the market
This report is designed for manufacturers, distributors, importers, and wholesalers, as well as for investors, consultants and advisors.
In this report, you can find information that helps you to make informed decisions on the following issues:
- How to diversify your business and benefit from new market opportunities
- How to load your idle production capacity
- How to boost your sales on overseas markets
- How to increase your profit margins
- How to make your supply chain more sustainable
- How to reduce your production and supply chain costs
- How to outsource production to other countries
- How to prepare your business for global expansion
While doing this research, we combine the accumulated expertise of our analysts and the capabilities of artificial intelligence. The AI-based platform, developed by our data scientists, constitutes the key working tool for business analysts, empowering them to discover deep insights and ideas from the marketing data.
-
1. INTRODUCTION
Making Data-Driven Decisions to Grow Your Business
- REPORT DESCRIPTION
- RESEARCH METHODOLOGY AND AI PLATFORM
- DATA-DRIVEN DECISIONS FOR YOUR BUSINESS
- GLOSSARY AND SPECIFIC TERMS
-
2. EXECUTIVE SUMMARY
A Quick Overview of Market Performance
- KEY FINDINGS
- MARKET TRENDS This Chapter is Available Only for the Professional Edition PRO
-
3. MARKET OVERVIEW
Understanding the Current State of The Market and Its Prospects
- MARKET SIZE
- MARKET STRUCTURE
- TRADE BALANCE
- PER CAPITA CONSUMPTION
- MARKET FORECAST TO 2030
-
4. MOST PROMISING PRODUCT
Finding New Products to Diversify Your Business
This Chapter is Available Only for the Professional Edition PRO- TOP PRODUCTS TO DIVERSIFY YOUR BUSINESS
- BEST-SELLING PRODUCTS
- MOST CONSUMED PRODUCT
- MOST TRADED PRODUCT
- MOST PROFITABLE PRODUCT FOR EXPORT
-
5. MOST PROMISING SUPPLYING COUNTRIES
Choosing the Best Countries to Establish Your Sustainable Supply Chain
This Chapter is Available Only for the Professional Edition PRO- TOP COUNTRIES TO SOURCE YOUR PRODUCT
- TOP PRODUCING COUNTRIES
- TOP EXPORTING COUNTRIES
- LOW-COST EXPORTING COUNTRIES
-
6. MOST PROMISING OVERSEAS MARKETS
Choosing the Best Countries to Boost Your Exports
This Chapter is Available Only for the Professional Edition PRO- TOP OVERSEAS MARKETS FOR EXPORTING YOUR PRODUCT
- TOP CONSUMING MARKETS
- UNSATURATED MARKETS
- TOP IMPORTING MARKETS
- MOST PROFITABLE MARKETS
7. PRODUCTION
The Latest Trends and Insights into The Industry
- PRODUCTION VOLUME AND VALUE
8. IMPORTS
The Largest Import Supplying Countries
- IMPORTS FROM 2012–2023
- IMPORTS BY COUNTRY
- IMPORT PRICES BY COUNTRY
9. EXPORTS
The Largest Destinations for Exports
- EXPORTS FROM 2012–2023
- EXPORTS BY COUNTRY
- EXPORT PRICES BY COUNTRY
-
10. PROFILES OF MAJOR PRODUCERS
The Largest Producers on The Market and Their Profiles
This Chapter is Available Only for the Professional Edition PRO -
LIST OF TABLES
- Key Findings In 2023
- Market Volume, In Physical Terms, 2012–2023
- Market Value, 2012–2023
- Per Capita Consumption In 2012-2023
- Imports, In Physical Terms, By Country, 2012–2023
- Imports, In Value Terms, By Country, 2012–2023
- Import Prices, By Country Of Origin, 2012–2023
- Exports, In Physical Terms, By Country, 2012–2023
- Exports, In Value Terms, By Country, 2012–2023
- Export Prices, By Country Of Destination, 2012–2023
-
LIST OF FIGURES
- Market Volume, In Physical Terms, 2012–2023
- Market Value, 2012–2023
- Market Structure – Domestic Supply vs. Imports, In Physical Terms, 2012-2023
- Market Structure – Domestic Supply vs. Imports, In Value Terms, 2012-2023
- Trade Balance, In Physical Terms, 2012-2023
- Trade Balance, In Value Terms, 2012-2023
- Per Capita Consumption, 2012-2023
- Market Volume Forecast to 2030
- Market Value Forecast to 2030
- Products: Market Size And Growth, By Type
- Products: Average Per Capita Consumption, By Type
- Products: Exports And Growth, By Type
- Products: Export Prices And Growth, By Type
- Production Volume And Growth
- Exports And Growth
- Export Prices And Growth
- Market Size And Growth
- Per Capita Consumption
- Imports And Growth
- Import Prices
- Production, In Physical Terms, 2012–2023
- Production, In Value Terms, 2012–2023
- Imports, In Physical Terms, 2012–2023
- Imports, In Value Terms, 2012–2023
- Imports, In Physical Terms, By Country, 2023
- Imports, In Physical Terms, By Country, 2012–2023
- Imports, In Value Terms, By Country, 2012–2023
- Import Prices, By Country Of Origin, 2012–2023
- Exports, In Physical Terms, 2012–2023
- Exports, In Value Terms, 2012–2023
- Exports, In Physical Terms, By Country, 2023
- Exports, In Physical Terms, By Country, 2012–2023
- Exports, In Value Terms, By Country, 2012–2023
- Export Prices, By Country Of Destination, 2012–2023


