South Africa - Synthetic Organic Coloring Matter And Pigments - Market Analysis, Forecast, Size, Trends and Insights
Get instant access to more than 2 million reports, dashboards, and datasets on the IndexBox Platform.
View PricingSignificant Drop in Import of Organic Pigments in South Africa to $6.6M in September 2023
South Africa Organic Pigments Imports
In September 2023, organic pigments imports into South Africa shrank rapidly to 1.1K tons, falling by -16% compared with August 2023 figures. Overall, imports, however, recorded a relatively flat trend pattern. The growth pace was the most rapid in March 2023 when imports increased by 105% against the previous month.
In value terms, organic pigments imports reduced to $6.6M (IndexBox estimates) in September 2023. Over the period under review, imports continue to indicate a mild decrease. The pace of growth was the most pronounced in March 2023 when imports increased by 65% month-to-month.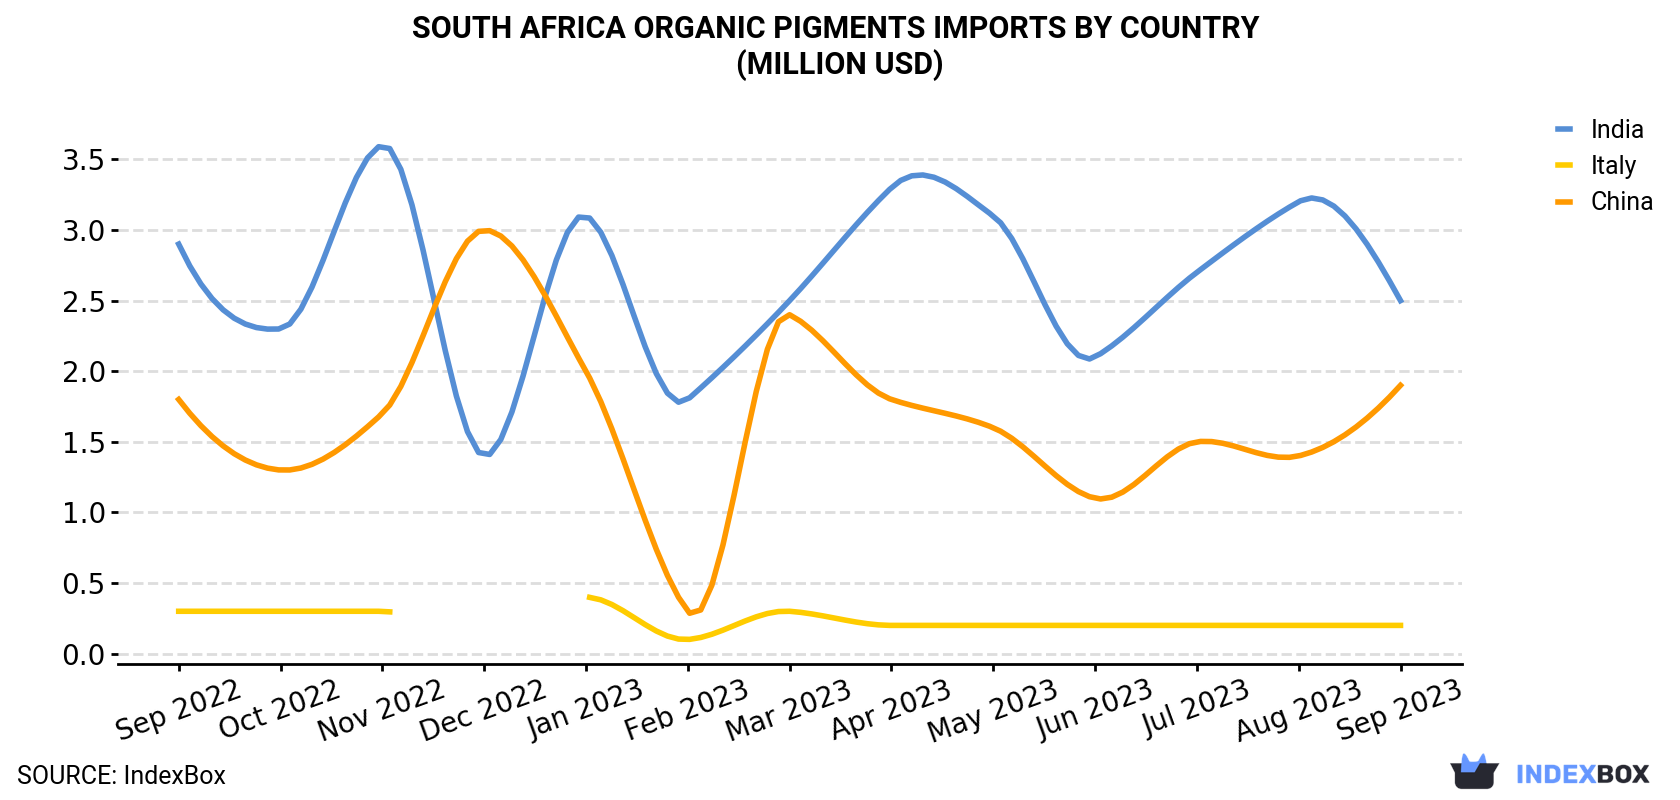
| COUNTRY | Import Value of Organic Pigments in South Africa (million USD) | ||||||||||||
|---|---|---|---|---|---|---|---|---|---|---|---|---|---|
| Sep 2022 | Oct 2022 | Nov 2022 | Dec 2022 | Jan 2023 | Feb 2023 | Mar 2023 | Apr 2023 | May 2023 | Jun 2023 | Jul 2023 | Aug 2023 | Sep 2023 | |
| India | 2.9 | 2.3 | 3.6 | 1.4 | 3.1 | 1.8 | 2.5 | 3.3 | 3.1 | 2.1 | 2.7 | 3.2 | 2.5 |
| China | 1.8 | 1.3 | 1.7 | 3.0 | 2.0 | 0.3 | 2.4 | 1.8 | 1.6 | 1.1 | 1.5 | 1.4 | 1.9 |
| Italy | 0.3 | 0.3 | 0.3 | < 0.1 | 0.4 | 0.1 | 0.3 | 0.2 | 0.2 | 0.2 | 0.2 | 0.2 | 0.2 |
| Others | 2.9 | 1.9 | 2.0 | 1.5 | 2.9 | 1.9 | 1.8 | 2.7 | 2.5 | 3.2 | 1.8 | 2.3 | 2.0 |
| Total | 7.9 | 5.9 | 7.7 | 6.0 | 8.3 | 4.2 | 6.9 | 8.0 | 7.4 | 6.6 | 6.2 | 7.0 | 6.6 |
Imports by Country
India (488 tons), China (465 tons) and Italy (10 tons) were the main suppliers of organic pigments imports to South Africa, with a combined 87% share of total imports.
From September 2022 to September 2023, the most notable rate of growth in terms of purchases, amongst the main suppliers, was attained by China (with a CAGR of +3.4%), while imports for the other leaders experienced a decline.
In value terms, the largest organic pigments suppliers to South Africa were India ($2.5M), China ($1.9M) and Italy ($211K), together comprising 70% of total imports.
Among the main suppliers, China, with a CAGR of +0.2%, recorded the highest growth rate of the value of imports, over the period under review, while purchases for the other leaders experienced a decline.
Imports by Type
In September 2023, synthetic organic colouring matter and preparations based thereon; synthetic organic products used as fluorescent brightening agents or as luminophores; whether or not chemically defined (1.1K tons) was the main type of organic pigments supplied to South Africa, with a 97% share of total imports. It was followed by colour lakes, preparations based on colour lakes (32 tons), with a 2.9% share of total imports.
From September 2022 to September 2023, the average monthly growth rate of the volume of import of synthetic organic colouring matter and preparations based thereon; synthetic organic products used as fluorescent brightening agents or as luminophores; whether or not chemically defined was relatively modest.
In value terms, synthetic organic colouring matter and preparations based thereon; synthetic organic products used as fluorescent brightening agents or as luminophores; whether or not chemically defined ($6.1M) constituted the largest type of organic pigments supplied to South Africa, comprising 93% of total imports. The second position in the ranking was taken by colour lakes, preparations based on colour lakes ($445K), with a 6.8% share of total imports.
Import Prices by Country
In September 2023, the organic pigments price amounted to $5,974 per ton (CIF, South Africa), growing by 11% against the previous month. In general, the import price, however, saw a slight slump. Over the period under review, average import prices attained the peak figure at $7,976 per ton in February 2023; however, from March 2023 to September 2023, import prices stood at a somewhat lower figure.
Prices varied noticeably by the country of origin: the country with the highest price was Italy ($20,925 per ton), while the price for China ($4,015 per ton) was amongst the lowest.
From September 2022 to September 2023, the most notable rate of growth in terms of prices was attained by Egypt (+25.7%), while the prices for the other major suppliers experienced more modest paces of growth.
This report provides an in-depth analysis of the organic pigments market in South Africa. Within it, you will discover the latest data on market trends and opportunities by country, consumption, production and price developments, as well as the global trade (imports and exports). The forecast exhibits the market prospects through 2030.
Product coverage:
- Prodcom 20122110 - Disperse dyes and preparations based thereon
- Prodcom 20122120 - Acid and mordant dyes and preparations based thereon
- Prodcom 20122130 - Basic dyes and preparations based thereon
- Prodcom 20122140 - Direct dyes and preparations based thereon
- Prodcom 20122150 - Other synthetic organic colouring matters
- Prodcom 20122160 - Synthetic organic products used as fluorescent brightening agents
- Prodcom 20122170 - Colour lakes, preparations based on colour lakes
Country coverage:
- South Africa
Data coverage:
- Market volume and value
- Per Capita consumption
- Forecast of the market dynamics in the medium term
- Trade (exports and imports) in South Africa
- Export and import prices
- Market trends, drivers and restraints
- Key market players and their profiles
Reasons to buy this report:
- Take advantage of the latest data
- Find deeper insights into current market developments
- Discover vital success factors affecting the market
This report is designed for manufacturers, distributors, importers, and wholesalers, as well as for investors, consultants and advisors.
In this report, you can find information that helps you to make informed decisions on the following issues:
- How to diversify your business and benefit from new market opportunities
- How to load your idle production capacity
- How to boost your sales on overseas markets
- How to increase your profit margins
- How to make your supply chain more sustainable
- How to reduce your production and supply chain costs
- How to outsource production to other countries
- How to prepare your business for global expansion
While doing this research, we combine the accumulated expertise of our analysts and the capabilities of artificial intelligence. The AI-based platform, developed by our data scientists, constitutes the key working tool for business analysts, empowering them to discover deep insights and ideas from the marketing data.
-
1. INTRODUCTION
Making Data-Driven Decisions to Grow Your Business
- REPORT DESCRIPTION
- RESEARCH METHODOLOGY AND AI PLATFORM
- DATA-DRIVEN DECISIONS FOR YOUR BUSINESS
- GLOSSARY AND SPECIFIC TERMS
-
2. EXECUTIVE SUMMARY
A Quick Overview of Market Performance
- KEY FINDINGS
- MARKET TRENDS This Chapter is Available Only for the Professional Edition PRO
-
3. MARKET OVERVIEW
Understanding the Current State of The Market and Its Prospects
- MARKET SIZE
- MARKET STRUCTURE
- TRADE BALANCE
- PER CAPITA CONSUMPTION
- MARKET FORECAST TO 2030
-
4. MOST PROMISING PRODUCT
Finding New Products to Diversify Your Business
This Chapter is Available Only for the Professional Edition PRO- TOP PRODUCTS TO DIVERSIFY YOUR BUSINESS
- BEST-SELLING PRODUCTS
- MOST CONSUMED PRODUCT
- MOST TRADED PRODUCT
- MOST PROFITABLE PRODUCT FOR EXPORT
-
5. MOST PROMISING SUPPLYING COUNTRIES
Choosing the Best Countries to Establish Your Sustainable Supply Chain
This Chapter is Available Only for the Professional Edition PRO- TOP COUNTRIES TO SOURCE YOUR PRODUCT
- TOP PRODUCING COUNTRIES
- TOP EXPORTING COUNTRIES
- LOW-COST EXPORTING COUNTRIES
-
6. MOST PROMISING OVERSEAS MARKETS
Choosing the Best Countries to Boost Your Exports
This Chapter is Available Only for the Professional Edition PRO- TOP OVERSEAS MARKETS FOR EXPORTING YOUR PRODUCT
- TOP CONSUMING MARKETS
- UNSATURATED MARKETS
- TOP IMPORTING MARKETS
- MOST PROFITABLE MARKETS
7. PRODUCTION
The Latest Trends and Insights into The Industry
- PRODUCTION VOLUME AND VALUE
8. IMPORTS
The Largest Import Supplying Countries
- IMPORTS FROM 2012–2023
- IMPORTS BY COUNTRY
- IMPORT PRICES BY COUNTRY
9. EXPORTS
The Largest Destinations for Exports
- EXPORTS FROM 2012–2023
- EXPORTS BY COUNTRY
- EXPORT PRICES BY COUNTRY
-
10. PROFILES OF MAJOR PRODUCERS
The Largest Producers on The Market and Their Profiles
This Chapter is Available Only for the Professional Edition PRO -
LIST OF TABLES
- Key Findings In 2023
- Market Volume, In Physical Terms, 2012–2023
- Market Value, 2012–2023
- Per Capita Consumption In 2012-2023
- Imports, In Physical Terms, By Country, 2012–2023
- Imports, In Value Terms, By Country, 2012–2023
- Import Prices, By Country Of Origin, 2012–2023
- Exports, In Physical Terms, By Country, 2012–2023
- Exports, In Value Terms, By Country, 2012–2023
- Export Prices, By Country Of Destination, 2012–2023
-
LIST OF FIGURES
- Market Volume, In Physical Terms, 2012–2023
- Market Value, 2012–2023
- Market Structure – Domestic Supply vs. Imports, In Physical Terms, 2012-2023
- Market Structure – Domestic Supply vs. Imports, In Value Terms, 2012-2023
- Trade Balance, In Physical Terms, 2012-2023
- Trade Balance, In Value Terms, 2012-2023
- Per Capita Consumption, 2012-2023
- Market Volume Forecast to 2030
- Market Value Forecast to 2030
- Products: Market Size And Growth, By Type
- Products: Average Per Capita Consumption, By Type
- Products: Exports And Growth, By Type
- Products: Export Prices And Growth, By Type
- Production Volume And Growth
- Exports And Growth
- Export Prices And Growth
- Market Size And Growth
- Per Capita Consumption
- Imports And Growth
- Import Prices
- Production, In Physical Terms, 2012–2023
- Production, In Value Terms, 2012–2023
- Imports, In Physical Terms, 2012–2023
- Imports, In Value Terms, 2012–2023
- Imports, In Physical Terms, By Country, 2023
- Imports, In Physical Terms, By Country, 2012–2023
- Imports, In Value Terms, By Country, 2012–2023
- Import Prices, By Country Of Origin, 2012–2023
- Exports, In Physical Terms, 2012–2023
- Exports, In Value Terms, 2012–2023
- Exports, In Physical Terms, By Country, 2023
- Exports, In Physical Terms, By Country, 2012–2023
- Exports, In Value Terms, By Country, 2012–2023
- Export Prices, By Country Of Destination, 2012–2023


