South Africa - Bacon, Ham and Other Dried, Salted or Smoked Pig Meat - Market Analysis, Forecast, Size, Trends And Insights
Get instant access to more than 2 million reports, dashboards, and datasets on the IndexBox Platform.
View PricingExport of Bacon and Ham in South Africa Surges to $265K in December 2023
South Africa Bacon And Ham Exports
Bacon and ham exports from South Africa stood at 55 tons in December 2023, growing by 12% compared with the previous month. Over the period under review, exports posted a prominent expansion. The most prominent rate of growth was recorded in September 2023 with an increase of 245% m-o-m.
In value terms, bacon and ham exports skyrocketed to $265K (IndexBox estimates) in December 2023. In general, exports recorded a strong increase. The pace of growth appeared the most rapid in September 2023 when exports increased by 156% m-o-m.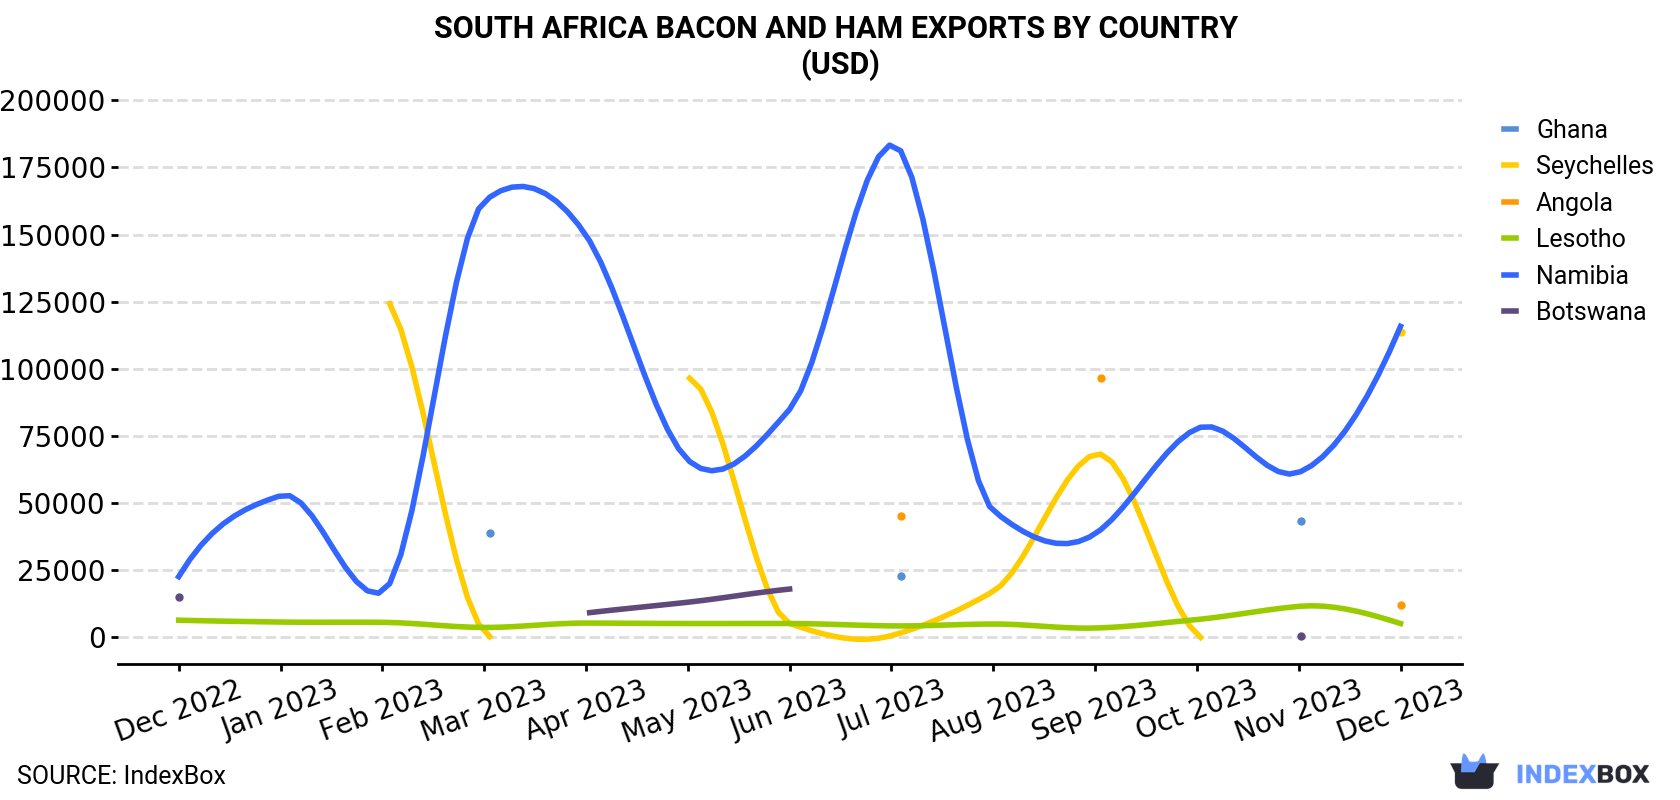
| COUNTRY | Export Value of Bacon And Ham in South Africa (USD) | ||||||||||||
|---|---|---|---|---|---|---|---|---|---|---|---|---|---|
| Dec 2022 | Jan 2023 | Feb 2023 | Mar 2023 | Apr 2023 | May 2023 | Jun 2023 | Jul 2023 | Aug 2023 | Sep 2023 | Oct 2023 | Nov 2023 | Dec 2023 | |
| Namibia | 22,428 | 52,610 | 16,691 | 162,318 | 149,754 | 65,964 | 84,810 | 183,544 | 47,027 | 38,384 | 77,654 | 61,273 | 115,725 |
| Seychelles | 54,143 | N/A | 127,375 | 1,986 | N/A | 96,574 | 4,962 | 433 | 16,919 | 68,086 | 966 | N/A | 113,565 |
| Angola | 532 | N/A | N/A | N/A | N/A | N/A | N/A | 44,971 | N/A | 96,573 | N/A | N/A | 11,931 |
| Lesotho | 6,185 | 5,495 | 5,386 | 3,480 | 5,110 | 4,938 | 4,938 | 4,057 | 4,753 | 3,261 | 6,424 | 11,335 | 4,944 |
| Ghana | N/A | N/A | N/A | 38,729 | N/A | N/A | N/A | 22,766 | N/A | N/A | N/A | 43,301 | N/A |
| Botswana | 14,787 | N/A | N/A | N/A | 8,836 | 12,879 | 17,793 | N/A | N/A | N/A | N/A | 139 | N/A |
| Others | 38,105 | 37,416 | 23,553 | 84,836 | 32,130 | 37,492 | 37,748 | 27,983 | 25,772 | 35,521 | 46,415 | 58,478 | 19,219 |
| Total | 136,180 | 95,521 | 173,005 | 291,349 | 195,830 | 217,847 | 150,251 | 283,754 | 94,471 | 241,825 | 131,459 | 174,526 | 265,384 |
Exports by Country
Namibia (24 tons), Seychelles (21 tons) and Angola (3.8 tons) were the main destinations of bacon and ham exports from South Africa, together comprising 90% of total exports.
From December 2022 to December 2023, the biggest increases were in Angola (with a CAGR of +27.6%), while shipments for the other leaders experienced more modest paces of growth.
In value terms, the largest markets for bacon and ham exported from South Africa were Namibia ($116K), Seychelles ($114K) and Angola ($12K), with a combined 91% share of total exports.
In terms of the main countries of destination, Angola, with a CAGR of +29.6%, recorded the highest rates of growth with regard to the value of exports, over the period under review, while shipments for the other leaders experienced more modest paces of growth.
Exports by Type
Pig meat other than hams or bellies (salted, in brine, dried or smoked) (48 tons) was the largest type of bacon and ham exported from South Africa, with a 88% share of total exports. Moreover, pig meat other than hams or bellies (salted, in brine, dried or smoked) exceeded the volume of the second product type, swine bellies (salted, in brine, dried or smoked) (6.4 tons), eightfold.
From December 2022 to December 2023, the average monthly growth rate of the volume of export of pig meat other than hams or bellies (salted, in brine, dried or smoked) totaled +9.6%.
In value terms, pig meat other than hams or bellies (salted, in brine, dried or smoked) ($224K) remains the largest type of bacon and ham exported from South Africa, comprising 84% of total exports. The second position in the ranking was held by swine bellies (salted, in brine, dried or smoked) ($42K), with a 16% share of total exports.
From December 2022 to December 2023, the average monthly rate of growth in terms of the export volume of pig meat other than hams or bellies (salted, in brine, dried or smoked) totaled +5.6%.
Export Prices by Country
In December 2023, the bacon and ham price amounted to $4,853 per ton (FOB, South Africa), rising by 36% against the previous month. Overall, the export price, however, saw a noticeable setback. The pace of growth appeared the most rapid in May 2023 an increase of 69% against the previous month. The export price peaked at $6,790 per ton in December 2022; however, from January 2023 to December 2023, the export prices stood at a somewhat lower figure.
Prices varied noticeably by the country of destination: the country with the highest price was Seychelles ($5,377 per ton), while the average price for exports to Lesotho ($2,975 per ton) was amongst the lowest.
From December 2022 to December 2023, the most notable rate of growth in terms of prices was recorded for supplies to Angola (+1.6%), while the prices for the other major destinations experienced a decline.
This report provides an in-depth analysis of the bacon and ham market in South Africa. Within it, you will discover the latest data on market trends and opportunities by country, consumption, production and price developments, as well as the global trade (imports and exports). The forecast exhibits the market prospects through 2030.
Product coverage:
- Prodcom 10131120 - Hams, shoulders and cuts thereof with bone in, of swine, s alted, in brine, dried or smoked
- Prodcom 10131150 - Bellies and cuts thereof of swine, salted, in brine, dried or smoked
- Prodcom 10131180 - Pig meat salted, in brine, dried or smoked (including bacon, 3/4 sides/middles, fore-ends, loins and cuts thereof, excluding hams, shoulders and cuts thereof with bone in, bellies and cuts thereof)
Country coverage:
- South Africa
Data coverage:
- Market volume and value
- Per Capita consumption
- Forecast of the market dynamics in the medium term
- Trade (exports and imports) in South Africa
- Export and import prices
- Market trends, drivers and restraints
- Key market players and their profiles
Reasons to buy this report:
- Take advantage of the latest data
- Find deeper insights into current market developments
- Discover vital success factors affecting the market
This report is designed for manufacturers, distributors, importers, and wholesalers, as well as for investors, consultants and advisors.
In this report, you can find information that helps you to make informed decisions on the following issues:
- How to diversify your business and benefit from new market opportunities
- How to load your idle production capacity
- How to boost your sales on overseas markets
- How to increase your profit margins
- How to make your supply chain more sustainable
- How to reduce your production and supply chain costs
- How to outsource production to other countries
- How to prepare your business for global expansion
While doing this research, we combine the accumulated expertise of our analysts and the capabilities of artificial intelligence. The AI-based platform, developed by our data scientists, constitutes the key working tool for business analysts, empowering them to discover deep insights and ideas from the marketing data.
-
1. INTRODUCTION
Making Data-Driven Decisions to Grow Your Business
- REPORT DESCRIPTION
- RESEARCH METHODOLOGY AND AI PLATFORM
- DATA-DRIVEN DECISIONS FOR YOUR BUSINESS
- GLOSSARY AND SPECIFIC TERMS
-
2. EXECUTIVE SUMMARY
A Quick Overview of Market Performance
- KEY FINDINGS
- MARKET TRENDS This Chapter is Available Only for the Professional Edition PRO
-
3. MARKET OVERVIEW
Understanding the Current State of The Market and Its Prospects
- MARKET SIZE
- MARKET STRUCTURE
- TRADE BALANCE
- PER CAPITA CONSUMPTION
- MARKET FORECAST TO 2030
-
4. MOST PROMISING PRODUCT
Finding New Products to Diversify Your Business
This Chapter is Available Only for the Professional Edition PRO- TOP PRODUCTS TO DIVERSIFY YOUR BUSINESS
- BEST-SELLING PRODUCTS
- MOST CONSUMED PRODUCT
- MOST TRADED PRODUCT
- MOST PROFITABLE PRODUCT FOR EXPORT
-
5. MOST PROMISING SUPPLYING COUNTRIES
Choosing the Best Countries to Establish Your Sustainable Supply Chain
This Chapter is Available Only for the Professional Edition PRO- TOP COUNTRIES TO SOURCE YOUR PRODUCT
- TOP PRODUCING COUNTRIES
- TOP EXPORTING COUNTRIES
- LOW-COST EXPORTING COUNTRIES
-
6. MOST PROMISING OVERSEAS MARKETS
Choosing the Best Countries to Boost Your Exports
This Chapter is Available Only for the Professional Edition PRO- TOP OVERSEAS MARKETS FOR EXPORTING YOUR PRODUCT
- TOP CONSUMING MARKETS
- UNSATURATED MARKETS
- TOP IMPORTING MARKETS
- MOST PROFITABLE MARKETS
7. PRODUCTION
The Latest Trends and Insights into The Industry
- PRODUCTION VOLUME AND VALUE
8. IMPORTS
The Largest Import Supplying Countries
- IMPORTS FROM 2012–2023
- IMPORTS BY COUNTRY
- IMPORT PRICES BY COUNTRY
9. EXPORTS
The Largest Destinations for Exports
- EXPORTS FROM 2012–2023
- EXPORTS BY COUNTRY
- EXPORT PRICES BY COUNTRY
-
10. PROFILES OF MAJOR PRODUCERS
The Largest Producers on The Market and Their Profiles
This Chapter is Available Only for the Professional Edition PRO -
LIST OF TABLES
- Key Findings In 2023
- Market Volume, In Physical Terms, 2012–2023
- Market Value, 2012–2023
- Per Capita Consumption In 2012-2023
- Imports, In Physical Terms, By Country, 2012–2023
- Imports, In Value Terms, By Country, 2012–2023
- Import Prices, By Country Of Origin, 2012–2023
- Exports, In Physical Terms, By Country, 2012–2023
- Exports, In Value Terms, By Country, 2012–2023
- Export Prices, By Country Of Destination, 2012–2023
-
LIST OF FIGURES
- Market Volume, In Physical Terms, 2012–2023
- Market Value, 2012–2023
- Market Structure – Domestic Supply vs. Imports, In Physical Terms, 2012-2023
- Market Structure – Domestic Supply vs. Imports, In Value Terms, 2012-2023
- Trade Balance, In Physical Terms, 2012-2023
- Trade Balance, In Value Terms, 2012-2023
- Per Capita Consumption, 2012-2023
- Market Volume Forecast to 2030
- Market Value Forecast to 2030
- Products: Market Size And Growth, By Type
- Products: Average Per Capita Consumption, By Type
- Products: Exports And Growth, By Type
- Products: Export Prices And Growth, By Type
- Production Volume And Growth
- Exports And Growth
- Export Prices And Growth
- Market Size And Growth
- Per Capita Consumption
- Imports And Growth
- Import Prices
- Production, In Physical Terms, 2012–2023
- Production, In Value Terms, 2012–2023
- Imports, In Physical Terms, 2012–2023
- Imports, In Value Terms, 2012–2023
- Imports, In Physical Terms, By Country, 2023
- Imports, In Physical Terms, By Country, 2012–2023
- Imports, In Value Terms, By Country, 2012–2023
- Import Prices, By Country Of Origin, 2012–2023
- Exports, In Physical Terms, 2012–2023
- Exports, In Value Terms, 2012–2023
- Exports, In Physical Terms, By Country, 2023
- Exports, In Physical Terms, By Country, 2012–2023
- Exports, In Value Terms, By Country, 2012–2023
- Export Prices, By Country Of Destination, 2012–2023


