
Poland - Unvulcanized Rubber - Market Analysis, Forecast, Size, Trends And Insights
Get instant access to more than 2 million reports, dashboards, and datasets on the IndexBox Platform.
View PricingSlight Increase in Poland's Unvulcanized Rubber Price at $4,201 per Ton
Poland Unvulcanized Rubber Import Price in July 2023
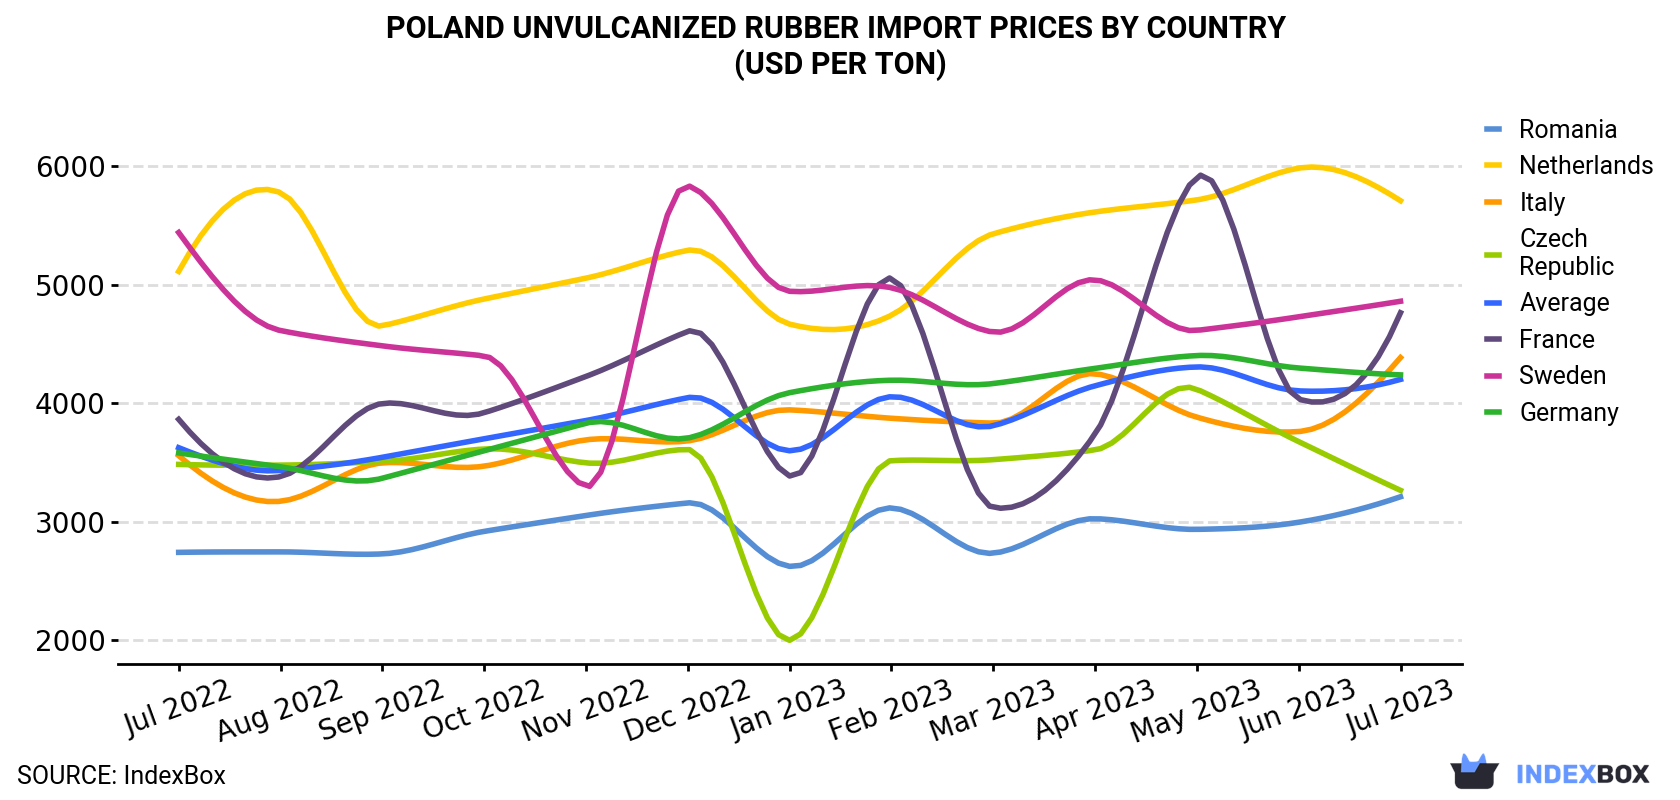
In July 2023, the unvulcanized rubber price amounted to $4,201 per ton (CIF, Poland), with an increase of 2.4% against the previous month. Over the period from July 2022 to July 2023, it increased at an average monthly rate of +1.2%. The most prominent rate of growth was recorded in February 2023 when the average import price increased by 13% against the previous month. The import price peaked at $4,306 per ton in May 2023; however, from June 2023 to July 2023, import prices failed to regain momentum.
There were significant differences in the average prices amongst the major supplying countries. In July 2023, the country with the highest price was the Netherlands ($5,708 per ton), while the price for Romania ($3,211 per ton) was amongst the lowest.
From July 2022 to July 2023, the most notable rate of growth in terms of prices was attained by France (+1.8%), while the prices for the other major suppliers experienced more modest paces of growth.
| COUNTRY | Import Price of Unvulcanized Rubber in Poland (USD per ton) | ||||||||||||
|---|---|---|---|---|---|---|---|---|---|---|---|---|---|
| Jul 2022 | Aug 2022 | Sep 2022 | Oct 2022 | Nov 2022 | Dec 2022 | Jan 2023 | Feb 2023 | Mar 2023 | Apr 2023 | May 2023 | Jun 2023 | Jul 2023 | |
| Netherlands | 5,112 | 5,776 | 4,653 | 4,879 | 5,055 | 5,290 | 4,667 | 4,742 | 5,429 | 5,613 | 5,715 | 5,983 | 5,708 |
| Sweden | 5,440 | 4,613 | 4,484 | 4,399 | 3,298 | 5,835 | 4,944 | 4,974 | 4,600 | 5,041 | 4,614 | 4,729 | 4,860 |
| France | 3,864 | 3,381 | 3,998 | 3,920 | 4,226 | 4,606 | 3,386 | 5,054 | 3,120 | 3,740 | 5,908 | 4,035 | 4,763 |
| Italy | 3,558 | 3,173 | 3,497 | 3,469 | 3,691 | 3,682 | 3,944 | 3,873 | 3,832 | 4,249 | 3,882 | 3,761 | 4,385 |
| Germany | 3,581 | 3,464 | 3,367 | 3,599 | 3,831 | 3,706 | 4,089 | 4,194 | 4,166 | 4,294 | 4,402 | 4,297 | 4,239 |
| Czech Republic | 3,484 | 3,478 | 3,509 | 3,614 | 3,497 | 3,610 | 2,000 | 3,516 | 3,524 | 3,606 | 4,118 | 3,676 | 3,265 |
| Romania | 2,742 | 2,746 | 2,729 | 2,919 | 3,053 | 3,159 | 2,624 | 3,117 | 2,735 | 3,026 | 2,936 | 2,996 | 3,211 |
| Average | 3,625 | 3,433 | 3,544 | 3,700 | 3,854 | 4,047 | 3,599 | 4,055 | 3,810 | 4,147 | 4,306 | 4,104 | 4,201 |
Poland Unvulcanized Rubber Import Prices by Type
There were significant differences in the average prices amongst the major supplied products. In July 2023, the product with the highest price was plates, sheets, strip, rods and profile shapes, of vulcanised rubber other than hard rubber ($7,482 per ton), while the price for compounded rubber, unvulcanised, in primary forms or in plates, sheets or strip ($3,631 per ton) was amongst the lowest.
From July 2022 to July 2023, the most notable rate of growth in terms of prices was attained by plates, sheets, strip, rods and profile shapes, of vulcanised rubber other than hard rubber (+1.4%), while the prices for the other products experienced mixed trend patterns.
Poland Unvulcanized Rubber Imports
In July 2023, supplies from abroad of unvulcanized rubber and articles thereof decreased by -21.4% to 12K tons for the first time since April 2023, thus ending a two-month rising trend. Over the period under review, imports showed a relatively flat trend pattern. The growth pace was the most rapid in January 2023 with an increase of 55% against the previous month.
In value terms, unvulcanized rubber imports dropped notably to $52M (IndexBox estimates) in July 2023. Overall, imports, however, recorded a relatively flat trend pattern. The pace of growth was the most pronounced in January 2023 when imports increased by 38% m-o-m.
Poland Unvulcanized Rubber Imports by Type
In July 2023, compounded rubber, unvulcanised, in primary forms or in plates, sheets or strip (10K tons) constituted the largest type of unvulcanized rubber supplied to Poland, accounting for a 84% share of total imports. Moreover, compounded rubber, unvulcanised, in primary forms or in plates, sheets or strip exceeded the figures recorded for the second-largest type, plates, sheets, strip, rods and profile shapes, of vulcanised rubber other than hard rubber (1.6K tons), sevenfold. Rubber (391 tons) ranked third in terms of total imports with a 3.2% share.
From July 2022 to July 2023, the average monthly growth rate of the volume of import of compounded rubber, unvulcanised, in primary forms or in plates, sheets or strip totaled -1.2%. With regard to the other supplied products, the following average monthly rates of growth were recorded: plates, sheets, strip, rods and profile shapes, of vulcanised rubber other than hard rubber (+0.8% per month) and rubber (+5.5% per month).
In value terms, compounded rubber, unvulcanised, in primary forms or in plates, sheets or strip ($37M) constituted the largest type of unvulcanized rubber supplied to Poland, comprising 72% of total imports. The second position in the ranking was held by plates, sheets, strip, rods and profile shapes, of vulcanised rubber other than hard rubber ($12M), with a 23% share of total imports. It was followed by rubber, with a 4.5% share.
Poland Unvulcanized Rubber Imports by Country
In July 2023, Germany (3.9K tons) constituted the largest unvulcanized rubber supplier to Poland, accounting for a 32% share of total imports. Moreover, unvulcanized rubber imports from Germany exceeded the figures recorded by the second-largest supplier, France (1.9K tons), twofold. The third position in this ranking was held by Italy (1.8K tons), with a 15% share.
From July 2022 to July 2023, the average monthly growth rate of volume from Germany was relatively modest. The remaining supplying countries recorded the following average monthly rates of imports growth: France (+2.0% per month) and Italy (-1.0% per month).
In value terms, the largest unvulcanized rubber suppliers to Poland were Germany ($17M), France ($9M) and Italy ($7.9M), with a combined 65% share of total imports. Romania, the Czech Republic, Spain, the Netherlands, Belgium, the UK, Slovakia, Hungary and Sweden lagged somewhat behind, together comprising a further 26%.
Hungary, with a CAGR of +5.0%, saw the highest growth rate of the value of imports, in terms of the main suppliers over the period under review, while purchases for the other leaders experienced more modest paces of growth.
This report provides an in-depth analysis of the unvulcanized rubber market in Poland. Within it, you will discover the latest data on market trends and opportunities by country, consumption, production and price developments, as well as the global trade (imports and exports). The forecast exhibits the market prospects through 2030.
Product coverage:
- Prodcom 22192013 - Rubber compounded with carbon black or silica, unvulcanised
- Prodcom 22192019 - Other compounded rubber, unvulcanised, in primary forms or in plates, sheets or strip
- Prodcom 22192030 - Forms and articles of unvulcanised rubber (including rods, t ubes, profile shapes, discs and rings) (excluding camel-back, s trips for retreading tyres)
- Prodcom 22192050 - Vulcanised rubber thread and cord
- Prodcom 22192070 - Plates, sheets and strip of vulcanised rubber
- Prodcom 22192083 - Extruded rods and profile shapes of cellular vulcanised rubber
- Prodcom 22192085 - Plates, sheets, strips for floor covering of solid vulcanised rubber
- Prodcom 22192087 - Extruded solid rubber rods and profiles
Country coverage:
- Poland
Data coverage:
- Market volume and value
- Per Capita consumption
- Forecast of the market dynamics in the medium term
- Trade (exports and imports) in Poland
- Export and import prices
- Market trends, drivers and restraints
- Key market players and their profiles
Reasons to buy this report:
- Take advantage of the latest data
- Find deeper insights into current market developments
- Discover vital success factors affecting the market
This report is designed for manufacturers, distributors, importers, and wholesalers, as well as for investors, consultants and advisors.
In this report, you can find information that helps you to make informed decisions on the following issues:
- How to diversify your business and benefit from new market opportunities
- How to load your idle production capacity
- How to boost your sales on overseas markets
- How to increase your profit margins
- How to make your supply chain more sustainable
- How to reduce your production and supply chain costs
- How to outsource production to other countries
- How to prepare your business for global expansion
While doing this research, we combine the accumulated expertise of our analysts and the capabilities of artificial intelligence. The AI-based platform, developed by our data scientists, constitutes the key working tool for business analysts, empowering them to discover deep insights and ideas from the marketing data.
-
1. INTRODUCTION
Making Data-Driven Decisions to Grow Your Business
- REPORT DESCRIPTION
- RESEARCH METHODOLOGY AND AI PLATFORM
- DATA-DRIVEN DECISIONS FOR YOUR BUSINESS
- GLOSSARY AND SPECIFIC TERMS
-
2. EXECUTIVE SUMMARY
A Quick Overview of Market Performance
- KEY FINDINGS
- MARKET TRENDS This Chapter is Available Only for the Professional Edition PRO
-
3. MARKET OVERVIEW
Understanding the Current State of The Market and Its Prospects
- MARKET SIZE
- MARKET STRUCTURE
- TRADE BALANCE
- PER CAPITA CONSUMPTION
- MARKET FORECAST TO 2030
-
4. MOST PROMISING PRODUCT
Finding New Products to Diversify Your Business
This Chapter is Available Only for the Professional Edition PRO- TOP PRODUCTS TO DIVERSIFY YOUR BUSINESS
- BEST-SELLING PRODUCTS
- MOST CONSUMED PRODUCT
- MOST TRADED PRODUCT
- MOST PROFITABLE PRODUCT FOR EXPORT
-
5. MOST PROMISING SUPPLYING COUNTRIES
Choosing the Best Countries to Establish Your Sustainable Supply Chain
This Chapter is Available Only for the Professional Edition PRO- TOP COUNTRIES TO SOURCE YOUR PRODUCT
- TOP PRODUCING COUNTRIES
- TOP EXPORTING COUNTRIES
- LOW-COST EXPORTING COUNTRIES
-
6. MOST PROMISING OVERSEAS MARKETS
Choosing the Best Countries to Boost Your Exports
This Chapter is Available Only for the Professional Edition PRO- TOP OVERSEAS MARKETS FOR EXPORTING YOUR PRODUCT
- TOP CONSUMING MARKETS
- UNSATURATED MARKETS
- TOP IMPORTING MARKETS
- MOST PROFITABLE MARKETS
7. PRODUCTION
The Latest Trends and Insights into The Industry
- PRODUCTION VOLUME AND VALUE
8. IMPORTS
The Largest Import Supplying Countries
- IMPORTS FROM 2012–2023
- IMPORTS BY COUNTRY
- IMPORT PRICES BY COUNTRY
9. EXPORTS
The Largest Destinations for Exports
- EXPORTS FROM 2012–2023
- EXPORTS BY COUNTRY
- EXPORT PRICES BY COUNTRY
-
10. PROFILES OF MAJOR PRODUCERS
The Largest Producers on The Market and Their Profiles
This Chapter is Available Only for the Professional Edition PRO -
LIST OF TABLES
- Key Findings In 2023
- Market Volume, In Physical Terms, 2012–2023
- Market Value, 2012–2023
- Per Capita Consumption In 2012-2023
- Imports, In Physical Terms, By Country, 2012–2023
- Imports, In Value Terms, By Country, 2012–2023
- Import Prices, By Country Of Origin, 2012–2023
- Exports, In Physical Terms, By Country, 2012–2023
- Exports, In Value Terms, By Country, 2012–2023
- Export Prices, By Country Of Destination, 2012–2023
-
LIST OF FIGURES
- Market Volume, In Physical Terms, 2012–2023
- Market Value, 2012–2023
- Market Structure – Domestic Supply vs. Imports, In Physical Terms, 2012-2023
- Market Structure – Domestic Supply vs. Imports, In Value Terms, 2012-2023
- Trade Balance, In Physical Terms, 2012-2023
- Trade Balance, In Value Terms, 2012-2023
- Per Capita Consumption, 2012-2023
- Market Volume Forecast to 2030
- Market Value Forecast to 2030
- Products: Market Size And Growth, By Type
- Products: Average Per Capita Consumption, By Type
- Products: Exports And Growth, By Type
- Products: Export Prices And Growth, By Type
- Production Volume And Growth
- Exports And Growth
- Export Prices And Growth
- Market Size And Growth
- Per Capita Consumption
- Imports And Growth
- Import Prices
- Production, In Physical Terms, 2012–2023
- Production, In Value Terms, 2012–2023
- Imports, In Physical Terms, 2012–2023
- Imports, In Value Terms, 2012–2023
- Imports, In Physical Terms, By Country, 2023
- Imports, In Physical Terms, By Country, 2012–2023
- Imports, In Value Terms, By Country, 2012–2023
- Import Prices, By Country Of Origin, 2012–2023
- Exports, In Physical Terms, 2012–2023
- Exports, In Value Terms, 2012–2023
- Exports, In Physical Terms, By Country, 2023
- Exports, In Physical Terms, By Country, 2012–2023
- Exports, In Value Terms, By Country, 2012–2023
- Export Prices, By Country Of Destination, 2012–2023


