
Poland - Tea - Market Analysis, Forecast, Size, Trends and Insights
Get instant access to more than 2 million reports, dashboards, and datasets on the IndexBox Platform.
View PricingPoland's August 2023 Tea Export Sees $14M Decline
Poland Tea Exports
In August 2023, the amount of tea exported from Poland dropped to 1K tons, shrinking by -6.8% against the month before. Overall, exports continue to indicate a drastic downturn. The pace of growth appeared the most rapid in September 2022 when exports increased by 10% against the previous month. As a result, the exports reached the peak of 2.1K tons. From October 2022 to August 2023, the growth of the exports remained at a somewhat lower figure.
In value terms, tea exports shrank to $14M (IndexBox estimates) in August 2023. In general, exports saw a pronounced setback. The pace of growth appeared the most rapid in January 2023 when exports increased by 13% m-o-m. As a result, the exports reached the peak of $24M. From February 2023 to August 2023, the growth of the exports failed to regain momentum.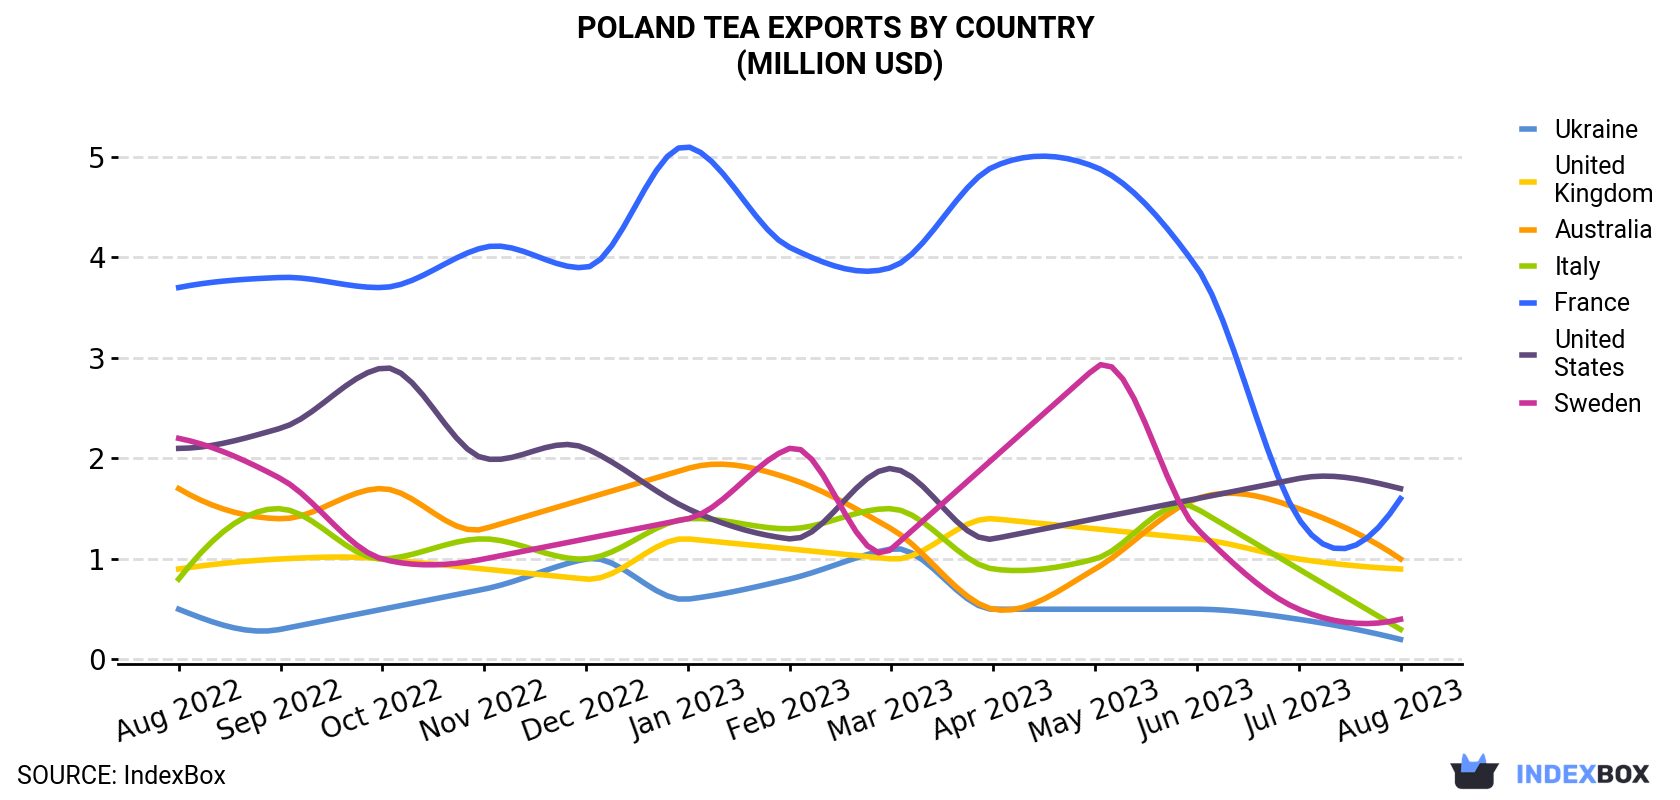
| COUNTRY | Export Value of Tea in Poland (million USD) | ||||||||||||
|---|---|---|---|---|---|---|---|---|---|---|---|---|---|
| Aug 2022 | Sep 2022 | Oct 2022 | Nov 2022 | Dec 2022 | Jan 2023 | Feb 2023 | Mar 2023 | Apr 2023 | May 2023 | Jun 2023 | Jul 2023 | Aug 2023 | |
| United States | 2.1 | 2.3 | 2.9 | 2.0 | 2.1 | 1.5 | 1.2 | 1.9 | 1.2 | 1.4 | 1.6 | 1.8 | 1.7 |
| France | 3.7 | 3.8 | 3.7 | 4.1 | 3.9 | 5.1 | 4.1 | 3.9 | 4.9 | 4.9 | 3.9 | 1.4 | 1.6 |
| Australia | 1.7 | 1.4 | 1.7 | 1.3 | 1.6 | 1.9 | 1.8 | 1.3 | 0.5 | 0.9 | 1.6 | 1.5 | 1.0 |
| United Kingdom | 0.9 | 1.0 | 1.0 | 0.9 | 0.8 | 1.2 | 1.1 | 1.0 | 1.4 | 1.3 | 1.2 | 1.0 | 0.9 |
| Sweden | 2.2 | 1.8 | 1.0 | 1.0 | 1.2 | 1.4 | 2.1 | 1.1 | 2.0 | 2.9 | 1.3 | 0.5 | 0.4 |
| Italy | 0.8 | 1.5 | 1.0 | 1.2 | 1.0 | 1.4 | 1.3 | 1.5 | 0.9 | 1.0 | 1.5 | 0.9 | 0.3 |
| Ukraine | 0.5 | 0.3 | 0.5 | 0.7 | 1.0 | 0.6 | 0.8 | 1.1 | 0.5 | 0.5 | 0.5 | 0.4 | 0.2 |
| Others | 8.5 | 10.3 | 10.5 | 10.5 | 9.6 | 11.0 | 10.8 | 11.3 | 10.2 | 9.6 | 10.2 | 7.0 | 8.0 |
| Total | 20.4 | 22.4 | 22.2 | 21.6 | 21.3 | 24.1 | 23.1 | 23.1 | 21.6 | 22.5 | 21.8 | 14.6 | 14.0 |
Exports by Country
The United States (122 tons), France (116 tons) and Australia (103 tons) were the main destinations of tea exports from Poland, together comprising 33% of total exports. These countries were followed by the UK, Italy, Ukraine and Sweden, which together accounted for a further 16%.
From August 2022 to August 2023, the most notable rate of growth in terms of shipments, amongst the main countries of destination, was attained by the UK (with a CAGR of +2.4%), while the other leaders experienced a decline.
In value terms, the United States ($1.7M), France ($1.6M) and Australia ($1M) constituted the largest markets for tea exported from Poland worldwide, with a combined 31% share of total exports. These countries were followed by the UK, Sweden, Italy and Ukraine, which together accounted for a further 12%.
the UK, with a CAGR of +0.0%, recorded the highest rates of growth with regard to the value of exports, in terms of the main countries of destination over the period under review, while shipments for the other leaders experienced a decline.
Exports by Type
Tea, black; (fermented) and partly fermented tea, in immediate packings of a content not exceeding 3kg (720 tons) was the largest type of tea exported from Poland, with a 70% share of total exports. Moreover, tea, black; (fermented) and partly fermented tea, in immediate packings of a content not exceeding 3kg exceeded the volume of the second product type, tea, green; (not fermented), in immediate packings of a content not exceeding 3kg (176 tons), fourfold. Tea, black; (fermented) and partly fermented tea, in immediate packings of a content exceeding 3kg (116 tons) ranked third in terms of total exports with an 11% share.
From August 2022 to August 2023, the average monthly growth rate of the volume of export of tea, black; (fermented) and partly fermented tea, in immediate packings of a content not exceeding 3kg stood at -5.7%. With regard to the other exported products, the following average monthly rates of growth were recorded: tea, green; (not fermented), in immediate packings of a content not exceeding 3kg (-4.6% per month) and tea, black; (fermented) and partly fermented tea, in immediate packings of a content exceeding 3kg (-0.6% per month).
In value terms, tea, black; (fermented) and partly fermented tea, in immediate packings of a content not exceeding 3kg ($10M) remains the largest type of tea exported from Poland, comprising 71% of total exports. The second position in the ranking was taken by tea, green; (not fermented), in immediate packings of a content not exceeding 3kg ($3.3M), with a 24% share of total exports. It was followed by tea, black; (fermented) and partly fermented tea, in immediate packings of a content exceeding 3kg, with a 4.3% share.
From August 2022 to August 2023, the average monthly growth rate of the export volume of tea, black; (fermented) and partly fermented tea, in immediate packings of a content not exceeding 3kg stood at -3.3%. With regard to the other exported products, the following average monthly rates of growth were recorded: tea, green; (not fermented), in immediate packings of a content not exceeding 3kg (-2.5% per month) and tea, black; (fermented) and partly fermented tea, in immediate packings of a content exceeding 3kg (-1.5% per month).
Export Prices by Country
In August 2023, the tea price amounted to $13,647 per ton (FOB, Poland), growing by 3.3% against the previous month. Over the period from August 2022 to August 2023, it increased at an average monthly rate of +2.1%. The most prominent rate of growth was recorded in October 2022 when the average export price increased by 10% m-o-m. Over the period under review, the average export prices reached the peak figure at $13,826 per ton in June 2023; however, from July 2023 to August 2023, the export prices stood at a somewhat lower figure.
Prices varied noticeably by the country of destination: the country with the highest price was Chile ($17,310 per ton), while the average price for exports to India ($1,310 per ton) was amongst the lowest.
From August 2022 to August 2023, the most notable rate of growth in terms of prices was recorded for supplies to Chile (+14.9%), while the prices for the other major destinations experienced more modest paces of growth.
This report provides an in-depth analysis of the tea market in Poland. Within it, you will discover the latest data on market trends and opportunities by country, consumption, production and price developments, as well as the global trade (imports and exports). The forecast exhibits the market prospects through 2030.
Product coverage:
- FCL 667 - Tea
Country coverage:
- Poland
Data coverage:
- Market volume and value
- Per Capita consumption
- Forecast of the market dynamics in the medium term
- Trade (exports and imports) in Poland
- Export and import prices
- Market trends, drivers and restraints
- Key market players and their profiles
Reasons to buy this report:
- Take advantage of the latest data
- Find deeper insights into current market developments
- Discover vital success factors affecting the market
This report is designed for manufacturers, distributors, importers, and wholesalers, as well as for investors, consultants and advisors.
In this report, you can find information that helps you to make informed decisions on the following issues:
- How to diversify your business and benefit from new market opportunities
- How to load your idle production capacity
- How to boost your sales on overseas markets
- How to increase your profit margins
- How to make your supply chain more sustainable
- How to reduce your production and supply chain costs
- How to outsource production to other countries
- How to prepare your business for global expansion
While doing this research, we combine the accumulated expertise of our analysts and the capabilities of artificial intelligence. The AI-based platform, developed by our data scientists, constitutes the key working tool for business analysts, empowering them to discover deep insights and ideas from the marketing data.
-
1. INTRODUCTION
Making Data-Driven Decisions to Grow Your Business
- REPORT DESCRIPTION
- RESEARCH METHODOLOGY AND AI PLATFORM
- DATA-DRIVEN DECISIONS FOR YOUR BUSINESS
- GLOSSARY AND SPECIFIC TERMS
-
2. EXECUTIVE SUMMARY
A Quick Overview of Market Performance
- KEY FINDINGS
- MARKET TRENDS This Chapter is Available Only for the Professional Edition PRO
-
3. MARKET OVERVIEW
Understanding the Current State of The Market and Its Prospects
- MARKET SIZE
- MARKET STRUCTURE
- TRADE BALANCE
- PER CAPITA CONSUMPTION
- MARKET FORECAST TO 2030
-
4. MOST PROMISING PRODUCT
Finding New Products to Diversify Your Business
This Chapter is Available Only for the Professional Edition PRO- TOP PRODUCTS TO DIVERSIFY YOUR BUSINESS
- BEST-SELLING PRODUCTS
- MOST CONSUMED PRODUCT
- MOST TRADED PRODUCT
- MOST PROFITABLE PRODUCT FOR EXPORT
-
5. MOST PROMISING SUPPLYING COUNTRIES
Choosing the Best Countries to Establish Your Sustainable Supply Chain
This Chapter is Available Only for the Professional Edition PRO- TOP COUNTRIES TO SOURCE YOUR PRODUCT
- TOP PRODUCING COUNTRIES
- COUNTRIES WITH TOP YIELDS
- TOP EXPORTING COUNTRIES
- LOW-COST EXPORTING COUNTRIES
-
6. MOST PROMISING OVERSEAS MARKETS
Choosing the Best Countries to Boost Your Exports
This Chapter is Available Only for the Professional Edition PRO- TOP OVERSEAS MARKETS FOR EXPORTING YOUR PRODUCT
- TOP CONSUMING MARKETS
- UNSATURATED MARKETS
- TOP IMPORTING MARKETS
- MOST PROFITABLE MARKETS
7. PRODUCTION
The Latest Trends and Insights into The Industry
- PRODUCTION, HARVESTED AREA AND YIELD
8. IMPORTS
The Largest Import Supplying Countries
- IMPORTS FROM 2012–2023
- IMPORTS BY COUNTRY
- IMPORT PRICES BY COUNTRY
9. EXPORTS
The Largest Destinations for Exports
- EXPORTS FROM 2012–2023
- EXPORTS BY COUNTRY
- EXPORT PRICES BY COUNTRY
-
10. PROFILES OF MAJOR PRODUCERS
The Largest Producers on The Market and Their Profiles
This Chapter is Available Only for the Professional Edition PRO -
LIST OF TABLES
- Key Findings In 2023
- Market Volume, In Physical Terms, 2012–2023
- Market Value, 2012–2023
- Per Capita Consumption In 2012-2023
- Imports, In Physical Terms, By Country, 2012–2023
- Imports, In Value Terms, By Country, 2012–2023
- Import Prices, By Country Of Origin, 2012–2023
- Exports, In Physical Terms, By Country, 2012–2023
- Exports, In Value Terms, By Country, 2012–2023
- Export Prices, By Country Of Destination, 2012–2023
-
LIST OF FIGURES
- Market Volume, In Physical Terms, 2012–2023
- Market Value, 2012–2023
- Market Structure – Domestic Supply vs. Imports, In Physical Terms, 2012-2023
- Market Structure – Domestic Supply vs. Imports, In Value Terms, 2012-2023
- Trade Balance, In Physical Terms, 2012-2023
- Trade Balance, In Value Terms, 2012-2023
- Per Capita Consumption, 2012-2023
- Market Volume Forecast to 2030
- Market Value Forecast to 2030
- Products: Market Size And Growth, By Type
- Products: Average Per Capita Consumption, By Type
- Products: Exports And Growth, By Type
- Products: Export Prices And Growth, By Type
- Production Volume And Growth
- Yield And Growth
- Exports And Growth
- Export Prices And Growth
- Market Size And Growth
- Per Capita Consumption
- Imports And Growth
- Import Prices
- Production, In Physical Terms, 2012–2023
- Production, In Value Terms, 2012–2023
- Area Harvested, 2012–2023
- Yield, 2012–2023
- Imports, In Physical Terms, 2012–2023
- Imports, In Value Terms, 2012–2023
- Imports, In Physical Terms, By Country, 2023
- Imports, In Physical Terms, By Country, 2012–2023
- Imports, In Value Terms, By Country, 2012–2023
- Import Prices, By Country Of Origin, 2012–2023
- Exports, In Physical Terms, 2012–2023
- Exports, In Value Terms, 2012–2023
- Exports, In Physical Terms, By Country, 2023
- Exports, In Physical Terms, By Country, 2012–2023
- Exports, In Value Terms, By Country, 2012–2023
- Export Prices, By Country Of Destination, 2012–2023


