
Japan - Insecticides - Market Analysis, Forecast, Size, Trends and Insights
Get instant access to more than 2 million reports, dashboards, and datasets on the IndexBox Platform.
View PricingSignificant Surge in Japan's Insecticide Costs, Reaching $34.4/kg
Japan Insecticide Export Price in July 2023
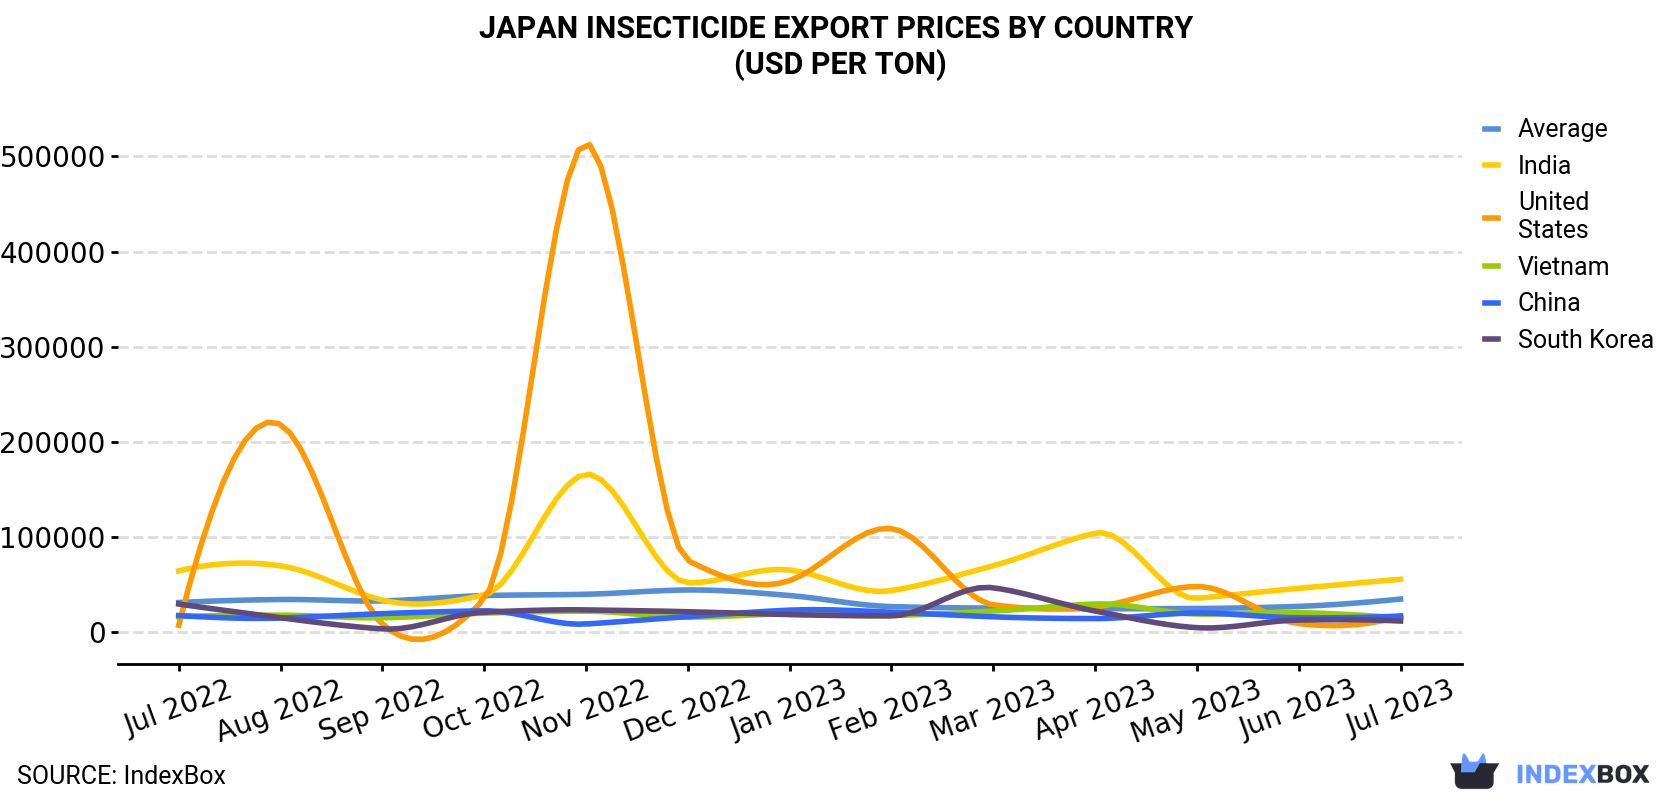
In July 2023, the insecticide price amounted to $34,378 per ton (FOB, Japan), surging by 29% against the previous month. Over the period under review, the export price showed a relatively flat trend pattern. The export price peaked at $43,968 per ton in December 2022; however, from January 2023 to July 2023, the export prices failed to regain momentum.
There were significant differences in the average prices for the major foreign markets. In July 2023, the country with the highest price was India ($55,211 per ton), while the average price for exports to South Korea ($11,254 per ton) was amongst the lowest.
From July 2022 to July 2023, the most notable rate of growth in terms of prices was recorded for supplies to the United States (+7.5%), while the prices for the other major destinations experienced a decline.
| COUNTRY | Export Price of Insecticide in Japan (USD per ton) | ||||||||||||
|---|---|---|---|---|---|---|---|---|---|---|---|---|---|
| Jul 2022 | Aug 2022 | Sep 2022 | Oct 2022 | Nov 2022 | Dec 2022 | Jan 2023 | Feb 2023 | Mar 2023 | Apr 2023 | May 2023 | Jun 2023 | Jul 2023 | |
| India | 64,068 | 69,378 | 33,281 | 38,622 | 165,695 | 51,533 | 65,005 | 43,304 | 69,450 | 103,776 | 35,169 | 45,699 | 55,211 |
| China | 17,045 | 14,444 | 19,056 | 22,063 | 8,166 | 15,892 | 22,726 | 20,592 | 15,732 | 13,896 | 19,748 | 14,690 | 16,628 |
| United States | 6,868 | 218,090 | 8,025 | 34,610 | 513,968 | 74,965 | 53,781 | 108,638 | 28,346 | 26,117 | 47,698 | 8,611 | 16,307 |
| Vietnam | 15,869 | 17,472 | 14,684 | 19,582 | 21,605 | 15,362 | 18,710 | 17,096 | 21,758 | 29,240 | 18,591 | 20,202 | 14,334 |
| South Korea | 29,188 | 14,781 | 3,014 | 20,648 | 22,995 | 21,074 | 18,078 | 16,696 | 46,267 | 21,819 | 4,287 | 12,296 | 11,254 |
| Average | 30,725 | 33,935 | 32,469 | 38,062 | 39,447 | 43,968 | 38,126 | 26,477 | 24,893 | 24,244 | 24,499 | 26,712 | 34,378 |
Japan Insecticide Exports
In July 2023, the amount of insecticides exported from Japan fell dramatically to 908 tons, which is down by -20.5% compared with June 2023. Overall, exports showed a mild descent. The pace of growth appeared the most rapid in December 2022 with an increase of 127% month-to-month.
In value terms, insecticide exports reached $31M (IndexBox estimates) in July 2023. In general, exports saw a relatively flat trend pattern. The most prominent rate of growth was recorded in December 2022 with an increase of 153% against the previous month. As a result, the exports reached the peak of $50M. From January 2023 to July 2023, the growth of the exports remained at a lower figure.
Japan Insecticide Exports by Country
Vietnam (197 tons) was the main destination for insecticide exports from Japan, accounting for a 22% share of total exports. Moreover, insecticide exports to Vietnam exceeded the volume sent to the second major destination, Indonesia (73 tons), threefold. The third position in this ranking was held by India (71 tons), with a 7.8% share.
From July 2022 to July 2023, the average monthly growth rate of volume to Vietnam totaled +7.1%. Exports to the other major destinations recorded the following average monthly rates of exports growth: Indonesia (+15.2% per month) and India (-3.7% per month).
In value terms, the largest markets for insecticide exported from Japan were India ($3.9M), Indonesia ($3M) and Vietnam ($2.8M), together comprising 31% of total exports. Argentina, Chile, Mexico, China, Peru, the Philippines, Hong Kong, Thailand, Ecuador and Taiwan (Chinese) lagged somewhat behind, together accounting for a further 33%.
In terms of the main countries of destination, Argentina, with a CAGR of +22.0%, recorded the highest rates of growth with regard to the value of exports, over the period under review, while shipments for the other leaders experienced more modest paces of growth.
This report provides an in-depth analysis of the insecticide market in Japan. Within it, you will discover the latest data on market trends and opportunities by country, consumption, production and price developments, as well as the global trade (imports and exports). The forecast exhibits the market prospects through 2030.
Product coverage:
- Prodcom 20201130 - Insecticides based on chlorinated hydrocarbons, put up in forms or packings for retail sale or as preparations or articles
- Prodcom 20201140 - Insecticides based on carbamates, put up in forms or packings for retail sale or as preparations or articles
- Prodcom 20201150 - Insecticides based on organophosphorus products, put up in forms or packings for retail sale or as preparations or articles
- Prodcom 20201160 - Insecticides based on pyrethroids, put up in forms or packings for retail sale or as preparations or articles
- Prodcom 20201190 - Other insecticides
- Prodcom 20201100 -
Country coverage:
- Japan
Data coverage:
- Market volume and value
- Per Capita consumption
- Forecast of the market dynamics in the medium term
- Trade (exports and imports) in Japan
- Export and import prices
- Market trends, drivers and restraints
- Key market players and their profiles
Reasons to buy this report:
- Take advantage of the latest data
- Find deeper insights into current market developments
- Discover vital success factors affecting the market
This report is designed for manufacturers, distributors, importers, and wholesalers, as well as for investors, consultants and advisors.
In this report, you can find information that helps you to make informed decisions on the following issues:
- How to diversify your business and benefit from new market opportunities
- How to load your idle production capacity
- How to boost your sales on overseas markets
- How to increase your profit margins
- How to make your supply chain more sustainable
- How to reduce your production and supply chain costs
- How to outsource production to other countries
- How to prepare your business for global expansion
While doing this research, we combine the accumulated expertise of our analysts and the capabilities of artificial intelligence. The AI-based platform, developed by our data scientists, constitutes the key working tool for business analysts, empowering them to discover deep insights and ideas from the marketing data.
-
1. INTRODUCTION
Making Data-Driven Decisions to Grow Your Business
- REPORT DESCRIPTION
- RESEARCH METHODOLOGY AND AI PLATFORM
- DATA-DRIVEN DECISIONS FOR YOUR BUSINESS
- GLOSSARY AND SPECIFIC TERMS
-
2. EXECUTIVE SUMMARY
A Quick Overview of Market Performance
- KEY FINDINGS
- MARKET TRENDS This Chapter is Available Only for the Professional Edition PRO
-
3. MARKET OVERVIEW
Understanding the Current State of The Market and Its Prospects
- MARKET SIZE
- MARKET STRUCTURE
- TRADE BALANCE
- PER CAPITA CONSUMPTION
- MARKET FORECAST TO 2030
-
4. MOST PROMISING PRODUCT
Finding New Products to Diversify Your Business
This Chapter is Available Only for the Professional Edition PRO- TOP PRODUCTS TO DIVERSIFY YOUR BUSINESS
- BEST-SELLING PRODUCTS
- MOST CONSUMED PRODUCT
- MOST TRADED PRODUCT
- MOST PROFITABLE PRODUCT FOR EXPORT
-
5. MOST PROMISING SUPPLYING COUNTRIES
Choosing the Best Countries to Establish Your Sustainable Supply Chain
This Chapter is Available Only for the Professional Edition PRO- TOP COUNTRIES TO SOURCE YOUR PRODUCT
- TOP PRODUCING COUNTRIES
- TOP EXPORTING COUNTRIES
- LOW-COST EXPORTING COUNTRIES
-
6. MOST PROMISING OVERSEAS MARKETS
Choosing the Best Countries to Boost Your Exports
This Chapter is Available Only for the Professional Edition PRO- TOP OVERSEAS MARKETS FOR EXPORTING YOUR PRODUCT
- TOP CONSUMING MARKETS
- UNSATURATED MARKETS
- TOP IMPORTING MARKETS
- MOST PROFITABLE MARKETS
7. PRODUCTION
The Latest Trends and Insights into The Industry
- PRODUCTION VOLUME AND VALUE
8. IMPORTS
The Largest Import Supplying Countries
- IMPORTS FROM 2012–2023
- IMPORTS BY COUNTRY
- IMPORT PRICES BY COUNTRY
9. EXPORTS
The Largest Destinations for Exports
- EXPORTS FROM 2012–2023
- EXPORTS BY COUNTRY
- EXPORT PRICES BY COUNTRY
-
10. PROFILES OF MAJOR PRODUCERS
The Largest Producers on The Market and Their Profiles
This Chapter is Available Only for the Professional Edition PRO -
LIST OF TABLES
- Key Findings In 2023
- Market Volume, In Physical Terms, 2012–2023
- Market Value, 2012–2023
- Per Capita Consumption In 2012-2023
- Imports, In Physical Terms, By Country, 2012–2023
- Imports, In Value Terms, By Country, 2012–2023
- Import Prices, By Country Of Origin, 2012–2023
- Exports, In Physical Terms, By Country, 2012–2023
- Exports, In Value Terms, By Country, 2012–2023
- Export Prices, By Country Of Destination, 2012–2023
-
LIST OF FIGURES
- Market Volume, In Physical Terms, 2012–2023
- Market Value, 2012–2023
- Market Structure – Domestic Supply vs. Imports, In Physical Terms, 2012-2023
- Market Structure – Domestic Supply vs. Imports, In Value Terms, 2012-2023
- Trade Balance, In Physical Terms, 2012-2023
- Trade Balance, In Value Terms, 2012-2023
- Per Capita Consumption, 2012-2023
- Market Volume Forecast to 2030
- Market Value Forecast to 2030
- Products: Market Size And Growth, By Type
- Products: Average Per Capita Consumption, By Type
- Products: Exports And Growth, By Type
- Products: Export Prices And Growth, By Type
- Production Volume And Growth
- Exports And Growth
- Export Prices And Growth
- Market Size And Growth
- Per Capita Consumption
- Imports And Growth
- Import Prices
- Production, In Physical Terms, 2012–2023
- Production, In Value Terms, 2012–2023
- Imports, In Physical Terms, 2012–2023
- Imports, In Value Terms, 2012–2023
- Imports, In Physical Terms, By Country, 2023
- Imports, In Physical Terms, By Country, 2012–2023
- Imports, In Value Terms, By Country, 2012–2023
- Import Prices, By Country Of Origin, 2012–2023
- Exports, In Physical Terms, 2012–2023
- Exports, In Value Terms, 2012–2023
- Exports, In Physical Terms, By Country, 2023
- Exports, In Physical Terms, By Country, 2012–2023
- Exports, In Value Terms, By Country, 2012–2023
- Export Prices, By Country Of Destination, 2012–2023


