Italy - Sauces and Seasonings - Market Analysis, Forecast, Size, Trends And Insights
Get instant access to more than 2 million reports, dashboards, and datasets on the IndexBox Platform.
View PricingAverage Price of Sauce and Seasoning in Italy: $3,614 per Ton
Italy Sauce and Seasoning Export Price in May 2023
In May 2023, the sauce and seasoning price stood at $3,614 per ton, therefore (FOB, Italy), remained relatively stable against the previous month. Over the last twelve-month period, it increased at an average monthly rate of +2.4%. The most prominent rate of growth was recorded in April 2023 an increase of 8.2% against the previous month. As a result, the export price reached the peak level of $3,625 per ton, leveling off in the following month.
Prices varied noticeably by the country of destination: the country with the highest price was the Netherlands ($4,519 per ton), while the average price for exports to France ($2,677 per ton) was amongst the lowest.
From May 2022 to May 2023, the most notable rate of growth in terms of prices was recorded for supplies to Poland (+4.0%), while the prices for the other major destinations experienced more modest paces of growth.
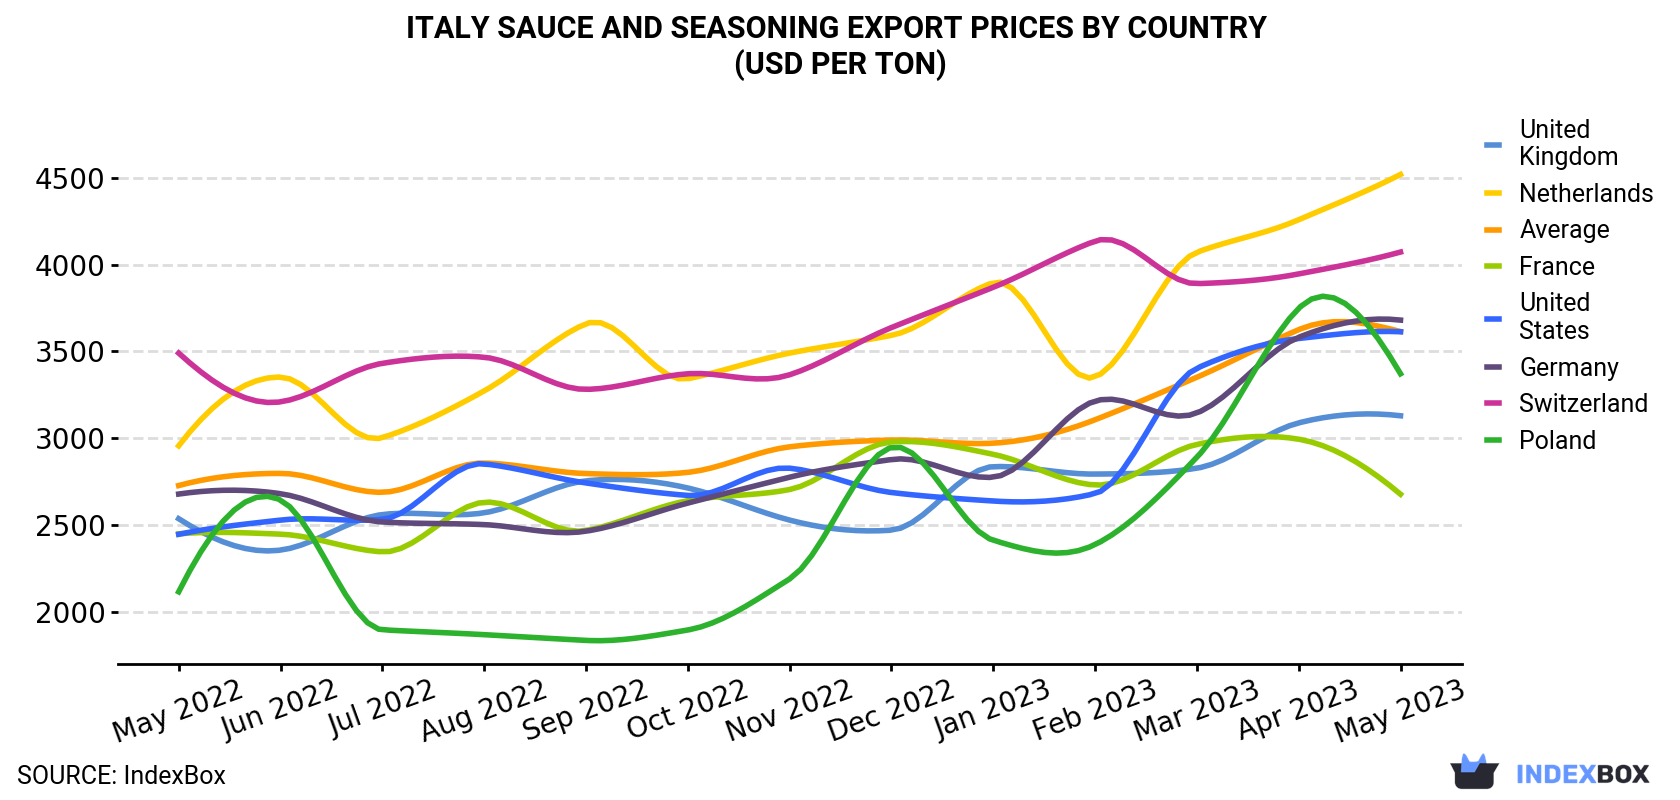
| COUNTRY | Export Price of Sauce and Seasoning in Italy (USD per ton) | ||||||||||||
|---|---|---|---|---|---|---|---|---|---|---|---|---|---|
| May 2022 | Jun 2022 | Jul 2022 | Aug 2022 | Sep 2022 | Oct 2022 | Nov 2022 | Dec 2022 | Jan 2023 | Feb 2023 | Mar 2023 | Apr 2023 | May 2023 | |
| Netherlands | 2,956 | 3,352 | 3,003 | 3,272 | 3,659 | 3,342 | 3,490 | 3,592 | 3,896 | 3,352 | 4,071 | 4,258 | 4,519 |
| Switzerland | 3,490 | 3,209 | 3,431 | 3,466 | 3,281 | 3,371 | 3,365 | 3,637 | 3,869 | 4,135 | 3,890 | 3,946 | 4,072 |
| Germany | 2,678 | 2,680 | 2,517 | 2,502 | 2,464 | 2,626 | 2,775 | 2,877 | 2,775 | 3,214 | 3,145 | 3,581 | 3,680 |
| United States | 2,446 | 2,528 | 2,532 | 2,852 | 2,742 | 2,670 | 2,827 | 2,687 | 2,638 | 2,681 | 3,403 | 3,574 | 3,613 |
| Poland | 2,115 | 2,644 | 1,896 | 1,868 | 1,835 | 1,895 | 2,189 | 2,947 | 2,412 | 2,387 | 2,890 | 3,748 | 3,371 |
| United Kingdom | 2,536 | 2,355 | 2,560 | 2,570 | 2,754 | 2,713 | 2,528 | 2,470 | 2,836 | 2,793 | 2,827 | 3,088 | 3,129 |
| France | 2,449 | 2,447 | 2,345 | 2,631 | 2,468 | 2,640 | 2,704 | 2,978 | 2,907 | 2,730 | 2,964 | 2,994 | 2,677 |
| Average | 2,727 | 2,797 | 2,688 | 2,857 | 2,796 | 2,803 | 2,950 | 2,989 | 2,971 | 3,106 | 3,351 | 3,625 | 3,614 |
Italy Sauce and Seasoning Exports
In May 2023, the amount of sauces and seasonings exported from Italy surged to 49K tons, rising by 28% against the month before. Over the period under review, exports, however, recorded a relatively flat trend pattern.
In value terms, sauce and seasoning exports surged to $179M (IndexBox estimates) in May 2023. The total export value increased at an average monthly rate of +1.9% from May 2022 to May 2023; the trend pattern indicated some noticeable fluctuations being recorded throughout the analyzed period. As a result, the exports reached the peak and are likely to continue growth in the immediate term.
Italy Sauce and Seasoning Exports by Country
The United States (12K tons), France (8.4K tons) and Germany (8.2K tons) were the main destinations of sauce and seasoning exports from Italy, together accounting for 57% of total exports. The UK, Australia, Switzerland, Poland, the Netherlands, Spain, Belgium and Austria lagged somewhat behind, together comprising a further 27%.
From May 2022 to May 2023, the biggest increases were in Australia (with a CAGR of +3.5%), while shipments for the other leaders experienced more modest paces of growth.
In value terms, the largest markets for sauce and seasoning exported from Italy were the United States ($42M), Germany ($30M) and France ($22M), together comprising 53% of total exports. These countries were followed by the UK, Australia, Switzerland, Spain, the Netherlands, Poland, Belgium and Austria, which together accounted for a further 28%.
In terms of the main countries of destination, Australia, with a CAGR of +5.8%, recorded the highest rates of growth with regard to the value of exports, over the period under review, while shipments for the other leaders experienced more modest paces of growth.
This report provides an in-depth analysis of the sauce and seasoning market in Italy. Within it, you will discover the latest data on market trends and opportunities by country, consumption, production and price developments, as well as the global trade (imports and exports). The forecast exhibits the market prospects through 2030.
Product coverage:
- Prodcom 10841210 - Soya sauce
- Prodcom 10841230 - Tomato ketchup and other tomato sauces
- Prodcom 10841253 - Mustard flour and meal
- Prodcom 10841255 - Prepared mustard
- Prodcom 10841270 - Sauces and preparations therefor, mixed condiments and mixed seasonings (excluding soya sauce, tomato ketchup, o ther tomato sauces, mustard flour or meal and prepared mustard)
Country coverage:
- Italy
Data coverage:
- Market volume and value
- Per Capita consumption
- Forecast of the market dynamics in the medium term
- Trade (exports and imports) in Italy
- Export and import prices
- Market trends, drivers and restraints
- Key market players and their profiles
Reasons to buy this report:
- Take advantage of the latest data
- Find deeper insights into current market developments
- Discover vital success factors affecting the market
This report is designed for manufacturers, distributors, importers, and wholesalers, as well as for investors, consultants and advisors.
In this report, you can find information that helps you to make informed decisions on the following issues:
- How to diversify your business and benefit from new market opportunities
- How to load your idle production capacity
- How to boost your sales on overseas markets
- How to increase your profit margins
- How to make your supply chain more sustainable
- How to reduce your production and supply chain costs
- How to outsource production to other countries
- How to prepare your business for global expansion
While doing this research, we combine the accumulated expertise of our analysts and the capabilities of artificial intelligence. The AI-based platform, developed by our data scientists, constitutes the key working tool for business analysts, empowering them to discover deep insights and ideas from the marketing data.
-
1. INTRODUCTION
Making Data-Driven Decisions to Grow Your Business
- REPORT DESCRIPTION
- RESEARCH METHODOLOGY AND AI PLATFORM
- DATA-DRIVEN DECISIONS FOR YOUR BUSINESS
- GLOSSARY AND SPECIFIC TERMS
-
2. EXECUTIVE SUMMARY
A Quick Overview of Market Performance
- KEY FINDINGS
- MARKET TRENDS This Chapter is Available Only for the Professional Edition PRO
-
3. MARKET OVERVIEW
Understanding the Current State of The Market and Its Prospects
- MARKET SIZE
- MARKET STRUCTURE
- TRADE BALANCE
- PER CAPITA CONSUMPTION
- MARKET FORECAST TO 2030
-
4. MOST PROMISING PRODUCT
Finding New Products to Diversify Your Business
This Chapter is Available Only for the Professional Edition PRO- TOP PRODUCTS TO DIVERSIFY YOUR BUSINESS
- BEST-SELLING PRODUCTS
- MOST CONSUMED PRODUCT
- MOST TRADED PRODUCT
- MOST PROFITABLE PRODUCT FOR EXPORT
-
5. MOST PROMISING SUPPLYING COUNTRIES
Choosing the Best Countries to Establish Your Sustainable Supply Chain
This Chapter is Available Only for the Professional Edition PRO- TOP COUNTRIES TO SOURCE YOUR PRODUCT
- TOP PRODUCING COUNTRIES
- TOP EXPORTING COUNTRIES
- LOW-COST EXPORTING COUNTRIES
-
6. MOST PROMISING OVERSEAS MARKETS
Choosing the Best Countries to Boost Your Exports
This Chapter is Available Only for the Professional Edition PRO- TOP OVERSEAS MARKETS FOR EXPORTING YOUR PRODUCT
- TOP CONSUMING MARKETS
- UNSATURATED MARKETS
- TOP IMPORTING MARKETS
- MOST PROFITABLE MARKETS
7. PRODUCTION
The Latest Trends and Insights into The Industry
- PRODUCTION VOLUME AND VALUE
8. IMPORTS
The Largest Import Supplying Countries
- IMPORTS FROM 2012–2023
- IMPORTS BY COUNTRY
- IMPORT PRICES BY COUNTRY
9. EXPORTS
The Largest Destinations for Exports
- EXPORTS FROM 2012–2023
- EXPORTS BY COUNTRY
- EXPORT PRICES BY COUNTRY
-
10. PROFILES OF MAJOR PRODUCERS
The Largest Producers on The Market and Their Profiles
This Chapter is Available Only for the Professional Edition PRO -
LIST OF TABLES
- Key Findings In 2023
- Market Volume, In Physical Terms, 2012–2023
- Market Value, 2012–2023
- Per Capita Consumption In 2012-2023
- Imports, In Physical Terms, By Country, 2012–2023
- Imports, In Value Terms, By Country, 2012–2023
- Import Prices, By Country Of Origin, 2012–2023
- Exports, In Physical Terms, By Country, 2012–2023
- Exports, In Value Terms, By Country, 2012–2023
- Export Prices, By Country Of Destination, 2012–2023
-
LIST OF FIGURES
- Market Volume, In Physical Terms, 2012–2023
- Market Value, 2012–2023
- Market Structure – Domestic Supply vs. Imports, In Physical Terms, 2012-2023
- Market Structure – Domestic Supply vs. Imports, In Value Terms, 2012-2023
- Trade Balance, In Physical Terms, 2012-2023
- Trade Balance, In Value Terms, 2012-2023
- Per Capita Consumption, 2012-2023
- Market Volume Forecast to 2030
- Market Value Forecast to 2030
- Products: Market Size And Growth, By Type
- Products: Average Per Capita Consumption, By Type
- Products: Exports And Growth, By Type
- Products: Export Prices And Growth, By Type
- Production Volume And Growth
- Exports And Growth
- Export Prices And Growth
- Market Size And Growth
- Per Capita Consumption
- Imports And Growth
- Import Prices
- Production, In Physical Terms, 2012–2023
- Production, In Value Terms, 2012–2023
- Imports, In Physical Terms, 2012–2023
- Imports, In Value Terms, 2012–2023
- Imports, In Physical Terms, By Country, 2023
- Imports, In Physical Terms, By Country, 2012–2023
- Imports, In Value Terms, By Country, 2012–2023
- Import Prices, By Country Of Origin, 2012–2023
- Exports, In Physical Terms, 2012–2023
- Exports, In Value Terms, 2012–2023
- Exports, In Physical Terms, By Country, 2023
- Exports, In Physical Terms, By Country, 2012–2023
- Exports, In Value Terms, By Country, 2012–2023
- Export Prices, By Country Of Destination, 2012–2023


