
Italy - Chocolate And Confectionery - Market Analysis, Forecast, Size, Trends And Insights
Get instant access to more than 2 million reports, dashboards, and datasets on the IndexBox Platform.
View PricingItaly's June 2023 Export of Chocolate and Confectionery Surges by 8%, Reaching $203M
Italy Chocolate And Confectionery Exports
In June 2023, approximately 31K tons of chocolate and confectionery were exported from Italy; picking up by 1.6% on May 2023. Over the period under review, exports, however, recorded a relatively flat trend pattern. The growth pace was the most rapid in May 2023 with an increase of 39% against the previous month.
In value terms, chocolate and confectionery exports rose markedly to $203M (IndexBox estimates) in June 2023. In general, total exports indicated a mild increase from June 2022 to June 2023: its value increased at an average monthly rate of +1.8% over the last twelve-month period. The trend pattern, however, indicated some noticeable fluctuations being recorded throughout the analyzed period. Based on June 2023 figures, exports increased by +53.5% against April 2023 indices. The pace of growth appeared the most rapid in May 2023 when exports increased by 42% m-o-m.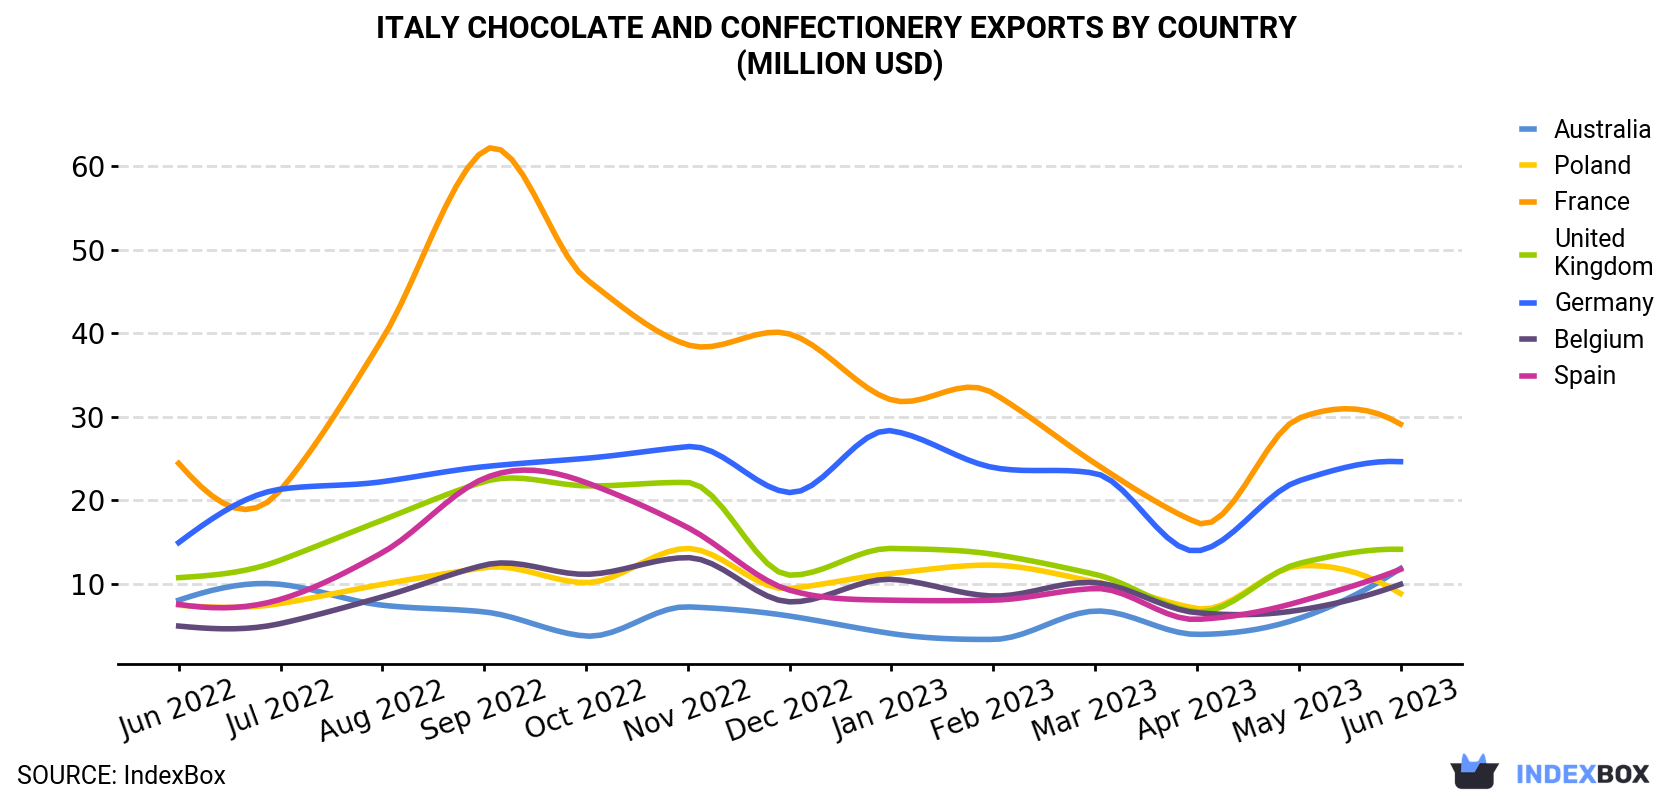
| COUNTRY | Export Value of Chocolate And Confectionery in Italy (million USD) | ||||||||||||
|---|---|---|---|---|---|---|---|---|---|---|---|---|---|
| Jun 2022 | Jul 2022 | Aug 2022 | Sep 2022 | Oct 2022 | Nov 2022 | Dec 2022 | Jan 2023 | Feb 2023 | Mar 2023 | Apr 2023 | May 2023 | Jun 2023 | |
| France | 24.4 | 21.2 | 39.3 | 61.9 | 46.5 | 38.6 | 39.9 | 32.0 | 32.8 | 24.4 | 17.3 | 29.8 | 29.1 |
| Germany | 14.9 | 21.3 | 22.2 | 24.0 | 25.0 | 26.4 | 20.9 | 28.3 | 23.9 | 23.2 | 13.9 | 22.3 | 24.6 |
| United Kingdom | 10.7 | 12.8 | 17.6 | 22.2 | 21.7 | 22.1 | 11.0 | 14.2 | 13.5 | 11.1 | 6.6 | 12.4 | 14.1 |
| Australia | 8.0 | 9.9 | 7.4 | 6.6 | 3.7 | 7.2 | 6.1 | 4.0 | 3.3 | 6.7 | 3.9 | 5.8 | 11.8 |
| Spain | 7.5 | 8.1 | 13.7 | 22.6 | 22.1 | 16.7 | 9.2 | 8.0 | 8.0 | 9.4 | 5.7 | 7.8 | 11.7 |
| Belgium | 4.9 | 5.2 | 8.4 | 12.2 | 11.1 | 13.1 | 7.8 | 10.5 | 8.5 | 10.1 | 6.5 | 6.8 | 9.9 |
| Poland | 7.4 | 7.6 | 9.9 | 11.9 | 10.1 | 14.2 | 9.4 | 11.2 | 12.2 | 10.2 | 7.0 | 12.1 | 8.8 |
| Others | 86.3 | 94.7 | 108 | 144 | 134 | 117 | 117 | 107 | 107 | 109 | 71.2 | 90.4 | 92.8 |
| Total | 164 | 181 | 226 | 305 | 275 | 256 | 222 | 215 | 209 | 204 | 132 | 187 | 203 |
Exports by Country
France (5.6K tons), Germany (4.2K tons) and Spain (2.1K tons) were the main destinations of chocolate and confectionery exports from Italy, together accounting for 39% of total exports. The UK, Belgium, Poland and Australia lagged somewhat behind, together accounting for a further 21%.
From June 2022 to June 2023, the most notable rate of growth in terms of shipments, amongst the main countries of destination, was attained by Belgium (with a CAGR of +2.8%), while the other leaders experienced more modest paces of growth.
In value terms, France ($29M), Germany ($25M) and the UK ($14M) appeared to be the largest markets for chocolate and confectionery exported from Italy worldwide, together comprising 33% of total exports. Australia, Spain, Belgium and Poland lagged somewhat behind, together comprising a further 21%.
Among the main countries of destination, Belgium, with a CAGR of +6.1%, saw the highest rates of growth with regard to the value of exports, over the period under review, while shipments for the other leaders experienced more modest paces of growth.
Export Prices by Country
In June 2023, the chocolate and confectionery price amounted to $6,543 per ton (FOB, Italy), increasing by 6.6% against the previous month. Over the period from June 2022 to June 2023, it increased at an average monthly rate of +1.9%. The pace of growth was the most pronounced in September 2022 an increase of 8.6% month-to-month. Over the period under review, the average export prices reached the peak figure in June 2023.
Prices varied noticeably by the country of destination: the country with the highest price was the United States ($11,088 per ton), while the average price for exports to France ($5,208 per ton) was amongst the lowest.
From June 2022 to June 2023, the most notable rate of growth in terms of prices was recorded for supplies to Belgium (+3.2%), while the prices for the other major destinations experienced more modest paces of growth.
This report provides an in-depth analysis of the chocolate and confectionery market in Italy. Within it, you will discover the latest data on market trends and opportunities by country, consumption, production and price developments, as well as the global trade (imports and exports). The forecast exhibits the market prospects through 2030.
Product coverage:
- Prodcom 10821100 - Cocoa paste (excluding containing added sugar or other sweetening matter)
- Prodcom 10821200 - Cocoa butter, fat and oil
- Prodcom 10821300 - Cocoa powder, not containing added sugar or other sweetening matter
- Prodcom 10821400 - Cocoa powder, containing added sugar or other sweetening matter
- Prodcom 10822130 - Chocolate and other food preparations containing cocoa, in blocks, slabs or bars > 2 kg or in liquid, paste, powder, g ranular or other bulk form, in containers or immediate packings of a content > 2 kg, containing . .18 % by weight of
- Prodcom 10822150 - Chocolate milk crumb containing .18 % or more by weight of cocoa butter and in packings weighing > 2 kg
- Prodcom 10822170 - Chocolate flavour coating containing .18 % or more by weight of cocoa butter and in packings weighing > 2 kg
- Prodcom 10822190 - Food preparations containing <18 % of cocoa butter and in packings weighing > 2 kg (excluding chocolate flavour coating, chocolate milk crumb)
- Prodcom 10822233 - Filled chocolate blocks, slabs or bars consisting of a centre (including of cream, liqueur or fruit paste, excluding chocolate biscuits)
- Prodcom 10822235 - Chocolate blocks, slabs or bars with added cereal, fruit or nuts (excluding filled, chocolate biscuits)
- Prodcom 10822239 - Chocolate blocks, slabs or bars (excluding filled, with added cereal, fruit or nuts, chocolate biscuits)
- Prodcom 10822243 - Chocolates (including pralines) containing alcohol (excluding in blocks, slabs or bars)
- Prodcom 10822245 - Chocolates (excluding those containing alcohol, in blocks, s labs or bars)
- Prodcom 10822253 - Filled chocolate confectionery (excluding in blocks, slabs or bars, chocolate biscuits, chocolates)
- Prodcom 10822255 - Chocolate confectionery (excluding filled, in blocks, slabs or bars, chocolate biscuits, chocolates)
- Prodcom 10822260 - Sugar confectionery and substitutes therefor made from sugar substitution products, containing cocoa (including chocolate nougat) (excluding white chocolate)
- Prodcom 10822270 - Chocolate spreads
- Prodcom 10822280 - Preparations containing cocoa for making beverages
- Prodcom 10822290 - Food products with cocoa (excluding cocoa paste, butter, p owder, blocks, slabs, bars, liquid, paste, powder, granular, o ther bulk form in packings > 2 kg, to make beverages, c hocolate spreads)
Country coverage:
- Italy
Data coverage:
- Market volume and value
- Per Capita consumption
- Forecast of the market dynamics in the medium term
- Trade (exports and imports) in Italy
- Export and import prices
- Market trends, drivers and restraints
- Key market players and their profiles
Reasons to buy this report:
- Take advantage of the latest data
- Find deeper insights into current market developments
- Discover vital success factors affecting the market
This report is designed for manufacturers, distributors, importers, and wholesalers, as well as for investors, consultants and advisors.
In this report, you can find information that helps you to make informed decisions on the following issues:
- How to diversify your business and benefit from new market opportunities
- How to load your idle production capacity
- How to boost your sales on overseas markets
- How to increase your profit margins
- How to make your supply chain more sustainable
- How to reduce your production and supply chain costs
- How to outsource production to other countries
- How to prepare your business for global expansion
While doing this research, we combine the accumulated expertise of our analysts and the capabilities of artificial intelligence. The AI-based platform, developed by our data scientists, constitutes the key working tool for business analysts, empowering them to discover deep insights and ideas from the marketing data.
-
1. INTRODUCTION
Making Data-Driven Decisions to Grow Your Business
- REPORT DESCRIPTION
- RESEARCH METHODOLOGY AND AI PLATFORM
- DATA-DRIVEN DECISIONS FOR YOUR BUSINESS
- GLOSSARY AND SPECIFIC TERMS
-
2. EXECUTIVE SUMMARY
A Quick Overview of Market Performance
- KEY FINDINGS
- MARKET TRENDS This Chapter is Available Only for the Professional Edition PRO
-
3. MARKET OVERVIEW
Understanding the Current State of The Market and Its Prospects
- MARKET SIZE
- MARKET STRUCTURE
- TRADE BALANCE
- PER CAPITA CONSUMPTION
- MARKET FORECAST TO 2030
-
4. MOST PROMISING PRODUCT
Finding New Products to Diversify Your Business
This Chapter is Available Only for the Professional Edition PRO- TOP PRODUCTS TO DIVERSIFY YOUR BUSINESS
- BEST-SELLING PRODUCTS
- MOST CONSUMED PRODUCT
- MOST TRADED PRODUCT
- MOST PROFITABLE PRODUCT FOR EXPORT
-
5. MOST PROMISING SUPPLYING COUNTRIES
Choosing the Best Countries to Establish Your Sustainable Supply Chain
This Chapter is Available Only for the Professional Edition PRO- TOP COUNTRIES TO SOURCE YOUR PRODUCT
- TOP PRODUCING COUNTRIES
- TOP EXPORTING COUNTRIES
- LOW-COST EXPORTING COUNTRIES
-
6. MOST PROMISING OVERSEAS MARKETS
Choosing the Best Countries to Boost Your Exports
This Chapter is Available Only for the Professional Edition PRO- TOP OVERSEAS MARKETS FOR EXPORTING YOUR PRODUCT
- TOP CONSUMING MARKETS
- UNSATURATED MARKETS
- TOP IMPORTING MARKETS
- MOST PROFITABLE MARKETS
7. PRODUCTION
The Latest Trends and Insights into The Industry
- PRODUCTION VOLUME AND VALUE
8. IMPORTS
The Largest Import Supplying Countries
- IMPORTS FROM 2012–2023
- IMPORTS BY COUNTRY
- IMPORT PRICES BY COUNTRY
9. EXPORTS
The Largest Destinations for Exports
- EXPORTS FROM 2012–2023
- EXPORTS BY COUNTRY
- EXPORT PRICES BY COUNTRY
-
10. PROFILES OF MAJOR PRODUCERS
The Largest Producers on The Market and Their Profiles
This Chapter is Available Only for the Professional Edition PRO -
LIST OF TABLES
- Key Findings In 2023
- Market Volume, In Physical Terms, 2012–2023
- Market Value, 2012–2023
- Per Capita Consumption In 2012-2023
- Imports, In Physical Terms, By Country, 2012–2023
- Imports, In Value Terms, By Country, 2012–2023
- Import Prices, By Country Of Origin, 2012–2023
- Exports, In Physical Terms, By Country, 2012–2023
- Exports, In Value Terms, By Country, 2012–2023
- Export Prices, By Country Of Destination, 2012–2023
-
LIST OF FIGURES
- Market Volume, In Physical Terms, 2012–2023
- Market Value, 2012–2023
- Market Structure – Domestic Supply vs. Imports, In Physical Terms, 2012-2023
- Market Structure – Domestic Supply vs. Imports, In Value Terms, 2012-2023
- Trade Balance, In Physical Terms, 2012-2023
- Trade Balance, In Value Terms, 2012-2023
- Per Capita Consumption, 2012-2023
- Market Volume Forecast to 2030
- Market Value Forecast to 2030
- Products: Market Size And Growth, By Type
- Products: Average Per Capita Consumption, By Type
- Products: Exports And Growth, By Type
- Products: Export Prices And Growth, By Type
- Production Volume And Growth
- Exports And Growth
- Export Prices And Growth
- Market Size And Growth
- Per Capita Consumption
- Imports And Growth
- Import Prices
- Production, In Physical Terms, 2012–2023
- Production, In Value Terms, 2012–2023
- Imports, In Physical Terms, 2012–2023
- Imports, In Value Terms, 2012–2023
- Imports, In Physical Terms, By Country, 2023
- Imports, In Physical Terms, By Country, 2012–2023
- Imports, In Value Terms, By Country, 2012–2023
- Import Prices, By Country Of Origin, 2012–2023
- Exports, In Physical Terms, 2012–2023
- Exports, In Value Terms, 2012–2023
- Exports, In Physical Terms, By Country, 2023
- Exports, In Physical Terms, By Country, 2012–2023
- Exports, In Value Terms, By Country, 2012–2023
- Export Prices, By Country Of Destination, 2012–2023


