
India - Ethyl Alcohol - Market Analysis, Forecast, Size, Trends and Insights
Get instant access to more than 2 million reports, dashboards, and datasets on the IndexBox Platform.
View PricingSignificant Decrease in India's Ethanol Price: $753 per Thousand Litres
India Ethanol Import Price in March 2023
In March 2023, the ethanol price amounted to $753 per thousand litres (CIF, India), declining by -82.3% against the previous month. Overall, the import price, however, showed a relatively flat trend pattern. The most prominent rate of growth was recorded in February 2023 when the average import price increased by 499% against the previous month. As a result, import price attained the peak level of $4,260 per thousand litres, and then declined markedly in the following month.
As there is only one major supplying country, the average price level is determined by prices for the United States.
From March 2022 to March 2023, the rate of growth in terms of prices for the United States amounted to +0.5% per month.
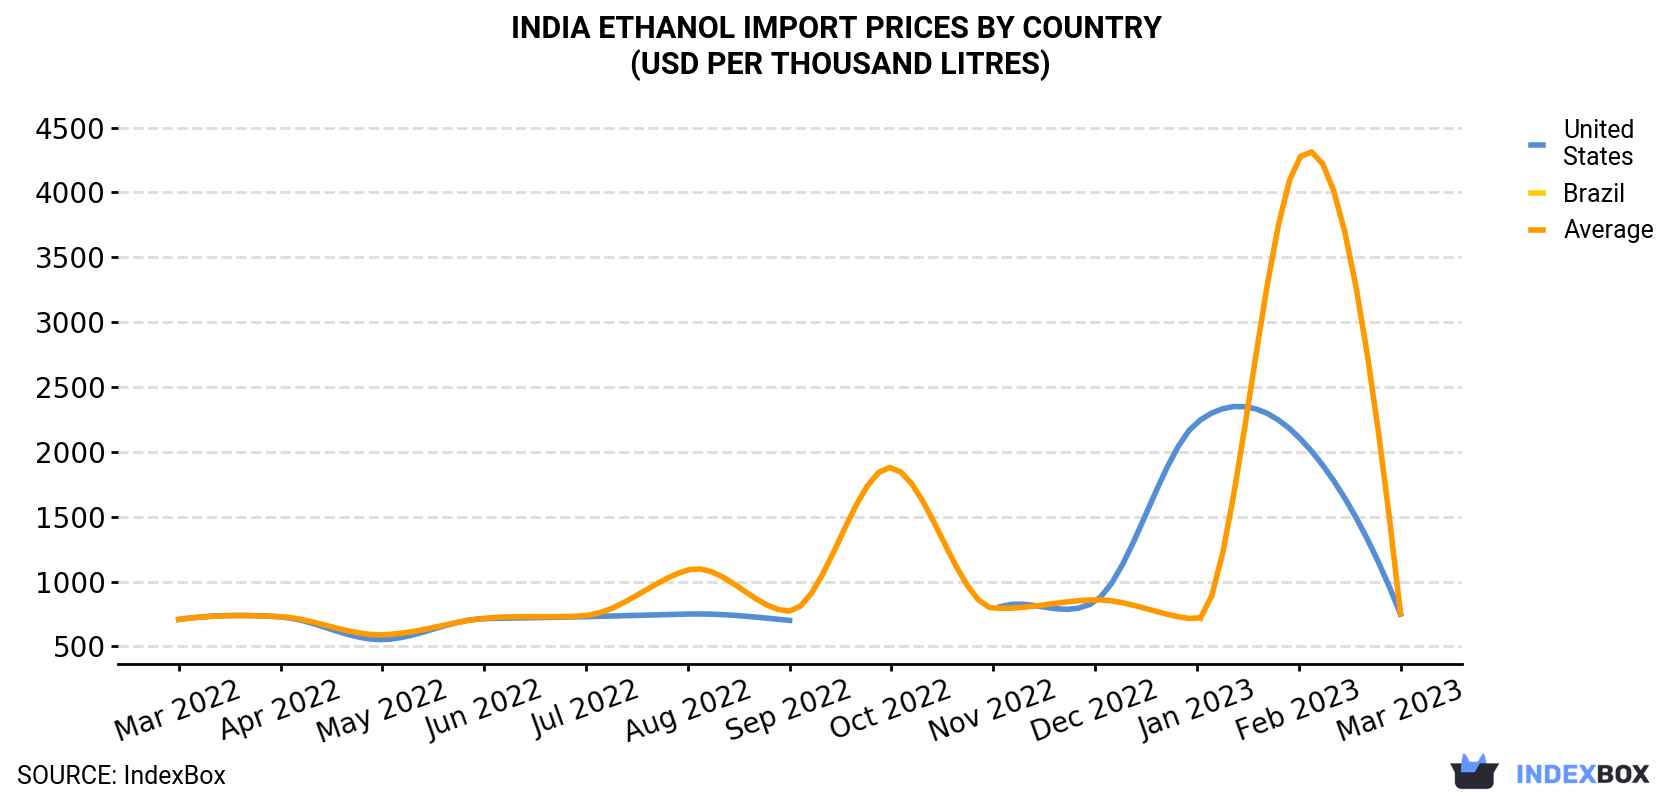
| COUNTRY | Import Price of Ethanol in India (USD per thousand litres) | ||||||||||||
|---|---|---|---|---|---|---|---|---|---|---|---|---|---|
| Mar 2022 | Apr 2022 | May 2022 | Jun 2022 | Jul 2022 | Aug 2022 | Sep 2022 | Oct 2022 | Nov 2022 | Dec 2022 | Jan 2023 | Feb 2023 | Mar 2023 | |
| United States | 708 | 728 | 553 | 715 | 730 | 750 | 701 | N/A | 784 | 847 | 2,226 | 2,114 | 750 |
| Brazil | N/A | N/A | N/A | N/A | N/A | N/A | N/A | N/A | N/A | N/A | 707 | N/A | N/A |
| Average | 709 | 730 | 590 | 717 | 739 | 1,090 | 773 | 1,879 | 795 | 860 | 711 | 4,260 | 753 |
India Ethanol Imports
Ethanol imports into India soared to 58M litres in March 2023, picking up by 62,384% against the previous month. Overall, imports, however, continue to indicate a deep contraction. Imports peaked at 191M litres in March 2022; however, from April 2022 to March 2023, imports stood at a somewhat lower figure.
In value terms, ethanol imports surged to $43M (IndexBox estimates) in March 2023. In general, imports, however, saw a abrupt slump. Over the period under review, imports attained the maximum at 136M litres in March 2022; however, from April 2022 to March 2023, imports remained at a lower figure.
India Ethanol Imports by Type
Undenatured ethyl alcohol of an alcoholic strength by volume more than 80 % (32M litres) and denatured ethyl alcohol and other denatured spirits (26M litres) were the main products of ethanol imports to India.
From March 2022 to March 2023, the biggest increases were in undenatured ethyl alcohol (with a CAGR of -9.5%).
In value terms, undenatured ethyl alcohol of an alcoholic strength by volume more than 80 % ($22M) and denatured ethyl alcohol and other denatured spirits ($22M) were the most imported types of ethyl alcohol in India.
India Ethanol Imports by Country
In March 2023, the United States (58M litres) was the main supplier of ethanol to India, with a approximately 100% share of total imports.
From March 2022 to March 2023, the average monthly rate of growth in terms of volume from the United States totaled -9.5%.
In value terms, the United States ($43M) constituted the largest supplier of ethanol to India.
From March 2022 to March 2023, the average monthly rate of growth in terms of value from the United States stood at -9.1%.
This report provides an in-depth analysis of the ethanol market in India. Within it, you will discover the latest data on market trends and opportunities by country, consumption, production and price developments, as well as the global trade (imports and exports). The forecast exhibits the market prospects through 2030.
Product coverage:
- Prodcom 20147400 - Undenatured ethyl alcohol of an alcoholic strength by volume. .80 % (important: excluding alcohol duty)
- Prodcom 20147500 - Denatured ethyl alcohol and other denatured spirits, of any strength
Country coverage:
- India
Data coverage:
- Market volume and value
- Per Capita consumption
- Forecast of the market dynamics in the medium term
- Trade (exports and imports) in India
- Export and import prices
- Market trends, drivers and restraints
- Key market players and their profiles
Reasons to buy this report:
- Take advantage of the latest data
- Find deeper insights into current market developments
- Discover vital success factors affecting the market
This report is designed for manufacturers, distributors, importers, and wholesalers, as well as for investors, consultants and advisors.
In this report, you can find information that helps you to make informed decisions on the following issues:
- How to diversify your business and benefit from new market opportunities
- How to load your idle production capacity
- How to boost your sales on overseas markets
- How to increase your profit margins
- How to make your supply chain more sustainable
- How to reduce your production and supply chain costs
- How to outsource production to other countries
- How to prepare your business for global expansion
While doing this research, we combine the accumulated expertise of our analysts and the capabilities of artificial intelligence. The AI-based platform, developed by our data scientists, constitutes the key working tool for business analysts, empowering them to discover deep insights and ideas from the marketing data.
-
1. INTRODUCTION
Making Data-Driven Decisions to Grow Your Business
- REPORT DESCRIPTION
- RESEARCH METHODOLOGY AND AI PLATFORM
- DATA-DRIVEN DECISIONS FOR YOUR BUSINESS
- GLOSSARY AND SPECIFIC TERMS
-
2. EXECUTIVE SUMMARY
A Quick Overview of Market Performance
- KEY FINDINGS
- MARKET TRENDS This Chapter is Available Only for the Professional Edition PRO
-
3. MARKET OVERVIEW
Understanding the Current State of The Market and Its Prospects
- MARKET SIZE
- MARKET STRUCTURE
- TRADE BALANCE
- PER CAPITA CONSUMPTION
- MARKET FORECAST TO 2030
-
4. MOST PROMISING PRODUCT
Finding New Products to Diversify Your Business
This Chapter is Available Only for the Professional Edition PRO- TOP PRODUCTS TO DIVERSIFY YOUR BUSINESS
- BEST-SELLING PRODUCTS
- MOST CONSUMED PRODUCT
- MOST TRADED PRODUCT
- MOST PROFITABLE PRODUCT FOR EXPORT
-
5. MOST PROMISING SUPPLYING COUNTRIES
Choosing the Best Countries to Establish Your Sustainable Supply Chain
This Chapter is Available Only for the Professional Edition PRO- TOP COUNTRIES TO SOURCE YOUR PRODUCT
- TOP PRODUCING COUNTRIES
- TOP EXPORTING COUNTRIES
- LOW-COST EXPORTING COUNTRIES
-
6. MOST PROMISING OVERSEAS MARKETS
Choosing the Best Countries to Boost Your Exports
This Chapter is Available Only for the Professional Edition PRO- TOP OVERSEAS MARKETS FOR EXPORTING YOUR PRODUCT
- TOP CONSUMING MARKETS
- UNSATURATED MARKETS
- TOP IMPORTING MARKETS
- MOST PROFITABLE MARKETS
7. PRODUCTION
The Latest Trends and Insights into The Industry
- PRODUCTION VOLUME AND VALUE
8. IMPORTS
The Largest Import Supplying Countries
- IMPORTS FROM 2012–2023
- IMPORTS BY COUNTRY
- IMPORT PRICES BY COUNTRY
9. EXPORTS
The Largest Destinations for Exports
- EXPORTS FROM 2012–2023
- EXPORTS BY COUNTRY
- EXPORT PRICES BY COUNTRY
-
10. PROFILES OF MAJOR PRODUCERS
The Largest Producers on The Market and Their Profiles
This Chapter is Available Only for the Professional Edition PRO -
LIST OF TABLES
- Key Findings In 2023
- Market Volume, In Physical Terms, 2012–2023
- Market Value, 2012–2023
- Per Capita Consumption In 2012-2023
- Imports, In Physical Terms, By Country, 2012–2023
- Imports, In Value Terms, By Country, 2012–2023
- Import Prices, By Country Of Origin, 2012–2023
- Exports, In Physical Terms, By Country, 2012–2023
- Exports, In Value Terms, By Country, 2012–2023
- Export Prices, By Country Of Destination, 2012–2023
-
LIST OF FIGURES
- Market Volume, In Physical Terms, 2012–2023
- Market Value, 2012–2023
- Market Structure – Domestic Supply vs. Imports, In Physical Terms, 2012-2023
- Market Structure – Domestic Supply vs. Imports, In Value Terms, 2012-2023
- Trade Balance, In Physical Terms, 2012-2023
- Trade Balance, In Value Terms, 2012-2023
- Per Capita Consumption, 2012-2023
- Market Volume Forecast to 2030
- Market Value Forecast to 2030
- Products: Market Size And Growth, By Type
- Products: Average Per Capita Consumption, By Type
- Products: Exports And Growth, By Type
- Products: Export Prices And Growth, By Type
- Production Volume And Growth
- Exports And Growth
- Export Prices And Growth
- Market Size And Growth
- Per Capita Consumption
- Imports And Growth
- Import Prices
- Production, In Physical Terms, 2012–2023
- Production, In Value Terms, 2012–2023
- Imports, In Physical Terms, 2012–2023
- Imports, In Value Terms, 2012–2023
- Imports, In Physical Terms, By Country, 2023
- Imports, In Physical Terms, By Country, 2012–2023
- Imports, In Value Terms, By Country, 2012–2023
- Import Prices, By Country Of Origin, 2012–2023
- Exports, In Physical Terms, 2012–2023
- Exports, In Value Terms, 2012–2023
- Exports, In Physical Terms, By Country, 2023
- Exports, In Physical Terms, By Country, 2012–2023
- Exports, In Value Terms, By Country, 2012–2023
- Export Prices, By Country Of Destination, 2012–2023


