Hong Kong SAR, China - Cyclic Hydrocarbons - Market Analysis, Forecast, Size, Trends and Insights
Get instant access to more than 2 million reports, dashboards, and datasets on the IndexBox Platform.
View PricingHong Kong's Cyclic Hydrocarbons Witness 6% Decrease, Now Priced at $1,085 per Ton
Hong Kong Cyclic Hydrocarbons Import Price in June 2023
In June 2023, the cyclic hydrocarbons price amounted to $1,085 per ton (CIF, Hong Kong), waning by -6% against the previous month. Overall, the import price recorded a slight slump. The most prominent rate of growth was recorded in January 2023 when the average import price increased by 8.2% m-o-m. Over the period under review, average import prices attained the peak figure at $1,425 per ton in July 2022; however, from August 2022 to June 2023, import prices remained at a lower figure.
Average prices varied noticeably amongst the major supplying countries. In June 2023, the country with the highest price was Taiwan (Chinese) ($1,120 per ton), while the price for South Korea amounted to $1,029 per ton.
From June 2022 to June 2023, the most notable rate of growth in terms of prices was attained by Kuwait (+0.5%), while the prices for the other major suppliers experienced a decline.
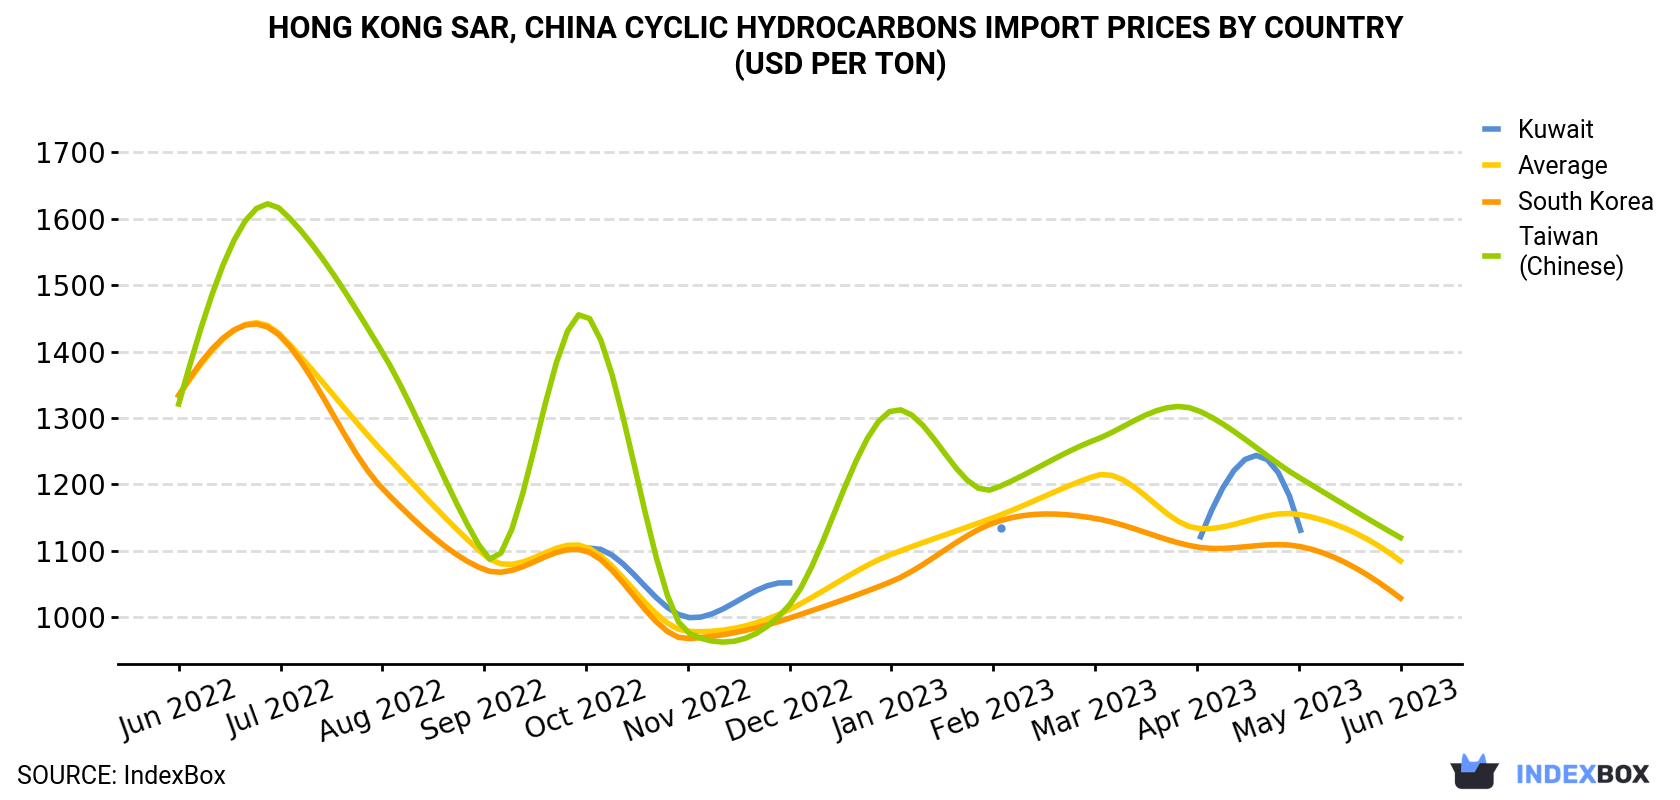
| COUNTRY | Import Price of Cyclic Hydrocarbons in Hong Kong (USD per ton) | ||||||||||||
|---|---|---|---|---|---|---|---|---|---|---|---|---|---|
| Jun 2022 | Jul 2022 | Aug 2022 | Sep 2022 | Oct 2022 | Nov 2022 | Dec 2022 | Jan 2023 | Feb 2023 | Mar 2023 | Apr 2023 | May 2023 | Jun 2023 | |
| Taiwan (Chinese) | 1,321 | 1,614 | 1,399 | 1,096 | 1,455 | 977 | 1,019 | 1,311 | 1,193 | 1,267 | 1,312 | 1,211 | 1,120 |
| South Korea | 1,334 | 1,423 | 1,194 | 1,072 | 1,100 | 968 | 999 | 1,054 | 1,142 | 1,149 | 1,106 | 1,107 | 1,029 |
| Kuwait | N/A | N/A | N/A | N/A | 1,103 | 1,000 | 1,052 | N/A | 1,135 | N/A | 1,107 | 1,141 | N/A |
| Average | 1,334 | 1,425 | 1,250 | 1,094 | 1,106 | 979 | 1,012 | 1,095 | 1,150 | 1,213 | 1,134 | 1,155 | 1,085 |
Hong Kong Cyclic Hydrocarbons Imports
In June 2023, the amount of cyclic hydrocarbons imported into Hong Kong plummeted to 6.2K tons, declining by -50.9% on May 2023. Overall, imports showed a abrupt slump. The most prominent rate of growth was recorded in April 2023 with an increase of 64% m-o-m.
In value terms, cyclic hydrocarbons imports dropped significantly to $6.8M (IndexBox estimates) in June 2023. In general, imports continue to indicate a abrupt curtailment. The most prominent rate of growth was recorded in April 2023 when imports increased by 54% m-o-m.
Hong Kong Cyclic Hydrocarbons Imports by Country
Taiwan (Chinese) (3.2K tons) and South Korea (3K tons) were the main suppliers of cyclic hydrocarbons imports to Hong Kong.
From June 2022 to June 2023, the biggest increases were in Taiwan (Chinese) (with a CAGR of +0.7%).
In value terms, the largest cyclic hydrocarbons suppliers to Hong Kong were Taiwan (Chinese) ($3.5M) and South Korea ($3.1M).
Taiwan (Chinese), with a CAGR of -0.7%, recorded the highest growth rate of the value of imports, in terms of the main suppliers over the period under review.
This report provides an in-depth analysis of the cyclic hydrocarbons market in Hong Kong SAR, China. Within it, you will discover the latest data on market trends and opportunities by country, consumption, production and price developments, as well as the global trade (imports and exports). The forecast exhibits the market prospects through 2030.
Product coverage:
- Prodcom 20141213 - Cyclohexane
- Prodcom 20141215 - Cyclanes, cyclenes and cycloterpenes (excluding cyclohexane)
- Prodcom 20141223 - Benzene
- Prodcom 20141225 - Toluene
- Prodcom 20141243 - o-Xylene
- Prodcom 20141245 - p-Xylene
- Prodcom 20141247 - m-Xylene and mixed xylene isomers
- Prodcom 20141250 - Styrene
- Prodcom 20141260 - Ethylbenzene
- Prodcom 20141270 - Cumene
- Prodcom 20141290 - Other cyclic hydrocarbons
Country coverage:
- Hong Kong SAR
Data coverage:
- Market volume and value
- Per Capita consumption
- Forecast of the market dynamics in the medium term
- Trade (exports and imports) in Hong Kong SAR, China
- Export and import prices
- Market trends, drivers and restraints
- Key market players and their profiles
Reasons to buy this report:
- Take advantage of the latest data
- Find deeper insights into current market developments
- Discover vital success factors affecting the market
This report is designed for manufacturers, distributors, importers, and wholesalers, as well as for investors, consultants and advisors.
In this report, you can find information that helps you to make informed decisions on the following issues:
- How to diversify your business and benefit from new market opportunities
- How to load your idle production capacity
- How to boost your sales on overseas markets
- How to increase your profit margins
- How to make your supply chain more sustainable
- How to reduce your production and supply chain costs
- How to outsource production to other countries
- How to prepare your business for global expansion
While doing this research, we combine the accumulated expertise of our analysts and the capabilities of artificial intelligence. The AI-based platform, developed by our data scientists, constitutes the key working tool for business analysts, empowering them to discover deep insights and ideas from the marketing data.
-
1. INTRODUCTION
Making Data-Driven Decisions to Grow Your Business
- REPORT DESCRIPTION
- RESEARCH METHODOLOGY AND AI PLATFORM
- DATA-DRIVEN DECISIONS FOR YOUR BUSINESS
- GLOSSARY AND SPECIFIC TERMS
-
2. EXECUTIVE SUMMARY
A Quick Overview of Market Performance
- KEY FINDINGS
- MARKET TRENDS This Chapter is Available Only for the Professional Edition PRO
-
3. MARKET OVERVIEW
Understanding the Current State of The Market and Its Prospects
- MARKET SIZE
- MARKET STRUCTURE
- TRADE BALANCE
- PER CAPITA CONSUMPTION
- MARKET FORECAST TO 2030
-
4. MOST PROMISING PRODUCT
Finding New Products to Diversify Your Business
This Chapter is Available Only for the Professional Edition PRO- TOP PRODUCTS TO DIVERSIFY YOUR BUSINESS
- BEST-SELLING PRODUCTS
- MOST CONSUMED PRODUCT
- MOST TRADED PRODUCT
- MOST PROFITABLE PRODUCT FOR EXPORT
-
5. MOST PROMISING SUPPLYING COUNTRIES
Choosing the Best Countries to Establish Your Sustainable Supply Chain
This Chapter is Available Only for the Professional Edition PRO- TOP COUNTRIES TO SOURCE YOUR PRODUCT
- TOP PRODUCING COUNTRIES
- TOP EXPORTING COUNTRIES
- LOW-COST EXPORTING COUNTRIES
-
6. MOST PROMISING OVERSEAS MARKETS
Choosing the Best Countries to Boost Your Exports
This Chapter is Available Only for the Professional Edition PRO- TOP OVERSEAS MARKETS FOR EXPORTING YOUR PRODUCT
- TOP CONSUMING MARKETS
- UNSATURATED MARKETS
- TOP IMPORTING MARKETS
- MOST PROFITABLE MARKETS
7. PRODUCTION
The Latest Trends and Insights into The Industry
- PRODUCTION VOLUME AND VALUE
8. IMPORTS
The Largest Import Supplying Countries
- IMPORTS FROM 2012–2023
- IMPORTS BY COUNTRY
- IMPORT PRICES BY COUNTRY
9. EXPORTS
The Largest Destinations for Exports
- EXPORTS FROM 2012–2023
- EXPORTS BY COUNTRY
- EXPORT PRICES BY COUNTRY
-
10. PROFILES OF MAJOR PRODUCERS
The Largest Producers on The Market and Their Profiles
This Chapter is Available Only for the Professional Edition PRO -
LIST OF TABLES
- Key Findings In 2023
- Market Volume, In Physical Terms, 2012–2023
- Market Value, 2012–2023
- Per Capita Consumption In 2012-2023
- Imports, In Physical Terms, By Country, 2012–2023
- Imports, In Value Terms, By Country, 2012–2023
- Import Prices, By Country Of Origin, 2012–2023
- Exports, In Physical Terms, By Country, 2012–2023
- Exports, In Value Terms, By Country, 2012–2023
- Export Prices, By Country Of Destination, 2012–2023
-
LIST OF FIGURES
- Market Volume, In Physical Terms, 2012–2023
- Market Value, 2012–2023
- Market Structure – Domestic Supply vs. Imports, In Physical Terms, 2012-2023
- Market Structure – Domestic Supply vs. Imports, In Value Terms, 2012-2023
- Trade Balance, In Physical Terms, 2012-2023
- Trade Balance, In Value Terms, 2012-2023
- Per Capita Consumption, 2012-2023
- Market Volume Forecast to 2030
- Market Value Forecast to 2030
- Products: Market Size And Growth, By Type
- Products: Average Per Capita Consumption, By Type
- Products: Exports And Growth, By Type
- Products: Export Prices And Growth, By Type
- Production Volume And Growth
- Exports And Growth
- Export Prices And Growth
- Market Size And Growth
- Per Capita Consumption
- Imports And Growth
- Import Prices
- Production, In Physical Terms, 2012–2023
- Production, In Value Terms, 2012–2023
- Imports, In Physical Terms, 2012–2023
- Imports, In Value Terms, 2012–2023
- Imports, In Physical Terms, By Country, 2023
- Imports, In Physical Terms, By Country, 2012–2023
- Imports, In Value Terms, By Country, 2012–2023
- Import Prices, By Country Of Origin, 2012–2023
- Exports, In Physical Terms, 2012–2023
- Exports, In Value Terms, 2012–2023
- Exports, In Physical Terms, By Country, 2023
- Exports, In Physical Terms, By Country, 2012–2023
- Exports, In Value Terms, By Country, 2012–2023
- Export Prices, By Country Of Destination, 2012–2023


