World - Herbicides - Market Analysis, Forecast, Size, Trends and Insights
Get instant access to more than 2 million reports, dashboards, and datasets on the IndexBox Platform.
View PricingGlobal Herbicides Market Expected to Grow at CAGR of 4.8% and Reach $52.7B by 2030
IndexBox has just published a new report: World - Herbicides - Market Analysis, Forecast, Size, Trends and Insights.
The global herbicide market is expected to see growth in both volume and value over the next seven years, driven by increasing demand worldwide. The market is forecasted to expand at a CAGR of +4.8% in volume and +6.3% in value from 2023 to 2030. Consumption patterns have shown fluctuations, with China leading in both production and exports. Key players include the United States, India, and Brazil. Prices have varied among countries, with Germany having the highest export price and China the lowest.
Market Forecast
Market Forecast
Driven by increasing demand for herbicides worldwide, the market is expected to continue an upward consumption trend over the next seven-year period. Market performance is forecast to accelerate, expanding with an anticipated CAGR of +4.8% for the period from 2023 to 2030, which is projected to bring the market volume to 6.8M tons by the end of 2030.
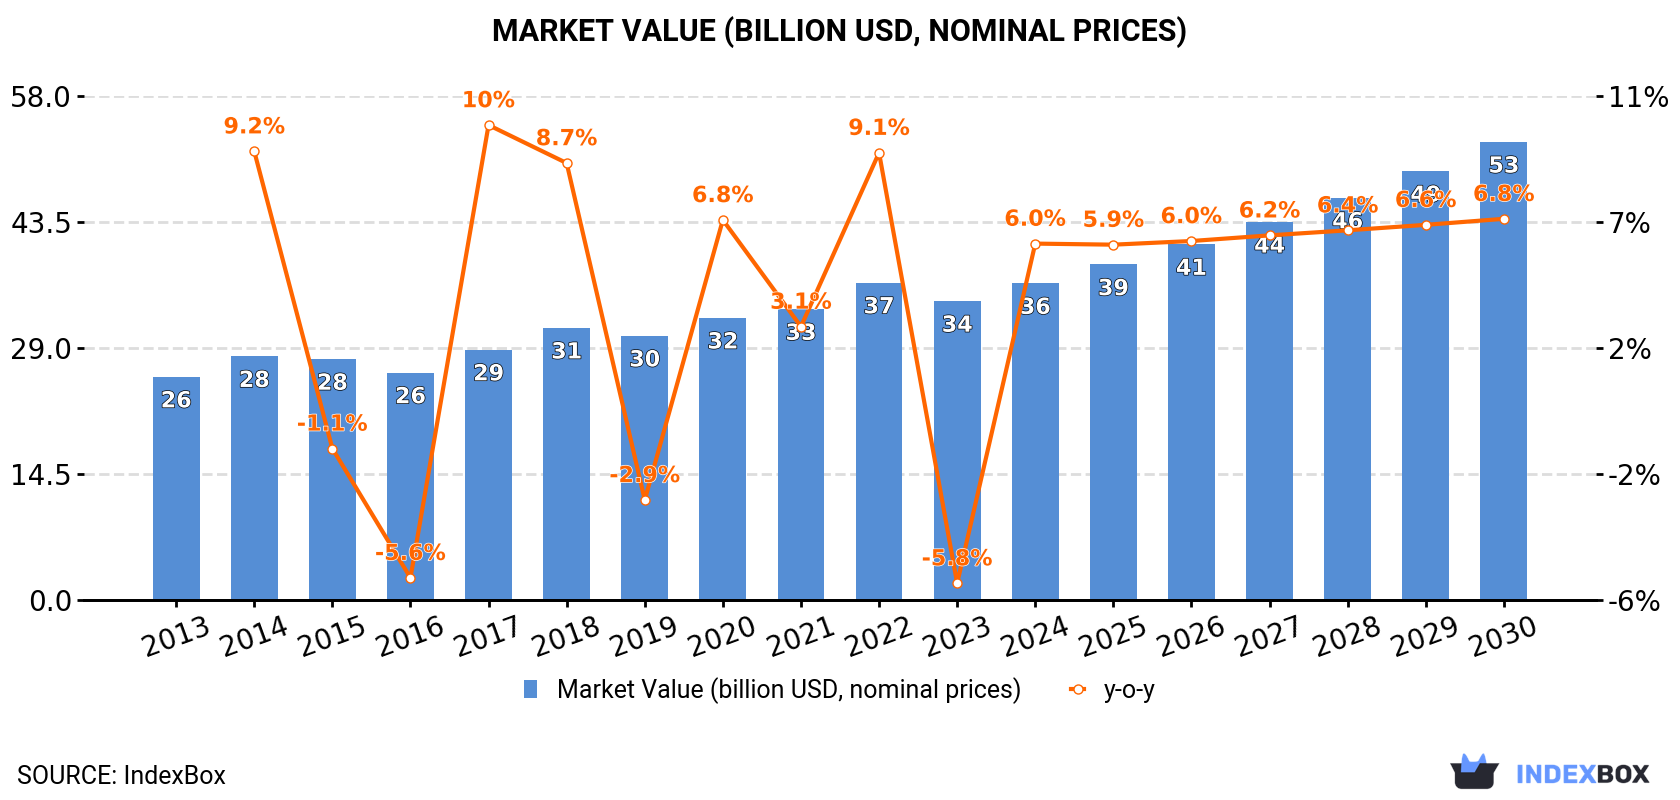
In value terms, the market is forecast to increase with an anticipated CAGR of +6.3% for the period from 2023 to 2030, which is projected to bring the market value to $52.7B (in nominal prices) by the end of 2030.
Consumption
Consumption
In 2023, consumption of herbicides decreased by -0.4% to 4.9M tons, falling for the second year in a row after two years of growth. The total consumption volume increased at an average annual rate of +3.4% from 2013 to 2023; however, the trend pattern indicated some noticeable fluctuations being recorded in certain years. Global consumption peaked at 5M tons in 2021; however, from 2022 to 2023, consumption stood at a somewhat lower figure.
The global herbicide market revenue dropped to $34.4B in 2023, declining by -5.8% against the previous year. This figure reflects the total revenues of producers and importers (excluding logistics costs, retail marketing costs, and retailers' margins, which will be included in the final consumer price). The market value increased at an average annual rate of +3.0% over the period from 2013 to 2023; however, the trend pattern indicated some noticeable fluctuations being recorded throughout the analyzed period. Global consumption peaked at $36.5B in 2022, and then contracted in the following year.
Consumption By Country
The countries with the highest volumes of consumption in 2023 were China (657K tons), the United States (610K tons) and India (388K tons), together comprising 34% of global consumption. Brazil, Indonesia, Canada, Australia, Mexico, Japan, Turkey, Russia, Thailand and France lagged somewhat behind, together accounting for a further 30%.
From 2013 to 2023, the biggest increases were recorded for France (with a CAGR of +12.7%), while consumption for the other global leaders experienced more modest paces of growth.
In value terms, the largest herbicide markets worldwide were the United States ($4.9B), Japan ($4.3B) and China ($2.2B), with a combined 33% share of the global market. Brazil, Canada, India, Indonesia, France, Turkey, Mexico, Australia, Russia and Thailand lagged somewhat behind, together comprising a further 32%.
Russia, with a CAGR of +12.3%, saw the highest rates of growth with regard to market size in terms of the main consuming countries over the period under review, while market for the other global leaders experienced more modest paces of growth.
The countries with the highest levels of herbicide per capita consumption in 2023 were Australia (5.6 kg per person), Canada (4 kg per person) and the United States (1.8 kg per person).
From 2013 to 2023, the biggest increases were recorded for France (with a CAGR of +12.4%), while consumption for the other global leaders experienced more modest paces of growth.
Production
Production
In 2023, production of herbicides decreased by -0.3% to 5.3M tons for the first time since 2018, thus ending a four-year rising trend. The total output volume increased at an average annual rate of +4.2% from 2013 to 2023; however, the trend pattern indicated some noticeable fluctuations being recorded in certain years. The most prominent rate of growth was recorded in 2017 with an increase of 33% against the previous year. Global production peaked at 5.3M tons in 2022, and then dropped modestly in the following year.
In value terms, herbicide production stood at $32.4B in 2023 estimated in export price. The total output value increased at an average annual rate of +3.9% from 2013 to 2023; however, the trend pattern indicated some noticeable fluctuations being recorded in certain years. The most prominent rate of growth was recorded in 2014 when the production volume increased by 15%. Over the period under review, global production attained the peak level at $32.7B in 2021; however, from 2022 to 2023, production stood at a somewhat lower figure.
Production By Country
The country with the largest volume of herbicide production was China (2.3M tons), accounting for 43% of total volume. Moreover, herbicide production in China exceeded the figures recorded by the second-largest producer, the United States (710K tons), threefold. The third position in this ranking was taken by India (482K tons), with a 9.1% share.
From 2013 to 2023, the average annual growth rate of volume in China stood at +6.0%. The remaining producing countries recorded the following average annual rates of production growth: the United States (+3.1% per year) and India (+7.8% per year).
Imports
Imports
In 2023, supplies from abroad of herbicides decreased by -5.9% to 2.4M tons for the first time since 2019, thus ending a three-year rising trend. The total import volume increased at an average annual rate of +2.9% over the period from 2013 to 2023; however, the trend pattern indicated some noticeable fluctuations being recorded throughout the analyzed period. The pace of growth appeared the most rapid in 2020 with an increase of 22%. Global imports peaked at 2.6M tons in 2022, and then fell in the following year.
In value terms, herbicide imports fell significantly to $16.1B in 2023. Overall, total imports indicated a perceptible expansion from 2013 to 2023: its value increased at an average annual rate of +2.8% over the last decade. The trend pattern, however, indicated some noticeable fluctuations being recorded throughout the analyzed period. Based on 2023 figures, imports increased by +40.1% against 2019 indices. The growth pace was the most rapid in 2022 with an increase of 36% against the previous year. As a result, imports attained the peak of $19.3B, and then contracted markedly in the following year.
Imports By Country
In 2023, Brazil (299K tons), followed by Canada (162K tons) and Australia (155K tons) represented the largest importers of herbicides, together achieving 25% of total imports. Thailand (96K tons), Nigeria (88K tons), Indonesia (83K tons), France (74K tons), India (72K tons), the United States (64K tons), Ukraine (56K tons), Argentina (53K tons), Ghana (50K tons) and Germany (48K tons) followed a long way behind the leaders.
From 2013 to 2023, the most notable rate of growth in terms of purchases, amongst the key importing countries, was attained by India (with a CAGR of +22.9%), while imports for the other global leaders experienced more modest paces of growth.
In value terms, Brazil ($1.8B), Canada ($1.1B) and France ($829M) were the countries with the highest levels of imports in 2023, with a combined 23% share of global imports. Australia, Germany, the United States, Argentina, Ukraine, India, Indonesia, Nigeria, Thailand and Ghana lagged somewhat behind, together accounting for a further 27%.
India, with a CAGR of +11.5%, saw the highest rates of growth with regard to the value of imports, among the main importing countries over the period under review, while purchases for the other global leaders experienced more modest paces of growth.
Import Prices By Country
In 2023, the average herbicide import price amounted to $6,588 per ton, falling by -11.2% against the previous year. Overall, the import price saw a relatively flat trend pattern. The most prominent rate of growth was recorded in 2022 an increase of 26% against the previous year. As a result, import price attained the peak level of $7,422 per ton, and then declined in the following year.
There were significant differences in the average prices amongst the major importing countries. In 2023, amid the top importers, the country with the highest price was Germany ($13,577 per ton), while Thailand ($3,087 per ton) was amongst the lowest.
From 2013 to 2023, the most notable rate of growth in terms of prices was attained by Canada (+3.5%), while the other global leaders experienced more modest paces of growth.
Exports
Exports
In 2023, after three years of growth, there was significant decline in shipments abroad of herbicides, when their volume decreased by -5.1% to 2.8M tons. In general, total exports indicated a perceptible expansion from 2013 to 2023: its volume increased at an average annual rate of +4.4% over the last decade. The trend pattern, however, indicated some noticeable fluctuations being recorded throughout the analyzed period. Based on 2023 figures, exports increased by +32.9% against 2019 indices. The most prominent rate of growth was recorded in 2017 with an increase of 22%. Over the period under review, the global exports attained the maximum at 2.9M tons in 2022, and then reduced in the following year.
In value terms, herbicide exports fell dramatically to $16.3B in 2023. Overall, total exports indicated moderate growth from 2013 to 2023: its value increased at an average annual rate of +3.6% over the last decade. The trend pattern, however, indicated some noticeable fluctuations being recorded throughout the analyzed period. Based on 2023 figures, exports increased by +35.6% against 2019 indices. The pace of growth was the most pronounced in 2022 when exports increased by 32%. As a result, the exports reached the peak of $20.5B, and then shrank sharply in the following year.
Exports By Country
China prevails in exports structure, accounting for 1.6M tons, which was near 59% of total exports in 2023. India (166K tons) took the second position in the ranking, followed by the United States (165K tons). All these countries together took approx. 12% share of total exports. The following exporters - Belgium (122K tons), France (91K tons), Germany (78K tons), Israel (64K tons) and Malaysia (52K tons) - together made up 15% of total exports.
From 2013 to 2023, average annual rates of growth with regard to herbicide exports from China stood at +8.0%. At the same time, Belgium (+15.9%), India (+14.5%) and Malaysia (+3.0%) displayed positive paces of growth. Moreover, Belgium emerged as the fastest-growing exporter exported in the world, with a CAGR of +15.9% from 2013-2023. Israel experienced a relatively flat trend pattern. By contrast, Germany (-1.0%), the United States (-2.6%) and France (-4.4%) illustrated a downward trend over the same period. China (+17 p.p.), India (+3.6 p.p.) and Belgium (+2.8 p.p.) significantly strengthened its position in terms of the global exports, while Germany, France and the United States saw its share reduced by -2%, -4.7% and -6% from 2013 to 2023, respectively. The shares of the other countries remained relatively stable throughout the analyzed period.
In value terms, China ($4.8B) remains the largest herbicide supplier worldwide, comprising 30% of global exports. The second position in the ranking was held by India ($1.7B), with an 11% share of global exports. It was followed by the United States, with a 10% share.
In China, herbicide exports expanded at an average annual rate of +7.2% over the period from 2013-2023. The remaining exporting countries recorded the following average annual rates of exports growth: India (+17.7% per year) and the United States (+0.6% per year).
Export Prices By Country
In 2023, the average herbicide export price amounted to $5,852 per ton, dropping by -15.9% against the previous year. Over the period under review, the export price continues to indicate a relatively flat trend pattern. The pace of growth appeared the most rapid in 2022 when the average export price increased by 17%. As a result, the export price attained the peak level of $6,960 per ton, and then fell significantly in the following year.
Prices varied noticeably by country of origin: amid the top suppliers, the country with the highest price was Germany ($15,335 per ton), while China ($2,935 per ton) was amongst the lowest.
From 2013 to 2023, the most notable rate of growth in terms of prices was attained by France (+5.3%), while the other global leaders experienced more modest paces of growth.
This report provides an in-depth analysis of the global herbicide market. Within it, you will discover the latest data on market trends and opportunities by country, consumption, production and price developments, as well as the global trade (imports and exports). The forecast exhibits the market prospects through 2030.
Product coverage:
- Prodcom 20201220 - Herbicides based on phenoxy-phytohormone products, put up in forms or packings for retail sale or as preparations or articles
- Prodcom 20201230 - Herbicides based on triazines, put up in forms or packings for retail sale or as preparations or articles
- Prodcom 20201240 - Herbicides based on amides, put up in forms or packings for retail sale or as preparations or articles
- Prodcom 20201250 - Herbicides based on carbamates, put up in forms or packings for retail sale or as preparations or articles
- Prodcom 20201260 - Herbicides based on dinitroanilines derivatives, put up in forms or packings for retail sale or as preparations or articles
- Prodcom 20201270 - Herbicides based on urea, uracil and sulphonylurea, put up in forms or packings for retail sale or as preparations or articles
- Prodcom 20201290 - Herbicides p.r.s. or as preparations/articles excluding based on phenoxy-phytohormones, triazines, amides, carbamates, d initroanaline derivatives, urea, uracil, sulphonylurea
- Prodcom 20201350 - Anti-sprouting products put up in forms or packings for retail sale or as preparations or articles
- Prodcom 20201370 - Plant-growth regulators put up in forms or packings for retail sale or as preparations or articles
Country coverage:
Worldwide - the report contains statistical data for 200 countries and includes detailed profiles of the 50 largest consuming countries:
- USA
- China
- Japan
- Germany
- United Kingdom
- France
- Brazil
- Italy
- Russian Federation
- India
- Canada
- Australia
- Republic of Korea
- Spain
- Mexico
- Indonesia
- Netherlands
- Turkey
- Saudi Arabia
- Switzerland
- Sweden
- Nigeria
- Poland
- Belgium
- Argentina
- Norway
- Austria
- Thailand
- United Arab Emirates
- Colombia
- Denmark
- South Africa
- Malaysia
- Israel
- Singapore
- Egypt
- Philippines
- Finland
- Chile
- Ireland
- Pakistan
- Greece
- Portugal
- Kazakhstan
- Algeria
- Czech Republic
- Qatar
- Peru
- Romania
- Vietnam
+ the largest producing countries
Data coverage:
- Global market volume and value
- Per Capita consumption
- Forecast of the market dynamics in the medium term
- Global production, split by region and country
- Global trade (exports and imports)
- Export and import prices
- Market trends, drivers and restraints
- Key market players and their profiles
Company coverage:
Reasons to buy this report:
- Take advantage of the latest data
- Find deeper insights into current market developments
- Discover vital success factors affecting the market
This report is designed for manufacturers, distributors, importers, and wholesalers, as well as for investors, consultants and advisors.
In this report, you can find information that helps you to make informed decisions on the following issues:
- How to diversify your business and benefit from new market opportunities
- How to load your idle production capacity
- How to boost your sales on overseas markets
- How to increase your profit margins
- How to make your supply chain more sustainable
- How to reduce your production and supply chain costs
- How to outsource production to other countries
- How to prepare your business for global expansion
While doing this research, we combine the accumulated expertise of our analysts and the capabilities of artificial intelligence. The AI-based platform, developed by our data scientists, constitutes the key working tool for business analysts, empowering them to discover deep insights and ideas from the marketing data.
-
1. INTRODUCTION
Making Data-Driven Decisions to Grow Your Business
- REPORT DESCRIPTION
- RESEARCH METHODOLOGY AND AI PLATFORM
- DATA-DRIVEN DECISIONS FOR YOUR BUSINESS
- GLOSSARY AND SPECIFIC TERMS
-
2. EXECUTIVE SUMMARY
A Quick Overview of Market Performance
- KEY FINDINGS
- MARKET TRENDS This Chapter is Available Only for the Professional Edition PRO
-
3. MARKET OVERVIEW
Understanding the Current State of The Market and Its Prospects
- MARKET SIZE
- CONSUMPTION BY COUNTRY
- MARKET FORECAST TO 2030
-
4. MOST PROMISING PRODUCT
Finding New Products to Diversify Your Business
This Chapter is Available Only for the Professional Edition PRO- TOP PRODUCTS TO DIVERSIFY YOUR BUSINESS
- BEST-SELLING PRODUCTS
- MOST CONSUMED PRODUCT
- MOST TRADED PRODUCT
- MOST PROFITABLE PRODUCT FOR EXPORT
-
5. MOST PROMISING SUPPLYING COUNTRIES
Choosing the Best Countries to Establish Your Sustainable Supply Chain
This Chapter is Available Only for the Professional Edition PRO- TOP COUNTRIES TO SOURCE YOUR PRODUCT
- TOP PRODUCING COUNTRIES
- TOP EXPORTING COUNTRIES
- LOW-COST EXPORTING COUNTRIES
-
6. MOST PROMISING OVERSEAS MARKETS
Choosing the Best Countries to Boost Your Exports
This Chapter is Available Only for the Professional Edition PRO- TOP OVERSEAS MARKETS FOR EXPORTING YOUR PRODUCT
- TOP CONSUMING MARKETS
- UNSATURATED MARKETS
- TOP IMPORTING MARKETS
- MOST PROFITABLE MARKETS
7. GLOBAL PRODUCTION
The Latest Trends and Insights into The Industry
- PRODUCTION VOLUME AND VALUE
- PRODUCTION BY COUNTRY
8. GLOBAL IMPORTS
The Largest Importers on The Market and How They Succeed
- IMPORTS FROM 2012–2023
- IMPORTS BY COUNTRY
- IMPORT PRICES BY COUNTRY
9. GLOBAL EXPORTS
The Largest Exporters on The Market and How They Succeed
- EXPORTS FROM 2012–2023
- EXPORTS BY COUNTRY
- EXPORT PRICES BY COUNTRY
-
10. PROFILES OF MAJOR PRODUCERS
The Largest Producers on The Market and Their Profiles
This Chapter is Available Only for the Professional Edition PRO -
11. COUNTRY PROFILES
The Largest Markets And Their Profiles
This Chapter is Available Only for the Professional Edition PRO- United States
- China
- Japan
- Germany
- United Kingdom
- France
- Brazil
- Italy
- Russian Federation
- India
- Canada
- Australia
- Republic of Korea
- Spain
- Mexico
- Indonesia
- Netherlands
- Turkey
- Saudi Arabia
- Switzerland
- Sweden
- Nigeria
- Poland
- Belgium
- Argentina
- Norway
- Austria
- Thailand
- United Arab Emirates
- Colombia
- Denmark
- South Africa
- Malaysia
- Israel
- Singapore
- Egypt
- Philippines
- Finland
- Chile
- Ireland
- Pakistan
- Greece
- Portugal
- Kazakhstan
- Algeria
- Czech Republic
- Qatar
- Peru
- Romania
- Vietnam
-
LIST OF TABLES
- Key Findings In 2023
- Market Volume, In Physical Terms, 2012–2023
- Market Value, 2012–2023
- Per Capita Consumption, By Country, 2018–2023
- Production, In Physical Terms, By Country, 2012–2023
- Imports, In Physical Terms, By Country, 2012–2023
- Imports, In Value Terms, By Country, 2012–2023
- Import Prices, By Country Of Destination, 2012–2023
- Exports, In Physical Terms, By Country, 2012–2023
- Exports, In Value Terms, By Country, 2012–2023
- Export Prices, By Country Of Origin, 2012–2023
-
LIST OF FIGURES
- Market Volume, In Physical Terms, 2012–2023
- Market Value, 2012–2023
- Consumption, By Country, 2023
- Market Volume Forecast to 2030
- Market Value Forecast to 2030
- Products: Market Size And Growth, By Type
- Products: Average Per Capita Consumption, By Type
- Products: Exports And Growth, By Type
- Products: Export Prices And Growth, By Type
- Production Volume And Growth
- Exports And Growth
- Export Prices And Growth
- Market Size And Growth
- Per Capita Consumption
- Imports And Growth
- Import Prices
- Production, In Physical Terms, 2012–2023
- Production, In Value Terms, 2012–2023
- Production, By Country, 2023
- Production, In Physical Terms, By Country, 2012–2023
- Imports, In Physical Terms, 2012–2023
- Imports, In Value Terms, 2012–2023
- Imports, In Physical Terms, By Country, 2023
- Imports, In Physical Terms, By Country, 2012–2023
- Imports, In Value Terms, By Country, 2012–2023
- Import Prices, By Country, 2012–2023
- Exports, In Physical Terms, 2012–2023
- Exports, In Value Terms, 2012–2023
- Exports, In Physical Terms, By Country, 2023
- Exports, In Physical Terms, By Country, 2012–2023
- Exports, In Value Terms, By Country, 2012–2023
- Export Prices, 2012–2023


