
China - Herbicides - Market Analysis, Forecast, Size, Trends and Insights
Get instant access to more than 2 million reports, dashboards, and datasets on the IndexBox Platform.
View PricingChina's 2023 Herbicide Exports Drop by 38% to $4.8 Billion
China Herbicide Exports
In 2023, overseas shipments of herbicides increased by 0.1% to 1.6M tons, rising for the fourth year in a row after two years of decline. Overall, exports enjoyed a strong increase. The growth pace was the most rapid in 2017 when exports increased by 40% against the previous year. Over the period under review, the exports attained the peak figure in 2023 and are expected to retain growth in years to come.
In value terms, herbicide exports fell markedly to $4.8B (IndexBox estimates) in 2023. In general, exports saw a strong increase. The pace of growth appeared the most rapid in 2022 with an increase of 61% against the previous year. As a result, the exports reached the peak of $7.8B, and then contracted rapidly in the following year.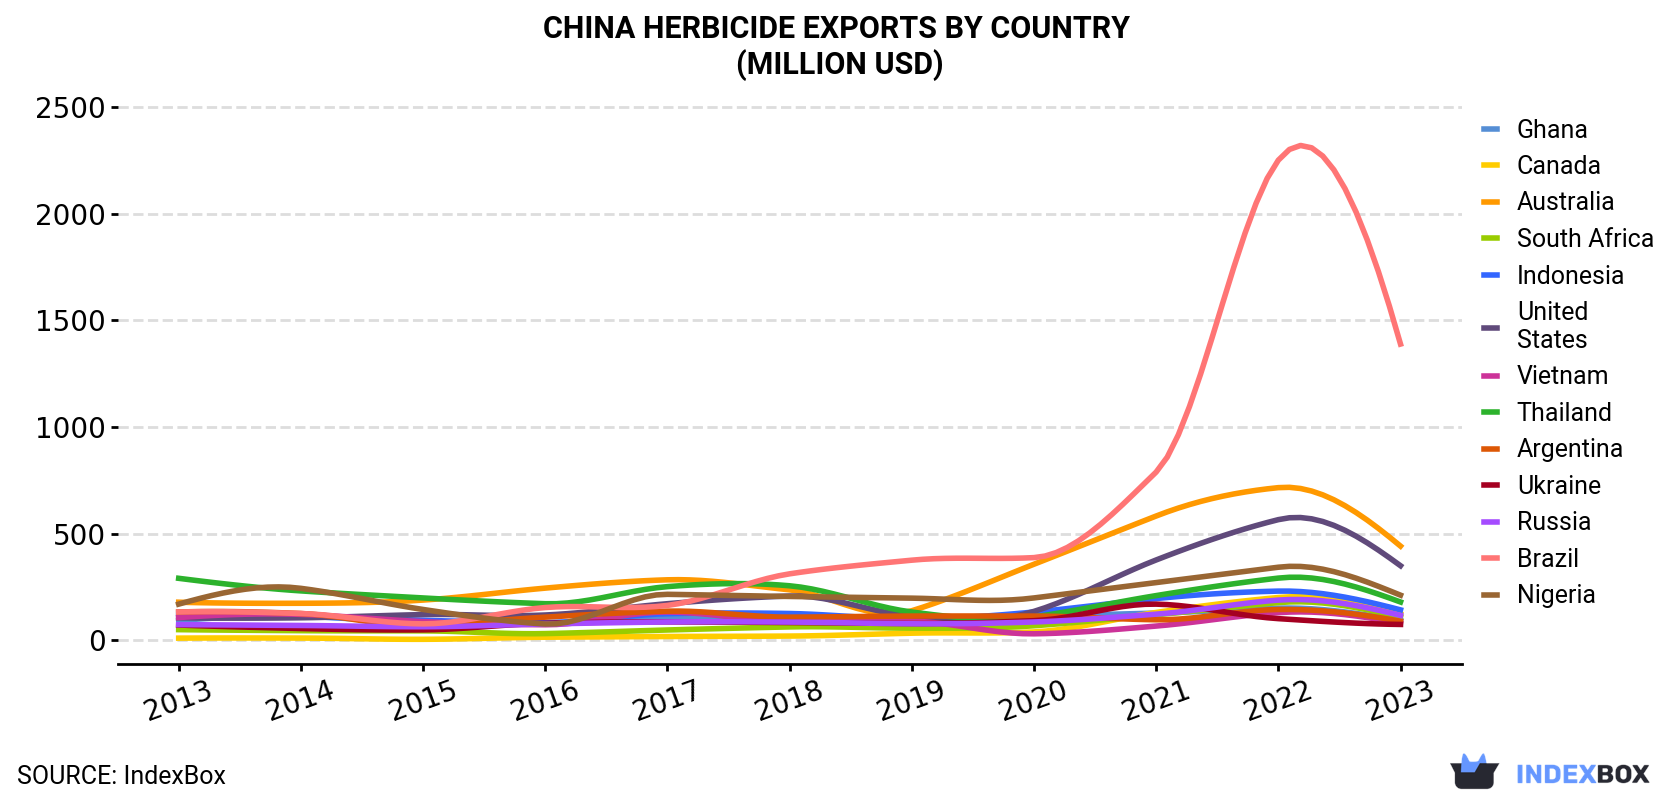
| COUNTRY | Export Value of Herbicide in China (million USD) | ||||||||||
|---|---|---|---|---|---|---|---|---|---|---|---|
| 2013 | 2014 | 2015 | 2016 | 2017 | 2018 | 2019 | 2020 | 2021 | 2022 | 2023 | |
| Brazil | 132 | 125 | 76.5 | 153 | 163 | 311 | 375 | 387 | 788 | 2,250 | 1,388 |
| Australia | 178 | 173 | 188 | 244 | 283 | 236 | 138 | 356 | 582 | 715 | 441 |
| United States | 105 | 105 | 120 | 118 | 171 | 207 | 112 | 135 | 376 | 565 | 349 |
| Nigeria | 169 | 243 | 144 | 75.8 | 215 | 205 | 197 | 198 | 270 | 342 | 211 |
| Thailand | 290 | 231 | 198 | 171 | 251 | 255 | 132 | 109 | 209 | 291 | 179 |
| Indonesia | 128 | 111 | 93.4 | 83.0 | 124 | 125 | 99.7 | 132 | 195 | 230 | 142 |
| Canada | 9.6 | 9.9 | 4.1 | 13.9 | 17.2 | 19.3 | 32.8 | 38.8 | 130 | 200 | 123 |
| Russia | 72.8 | 68.9 | 63.0 | 76.1 | 85.3 | 84.9 | 76.9 | 85.4 | 122 | 188 | 116 |
| South Africa | 49.4 | 44.6 | 43.7 | 30.9 | 47.8 | 62.2 | 56.4 | 67.6 | 119 | 176 | 109 |
| Ghana | 92.3 | 112 | 81.6 | 80.7 | 101 | 109 | 91.8 | 112 | 127 | 150 | 92.3 |
| Argentina | 132 | 125 | 69.3 | 108 | 136 | 108 | 113 | 113 | 95.7 | 144 | 88.7 |
| Vietnam | 106 | 121 | 87.1 | 72.3 | 132 | 85.9 | 89.8 | 29.9 | 66.2 | 129 | 79.4 |
| Ukraine | 71.1 | 54.6 | 48.4 | 79.3 | 85.9 | 82.7 | 77.8 | 91.4 | 169 | 101 | 73.8 |
| Others | 877 | 1,076 | 925 | 843 | 1,081 | 1,228 | 1,172 | 1,269 | 1,606 | 2,338 | 1,450 |
| Total | 2,410 | 2,600 | 2,142 | 2,147 | 2,892 | 3,120 | 2,764 | 3,124 | 4,855 | 7,818 | 4,842 |
Exports by Country
Brazil (310K tons), Australia (168K tons) and the United States (117K tons) were the main destinations of herbicide exports from China, with a combined 36% share of total exports. Nigeria, Thailand, Indonesia, Ghana, Argentina, Canada, South Africa, Russia, Ukraine and Vietnam lagged somewhat behind, together comprising a further 31%.
From 2013 to 2023, the biggest increases were recorded for Canada (with a CAGR of +27.4%), while shipments for the other leaders experienced more modest paces of growth.
In value terms, Brazil ($1.4B) remains the key foreign market for herbicides exports from China, comprising 29% of total exports. The second position in the ranking was taken by Australia ($441M), with a 9.1% share of total exports. It was followed by the United States, with a 7.2% share.
From 2013 to 2023, the average annual rate of growth in terms of value to Brazil amounted to +26.5%. Exports to the other major destinations recorded the following average annual rates of exports growth: Australia (+9.5% per year) and the United States (+12.8% per year).
Export Prices by Country
In 2023, the herbicide price stood at $2,935 per ton (FOB, China), which is down by -38.1% against the previous year. In general, the export price saw a relatively flat trend pattern. The most prominent rate of growth was recorded in 2021 an increase of 40%. Over the period under review, the average export prices attained the peak figure at $4,743 per ton in 2022, and then dropped markedly in the following year.
Prices varied noticeably by country of destination: amid the top suppliers, the country with the highest price was Brazil ($4,478 per ton), while the average price for exports to Ghana ($1,762 per ton) was amongst the lowest.
From 2013 to 2023, the most notable rate of growth in terms of prices was recorded for supplies to Brazil (+2.7%), while the prices for the other major destinations experienced more modest paces of growth.
This report provides an in-depth analysis of the herbicide market in China. Within it, you will discover the latest data on market trends and opportunities by country, consumption, production and price developments, as well as the global trade (imports and exports). The forecast exhibits the market prospects through 2030.
Product coverage:
- Prodcom 20201220 - Herbicides based on phenoxy-phytohormone products, put up in forms or packings for retail sale or as preparations or articles
- Prodcom 20201230 - Herbicides based on triazines, put up in forms or packings for retail sale or as preparations or articles
- Prodcom 20201240 - Herbicides based on amides, put up in forms or packings for retail sale or as preparations or articles
- Prodcom 20201250 - Herbicides based on carbamates, put up in forms or packings for retail sale or as preparations or articles
- Prodcom 20201260 - Herbicides based on dinitroanilines derivatives, put up in forms or packings for retail sale or as preparations or articles
- Prodcom 20201270 - Herbicides based on urea, uracil and sulphonylurea, put up in forms or packings for retail sale or as preparations or articles
- Prodcom 20201290 - Herbicides p.r.s. or as preparations/articles excluding based on phenoxy-phytohormones, triazines, amides, carbamates, d initroanaline derivatives, urea, uracil, sulphonylurea
- Prodcom 20201350 - Anti-sprouting products put up in forms or packings for retail sale or as preparations or articles
- Prodcom 20201370 - Plant-growth regulators put up in forms or packings for retail sale or as preparations or articles
Country coverage:
Data coverage:
- Market volume and value
- Per Capita consumption
- Forecast of the market dynamics in the medium term
- Trade (exports and imports) in China
- Export and import prices
- Market trends, drivers and restraints
- Key market players and their profiles
Reasons to buy this report:
- Take advantage of the latest data
- Find deeper insights into current market developments
- Discover vital success factors affecting the market
This report is designed for manufacturers, distributors, importers, and wholesalers, as well as for investors, consultants and advisors.
In this report, you can find information that helps you to make informed decisions on the following issues:
- How to diversify your business and benefit from new market opportunities
- How to load your idle production capacity
- How to boost your sales on overseas markets
- How to increase your profit margins
- How to make your supply chain more sustainable
- How to reduce your production and supply chain costs
- How to outsource production to other countries
- How to prepare your business for global expansion
While doing this research, we combine the accumulated expertise of our analysts and the capabilities of artificial intelligence. The AI-based platform, developed by our data scientists, constitutes the key working tool for business analysts, empowering them to discover deep insights and ideas from the marketing data.
-
1. INTRODUCTION
Making Data-Driven Decisions to Grow Your Business
- REPORT DESCRIPTION
- RESEARCH METHODOLOGY AND AI PLATFORM
- DATA-DRIVEN DECISIONS FOR YOUR BUSINESS
- GLOSSARY AND SPECIFIC TERMS
-
2. EXECUTIVE SUMMARY
A Quick Overview of Market Performance
- KEY FINDINGS
- MARKET TRENDS This Chapter is Available Only for the Professional Edition PRO
-
3. MARKET OVERVIEW
Understanding the Current State of The Market and Its Prospects
- MARKET SIZE
- MARKET STRUCTURE
- TRADE BALANCE
- PER CAPITA CONSUMPTION
- MARKET FORECAST TO 2030
-
4. MOST PROMISING PRODUCT
Finding New Products to Diversify Your Business
This Chapter is Available Only for the Professional Edition PRO- TOP PRODUCTS TO DIVERSIFY YOUR BUSINESS
- BEST-SELLING PRODUCTS
- MOST CONSUMED PRODUCT
- MOST TRADED PRODUCT
- MOST PROFITABLE PRODUCT FOR EXPORT
-
5. MOST PROMISING SUPPLYING COUNTRIES
Choosing the Best Countries to Establish Your Sustainable Supply Chain
This Chapter is Available Only for the Professional Edition PRO- TOP COUNTRIES TO SOURCE YOUR PRODUCT
- TOP PRODUCING COUNTRIES
- TOP EXPORTING COUNTRIES
- LOW-COST EXPORTING COUNTRIES
-
6. MOST PROMISING OVERSEAS MARKETS
Choosing the Best Countries to Boost Your Exports
This Chapter is Available Only for the Professional Edition PRO- TOP OVERSEAS MARKETS FOR EXPORTING YOUR PRODUCT
- TOP CONSUMING MARKETS
- UNSATURATED MARKETS
- TOP IMPORTING MARKETS
- MOST PROFITABLE MARKETS
7. PRODUCTION
The Latest Trends and Insights into The Industry
- PRODUCTION VOLUME AND VALUE
8. IMPORTS
The Largest Import Supplying Countries
- IMPORTS FROM 2012–2023
- IMPORTS BY COUNTRY
- IMPORT PRICES BY COUNTRY
9. EXPORTS
The Largest Destinations for Exports
- EXPORTS FROM 2012–2023
- EXPORTS BY COUNTRY
- EXPORT PRICES BY COUNTRY
-
10. PROFILES OF MAJOR PRODUCERS
The Largest Producers on The Market and Their Profiles
This Chapter is Available Only for the Professional Edition PRO -
LIST OF TABLES
- Key Findings In 2023
- Market Volume, In Physical Terms, 2012–2023
- Market Value, 2012–2023
- Per Capita Consumption In 2012-2023
- Imports, In Physical Terms, By Country, 2012–2023
- Imports, In Value Terms, By Country, 2012–2023
- Import Prices, By Country Of Origin, 2012–2023
- Exports, In Physical Terms, By Country, 2012–2023
- Exports, In Value Terms, By Country, 2012–2023
- Export Prices, By Country Of Destination, 2012–2023
-
LIST OF FIGURES
- Market Volume, In Physical Terms, 2012–2023
- Market Value, 2012–2023
- Market Structure – Domestic Supply vs. Imports, In Physical Terms, 2012-2023
- Market Structure – Domestic Supply vs. Imports, In Value Terms, 2012-2023
- Trade Balance, In Physical Terms, 2012-2023
- Trade Balance, In Value Terms, 2012-2023
- Per Capita Consumption, 2012-2023
- Market Volume Forecast to 2030
- Market Value Forecast to 2030
- Products: Market Size And Growth, By Type
- Products: Average Per Capita Consumption, By Type
- Products: Exports And Growth, By Type
- Products: Export Prices And Growth, By Type
- Production Volume And Growth
- Exports And Growth
- Export Prices And Growth
- Market Size And Growth
- Per Capita Consumption
- Imports And Growth
- Import Prices
- Production, In Physical Terms, 2012–2023
- Production, In Value Terms, 2012–2023
- Imports, In Physical Terms, 2012–2023
- Imports, In Value Terms, 2012–2023
- Imports, In Physical Terms, By Country, 2023
- Imports, In Physical Terms, By Country, 2012–2023
- Imports, In Value Terms, By Country, 2012–2023
- Import Prices, By Country Of Origin, 2012–2023
- Exports, In Physical Terms, 2012–2023
- Exports, In Value Terms, 2012–2023
- Exports, In Physical Terms, By Country, 2023
- Exports, In Physical Terms, By Country, 2012–2023
- Exports, In Value Terms, By Country, 2012–2023
- Export Prices, By Country Of Destination, 2012–2023


