
Germany - Motorcycles and Bicycles - Market Analysis, Forecast, Size, Trends And Insights
Get instant access to more than 2 million reports, dashboards, and datasets on the IndexBox Platform.
View PricingDecline in Motorcycle and Bicycle Imports From Germany to $61M in October 2023
Germany Motorcycle And Bicycle Imports
Motorcycle and bicycle imports into Germany contracted markedly to 73K units in October 2023, waning by -70.6% against September 2023 figures. In general, imports saw a deep contraction. The most prominent rate of growth was recorded in March 2023 with an increase of 27% m-o-m. Imports peaked at 419K units in October 2022; however, from November 2022 to October 2023, imports failed to regain momentum.
In value terms, motorcycle and bicycle imports contracted markedly to $61M (IndexBox estimates) in October 2023. Overall, imports continue to indicate a drastic downturn. The most prominent rate of growth was recorded in March 2023 with an increase of 21% against the previous month. Over the period under review, imports reached the maximum at 512M units in June 2023; however, from July 2023 to October 2023, imports remained at a lower figure.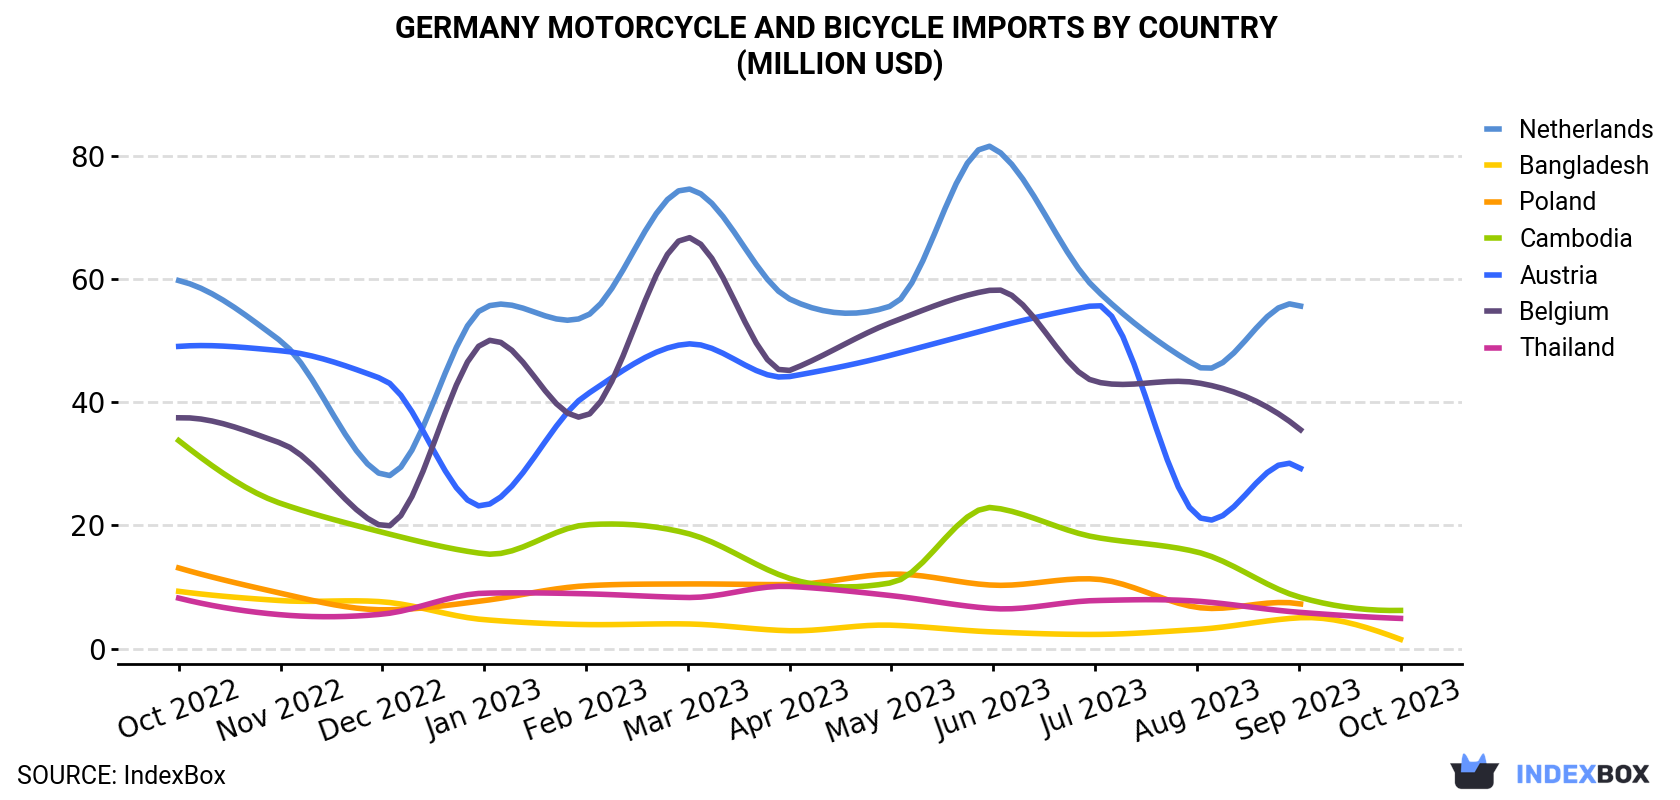
| COUNTRY | Import Value of Motorcycle And Bicycle in Germany (million USD) | ||||||||||||
|---|---|---|---|---|---|---|---|---|---|---|---|---|---|
| Oct 2022 | Nov 2022 | Dec 2022 | Jan 2023 | Feb 2023 | Mar 2023 | Apr 2023 | May 2023 | Jun 2023 | Jul 2023 | Aug 2023 | Sep 2023 | Oct 2023 | |
| Cambodia | 33.8 | 23.6 | 18.9 | 15.4 | 20.1 | 18.7 | 11.4 | 10.7 | 22.9 | 18.1 | 15.7 | 8.4 | 6.2 |
| Thailand | 8.2 | 5.5 | 5.6 | 9.0 | 8.9 | 8.3 | 10.1 | 8.6 | 6.5 | 7.8 | 7.7 | 5.9 | 4.9 |
| Bangladesh | 9.3 | 7.8 | 7.6 | 4.7 | 3.9 | 4.0 | 2.9 | 3.8 | 2.7 | 2.3 | 3.1 | 5.0 | 1.5 |
| Netherlands | 59.8 | 50.0 | 28.2 | 55.4 | 54.0 | 74.7 | 56.8 | 55.7 | 81.4 | 58.5 | 45.9 | 55.8 | N/A |
| Poland | 13.1 | 9.0 | 6.3 | 7.8 | 10.2 | 10.5 | 10.4 | 12.1 | 10.3 | 11.3 | 6.7 | 7.3 | N/A |
| Austria | 49.1 | 48.4 | 43.8 | 23.2 | 41.2 | 49.5 | 44.2 | 47.7 | 52.1 | 55.8 | 21.6 | 29.5 | N/A |
| Belgium | 37.5 | 33.4 | 19.9 | 49.8 | 37.8 | 66.8 | 45.2 | 53.0 | 58.3 | 43.4 | 43.2 | 35.8 | N/A |
| Others | 219 | 227 | 169 | 178 | 199 | 222 | 241 | 264 | 278 | 236 | 184 | 204 | 48.2 |
| Total | 430 | 405 | 300 | 343 | 375 | 454 | 422 | 455 | 512 | 433 | 328 | 352 | 60.7 |
Imports by Country
In October 2023, Cambodia (17K units) constituted the largest motorcycle and bicycle supplier to Germany, with a 24% share of total imports. Moreover, motorcycle and bicycle imports from Cambodia exceeded the figures recorded by the second-largest supplier, Bangladesh (8.5K units), twofold.
From October 2022 to October 2023, the average monthly growth rate of volume from Cambodia stood at -14.1%. The remaining supplying countries recorded the following average monthly rates of imports growth: Bangladesh (-11.9% per month) and Thailand (-11.0% per month).
In value terms, Cambodia ($6.2M), Thailand ($4.9M) and Bangladesh ($1.5M) appeared to be the largest motorcycle and bicycle suppliers to Germany, with a combined 21% share of total imports.
In terms of the main suppliers, Thailand, with a CAGR of -4.2%, saw the highest growth rate of the value of imports, over the period under review, while purchases for the other leaders experienced a decline.
Imports by Type
In October 2023, bicycles and other cycles (60K units) constituted the largest type of motorcycle and bicycle supplied to Germany, with a 82% share of total imports. Moreover, bicycles and other cycles exceeded the figures recorded for the second-largest type, motorcycles (including mopeds) and cycles; fitted with an auxiliary motor, with or without side-cars; side-cars (13K units), fivefold.
From October 2022 to October 2023, the average monthly rate of growth in terms of the volume of import of bicycles and other cycles totaled -13.9%.
In value terms, motorcycles (including mopeds) and cycles; fitted with an auxiliary motor, with or without side-cars; side-cars ($44M) constituted the largest type of motorcycle and bicycle supplied to Germany, comprising 73% of total imports. The second position in the ranking was held by bicycles and other cycles ($16M), with a 27% share of total imports.
Import Prices by Country
In October 2023, the motorcycle and bicycle price amounted to $834 per unit (CIF, Germany), reducing by -41.3% against the previous month. In general, the import price showed a slight curtailment. The most prominent rate of growth was recorded in February 2023 an increase of 26% m-o-m. The import price peaked at $1,570 per unit in July 2023; however, from August 2023 to October 2023, import prices failed to regain momentum.
There were significant differences in the average prices amongst the major supplying countries. In October 2023, the country with the highest price was Vietnam ($3,302 per unit), while the price for Turkey ($169 per unit) was amongst the lowest.
From October 2022 to October 2023, the most notable rate of growth in terms of prices was attained by Thailand (+7.6%), while the prices for the other major suppliers experienced more modest paces of growth.
This report provides an in-depth analysis of the motorcycle and bicycle market in Germany. Within it, you will discover the latest data on market trends and opportunities by country, consumption, production and price developments, as well as the global trade (imports and exports). The forecast exhibits the market prospects through 2030.
Product coverage:
- Prodcom 30911100 - Motorcycles, and cycles fitted with an auxiliary motor, with an engine capacity . .50 cm.
- Prodcom 30911200 - Motorcycles with reciprocating internal combustion piston engine > .50 cm.
- Prodcom 30911300 - Side cars for motorcycles, cycles with auxiliary motors other than reciprocating internal combustion piston engine
- Prodcom 30921000 - Bicycles and other cycles (including delivery tricycles), nonmotorised
Country coverage:
- Germany
Data coverage:
- Market volume and value
- Per Capita consumption
- Forecast of the market dynamics in the medium term
- Trade (exports and imports) in Germany
- Export and import prices
- Market trends, drivers and restraints
- Key market players and their profiles
Reasons to buy this report:
- Take advantage of the latest data
- Find deeper insights into current market developments
- Discover vital success factors affecting the market
This report is designed for manufacturers, distributors, importers, and wholesalers, as well as for investors, consultants and advisors.
In this report, you can find information that helps you to make informed decisions on the following issues:
- How to diversify your business and benefit from new market opportunities
- How to load your idle production capacity
- How to boost your sales on overseas markets
- How to increase your profit margins
- How to make your supply chain more sustainable
- How to reduce your production and supply chain costs
- How to outsource production to other countries
- How to prepare your business for global expansion
While doing this research, we combine the accumulated expertise of our analysts and the capabilities of artificial intelligence. The AI-based platform, developed by our data scientists, constitutes the key working tool for business analysts, empowering them to discover deep insights and ideas from the marketing data.
-
1. INTRODUCTION
Making Data-Driven Decisions to Grow Your Business
- REPORT DESCRIPTION
- RESEARCH METHODOLOGY AND AI PLATFORM
- DATA-DRIVEN DECISIONS FOR YOUR BUSINESS
- GLOSSARY AND SPECIFIC TERMS
-
2. EXECUTIVE SUMMARY
A Quick Overview of Market Performance
- KEY FINDINGS
- MARKET TRENDS This Chapter is Available Only for the Professional Edition PRO
-
3. MARKET OVERVIEW
Understanding the Current State of The Market and Its Prospects
- MARKET SIZE
- MARKET STRUCTURE
- TRADE BALANCE
- PER CAPITA CONSUMPTION
- MARKET FORECAST TO 2030
-
4. MOST PROMISING PRODUCT
Finding New Products to Diversify Your Business
This Chapter is Available Only for the Professional Edition PRO- TOP PRODUCTS TO DIVERSIFY YOUR BUSINESS
- BEST-SELLING PRODUCTS
- MOST CONSUMED PRODUCT
- MOST TRADED PRODUCT
- MOST PROFITABLE PRODUCT FOR EXPORT
-
5. MOST PROMISING SUPPLYING COUNTRIES
Choosing the Best Countries to Establish Your Sustainable Supply Chain
This Chapter is Available Only for the Professional Edition PRO- TOP COUNTRIES TO SOURCE YOUR PRODUCT
- TOP PRODUCING COUNTRIES
- TOP EXPORTING COUNTRIES
- LOW-COST EXPORTING COUNTRIES
-
6. MOST PROMISING OVERSEAS MARKETS
Choosing the Best Countries to Boost Your Exports
This Chapter is Available Only for the Professional Edition PRO- TOP OVERSEAS MARKETS FOR EXPORTING YOUR PRODUCT
- TOP CONSUMING MARKETS
- UNSATURATED MARKETS
- TOP IMPORTING MARKETS
- MOST PROFITABLE MARKETS
7. PRODUCTION
The Latest Trends and Insights into The Industry
- PRODUCTION VOLUME AND VALUE
8. IMPORTS
The Largest Import Supplying Countries
- IMPORTS FROM 2012–2023
- IMPORTS BY COUNTRY
- IMPORT PRICES BY COUNTRY
9. EXPORTS
The Largest Destinations for Exports
- EXPORTS FROM 2012–2023
- EXPORTS BY COUNTRY
- EXPORT PRICES BY COUNTRY
-
10. PROFILES OF MAJOR PRODUCERS
The Largest Producers on The Market and Their Profiles
This Chapter is Available Only for the Professional Edition PRO -
LIST OF TABLES
- Key Findings In 2023
- Market Volume, In Physical Terms, 2012–2023
- Market Value, 2012–2023
- Per Capita Consumption In 2012-2023
- Imports, In Physical Terms, By Country, 2012–2023
- Imports, In Value Terms, By Country, 2012–2023
- Import Prices, By Country Of Origin, 2012–2023
- Exports, In Physical Terms, By Country, 2012–2023
- Exports, In Value Terms, By Country, 2012–2023
- Export Prices, By Country Of Destination, 2012–2023
-
LIST OF FIGURES
- Market Volume, In Physical Terms, 2012–2023
- Market Value, 2012–2023
- Market Structure – Domestic Supply vs. Imports, In Physical Terms, 2012-2023
- Market Structure – Domestic Supply vs. Imports, In Value Terms, 2012-2023
- Trade Balance, In Physical Terms, 2012-2023
- Trade Balance, In Value Terms, 2012-2023
- Per Capita Consumption, 2012-2023
- Market Volume Forecast to 2030
- Market Value Forecast to 2030
- Products: Market Size And Growth, By Type
- Products: Average Per Capita Consumption, By Type
- Products: Exports And Growth, By Type
- Products: Export Prices And Growth, By Type
- Production Volume And Growth
- Exports And Growth
- Export Prices And Growth
- Market Size And Growth
- Per Capita Consumption
- Imports And Growth
- Import Prices
- Production, In Physical Terms, 2012–2023
- Production, In Value Terms, 2012–2023
- Imports, In Physical Terms, 2012–2023
- Imports, In Value Terms, 2012–2023
- Imports, In Physical Terms, By Country, 2023
- Imports, In Physical Terms, By Country, 2012–2023
- Imports, In Value Terms, By Country, 2012–2023
- Import Prices, By Country Of Origin, 2012–2023
- Exports, In Physical Terms, 2012–2023
- Exports, In Value Terms, 2012–2023
- Exports, In Physical Terms, By Country, 2023
- Exports, In Physical Terms, By Country, 2012–2023
- Exports, In Value Terms, By Country, 2012–2023
- Export Prices, By Country Of Destination, 2012–2023


