
France - Crude Rape, Colza Or Mustard Oil - Market Analysis, Forecast, Size, Trends And Insights
Get instant access to more than 2 million reports, dashboards, and datasets on the IndexBox Platform.
View PricingAverage Price of Rapeseed Oil in France Reaches $1,055 per Ton
France Crude Rapeseed Oil Export Price in June 2023
In June 2023, the crude rapeseed oil price stood at $1,055 per ton, therefore (FOB, France), remained relatively stable against the previous month. Over the period under review, the export price continues to indicate a deep slump. The most prominent rate of growth was recorded in February 2023 when the average export price increased by 4.4% against the previous month. The export price peaked at $1,983 per ton in June 2022; however, from July 2022 to June 2023, the export prices stood at a somewhat lower figure.
Average prices varied noticeably for the major external markets. In June 2023, the country with the highest price was Spain ($1,028 per ton), while the average price for exports to Germany ($845 per ton) was amongst the lowest.
From June 2022 to June 2023, the most notable rate of growth in terms of prices was recorded for supplies to Chile (0.0%), while the prices for the other major destinations experienced a decline.
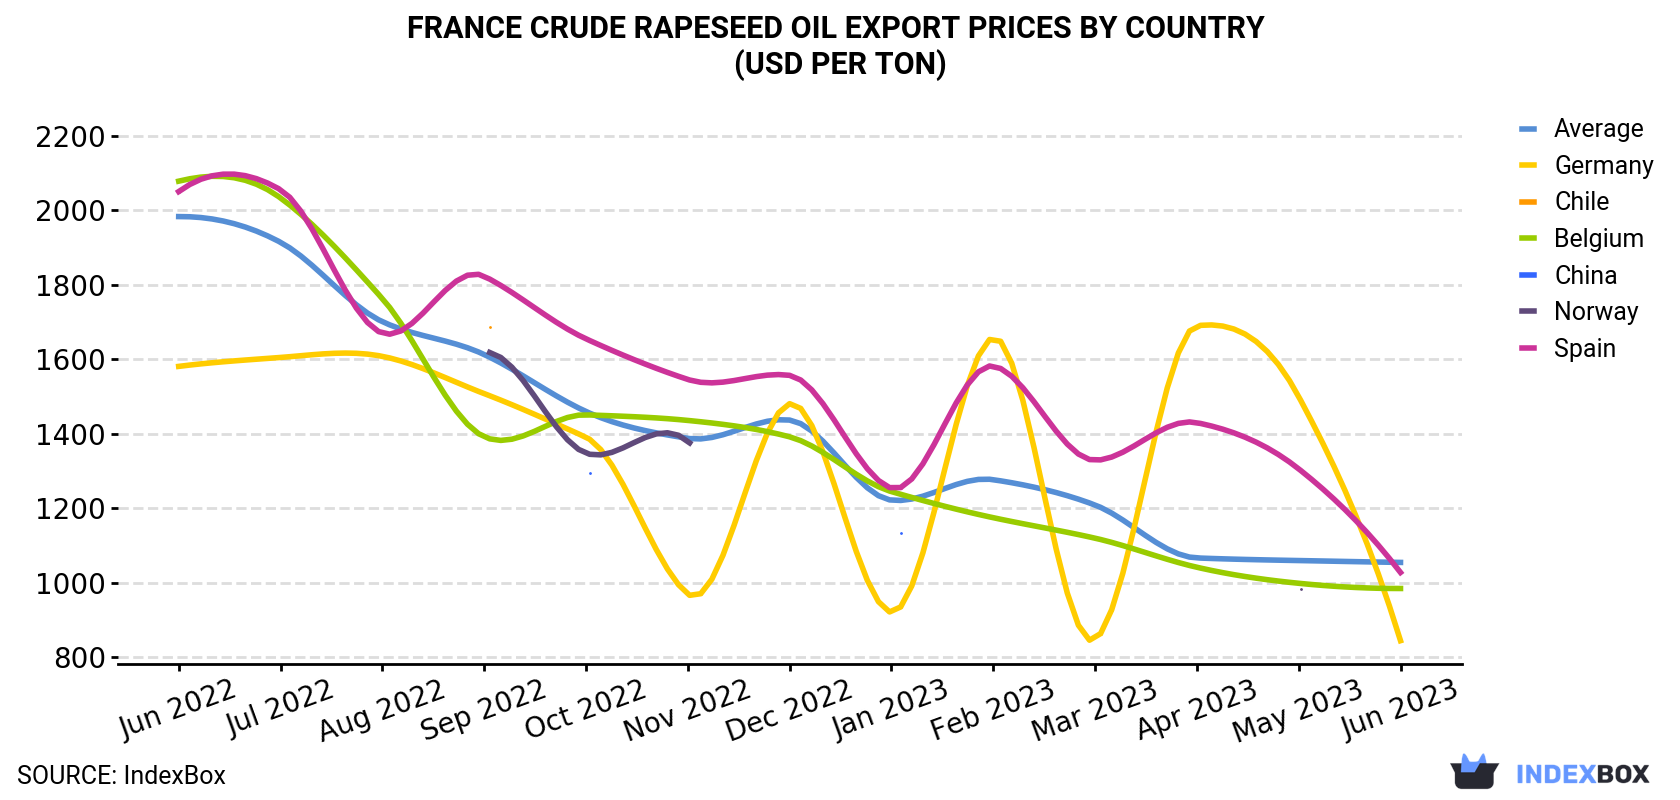
| COUNTRY | Export Price of Crude Rapeseed Oil in France (USD per ton) | ||||||||||||
|---|---|---|---|---|---|---|---|---|---|---|---|---|---|
| Jun 2022 | Jul 2022 | Aug 2022 | Sep 2022 | Oct 2022 | Nov 2022 | Dec 2022 | Jan 2023 | Feb 2023 | Mar 2023 | Apr 2023 | May 2023 | Jun 2023 | |
| Spain | 2,050 | 2,055 | 1,670 | 1,823 | 1,655 | 1,546 | 1,557 | 1,254 | 1,582 | 1,329 | 1,430 | 1,306 | 1,028 |
| Belgium | 2,078 | 2,033 | 1,763 | 1,392 | 1,451 | 1,436 | 1,392 | 1,245 | 1,175 | 1,120 | 1,042 | 999 | 985 |
| Germany | 1,581 | 1,605 | 1,608 | 1,508 | 1,391 | 970 | 1,481 | 921 | 1,658 | 848 | 1,690 | 1,500 | 845 |
| Chile | N/A | N/A | N/A | 1,702 | N/A | N/A | N/A | N/A | N/A | N/A | N/A | N/A | N/A |
| China | N/A | N/A | N/A | N/A | 1,299 | N/A | N/A | 1,161 | N/A | N/A | N/A | N/A | N/A |
| Norway | N/A | N/A | N/A | 1,619 | 1,348 | 1,381 | N/A | N/A | N/A | N/A | N/A | 979 | N/A |
| Average | 1,983 | 1,914 | 1,701 | 1,613 | 1,460 | 1,388 | 1,437 | 1,222 | 1,277 | 1,209 | 1,067 | 1,060 | 1,055 |
France Crude Rapeseed Oil Exports
In June 2023, crude rapeseed oil exports from France shrank markedly to 18K tons, with a decrease of -55.5% on the previous month's figure. Over the period under review, exports continue to indicate a deep downturn. The most prominent rate of growth was recorded in August 2022 with an increase of 94% m-o-m.
In value terms, crude rapeseed oil exports declined rapidly to $19M (IndexBox estimates) in June 2023. Overall, exports faced a abrupt curtailment. The most prominent rate of growth was recorded in December 2022 with an increase of 91% against the previous month.
France Crude Rapeseed Oil Exports by Country
Spain (5.7K tons), the Netherlands (4.5K tons) and Germany (4K tons) were the main destinations of crude rapeseed oil exports from France, together accounting for 81% of total exports.
From June 2022 to June 2023, the biggest increases were in the Netherlands (with a CAGR of +18.2%), while shipments for the other leaders experienced mixed trend patterns.
In value terms, the largest markets for crude rapeseed oil exported from France were the Netherlands ($5.9M), Spain ($5.9M) and Germany ($3.4M), with a combined 82% share of total exports.
the Netherlands, with a CAGR of +16.4%, saw the highest rates of growth with regard to the value of exports, among the main countries of destination over the period under review, while shipments for the other leaders experienced a decline.
This report provides an in-depth analysis of the crude rapeseed oil market in France. Within it, you will discover the latest data on market trends and opportunities by country, consumption, production and price developments, as well as the global trade (imports and exports). The forecast exhibits the market prospects through 2030.
Product coverage:
- FCL 271 - Oil of Rapeseed or Canola oil
Country coverage:
- France
Data coverage:
- Market volume and value
- Per Capita consumption
- Forecast of the market dynamics in the medium term
- Trade (exports and imports) in France
- Export and import prices
- Market trends, drivers and restraints
- Key market players and their profiles
Reasons to buy this report:
- Take advantage of the latest data
- Find deeper insights into current market developments
- Discover vital success factors affecting the market
This report is designed for manufacturers, distributors, importers, and wholesalers, as well as for investors, consultants and advisors.
In this report, you can find information that helps you to make informed decisions on the following issues:
- How to diversify your business and benefit from new market opportunities
- How to load your idle production capacity
- How to boost your sales on overseas markets
- How to increase your profit margins
- How to make your supply chain more sustainable
- How to reduce your production and supply chain costs
- How to outsource production to other countries
- How to prepare your business for global expansion
While doing this research, we combine the accumulated expertise of our analysts and the capabilities of artificial intelligence. The AI-based platform, developed by our data scientists, constitutes the key working tool for business analysts, empowering them to discover deep insights and ideas from the marketing data.
-
1. INTRODUCTION
Making Data-Driven Decisions to Grow Your Business
- REPORT DESCRIPTION
- RESEARCH METHODOLOGY AND AI PLATFORM
- DATA-DRIVEN DECISIONS FOR YOUR BUSINESS
- GLOSSARY AND SPECIFIC TERMS
-
2. EXECUTIVE SUMMARY
A Quick Overview of Market Performance
- KEY FINDINGS
- MARKET TRENDS This Chapter is Available Only for the Professional Edition PRO
-
3. MARKET OVERVIEW
Understanding the Current State of The Market and Its Prospects
- MARKET SIZE
- MARKET STRUCTURE
- TRADE BALANCE
- PER CAPITA CONSUMPTION
- MARKET FORECAST TO 2030
-
4. MOST PROMISING PRODUCT
Finding New Products to Diversify Your Business
This Chapter is Available Only for the Professional Edition PRO- TOP PRODUCTS TO DIVERSIFY YOUR BUSINESS
- BEST-SELLING PRODUCTS
- MOST CONSUMED PRODUCT
- MOST TRADED PRODUCT
- MOST PROFITABLE PRODUCT FOR EXPORT
-
5. MOST PROMISING SUPPLYING COUNTRIES
Choosing the Best Countries to Establish Your Sustainable Supply Chain
This Chapter is Available Only for the Professional Edition PRO- TOP COUNTRIES TO SOURCE YOUR PRODUCT
- TOP PRODUCING COUNTRIES
- TOP EXPORTING COUNTRIES
- LOW-COST EXPORTING COUNTRIES
-
6. MOST PROMISING OVERSEAS MARKETS
Choosing the Best Countries to Boost Your Exports
This Chapter is Available Only for the Professional Edition PRO- TOP OVERSEAS MARKETS FOR EXPORTING YOUR PRODUCT
- TOP CONSUMING MARKETS
- UNSATURATED MARKETS
- TOP IMPORTING MARKETS
- MOST PROFITABLE MARKETS
7. PRODUCTION
The Latest Trends and Insights into The Industry
- PRODUCTION VOLUME AND VALUE
8. IMPORTS
The Largest Import Supplying Countries
- IMPORTS FROM 2012–2023
- IMPORTS BY COUNTRY
- IMPORT PRICES BY COUNTRY
9. EXPORTS
The Largest Destinations for Exports
- EXPORTS FROM 2012–2023
- EXPORTS BY COUNTRY
- EXPORT PRICES BY COUNTRY
-
10. PROFILES OF MAJOR PRODUCERS
The Largest Producers on The Market and Their Profiles
This Chapter is Available Only for the Professional Edition PRO -
LIST OF TABLES
- Key Findings In 2023
- Market Volume, In Physical Terms, 2012–2023
- Market Value, 2012–2023
- Per Capita Consumption In 2012-2023
- Imports, In Physical Terms, By Country, 2012–2023
- Imports, In Value Terms, By Country, 2012–2023
- Import Prices, By Country Of Origin, 2012–2023
- Exports, In Physical Terms, By Country, 2012–2023
- Exports, In Value Terms, By Country, 2012–2023
- Export Prices, By Country Of Destination, 2012–2023
-
LIST OF FIGURES
- Market Volume, In Physical Terms, 2012–2023
- Market Value, 2012–2023
- Market Structure – Domestic Supply vs. Imports, In Physical Terms, 2012-2023
- Market Structure – Domestic Supply vs. Imports, In Value Terms, 2012-2023
- Trade Balance, In Physical Terms, 2012-2023
- Trade Balance, In Value Terms, 2012-2023
- Per Capita Consumption, 2012-2023
- Market Volume Forecast to 2030
- Market Value Forecast to 2030
- Products: Market Size And Growth, By Type
- Products: Average Per Capita Consumption, By Type
- Products: Exports And Growth, By Type
- Products: Export Prices And Growth, By Type
- Production Volume And Growth
- Exports And Growth
- Export Prices And Growth
- Market Size And Growth
- Per Capita Consumption
- Imports And Growth
- Import Prices
- Production, In Physical Terms, 2012–2023
- Production, In Value Terms, 2012–2023
- Imports, In Physical Terms, 2012–2023
- Imports, In Value Terms, 2012–2023
- Imports, In Physical Terms, By Country, 2023
- Imports, In Physical Terms, By Country, 2012–2023
- Imports, In Value Terms, By Country, 2012–2023
- Import Prices, By Country Of Origin, 2012–2023
- Exports, In Physical Terms, 2012–2023
- Exports, In Value Terms, 2012–2023
- Exports, In Physical Terms, By Country, 2023
- Exports, In Physical Terms, By Country, 2012–2023
- Exports, In Value Terms, By Country, 2012–2023
- Export Prices, By Country Of Destination, 2012–2023


