China - Meat And Poultry - Market Analysis, Forecast, Size, Trends and Insights
Get instant access to more than 2 million reports, dashboards, and datasets on the IndexBox Platform.
View PricingChina's June 2023 Import of Meat and Poultry Surges to $2.3B
China Meat And Poultry Imports
In June 2023, after two months of decline, there was significant growth in purchases abroad of meat and poultry, when their volume increased by 16% to 550K tons. Overall, imports saw a relatively flat trend pattern.
In value terms, meat and poultry imports surged to $2.3B (IndexBox estimates) in June 2023. In general, imports, however, saw a relatively flat trend pattern. 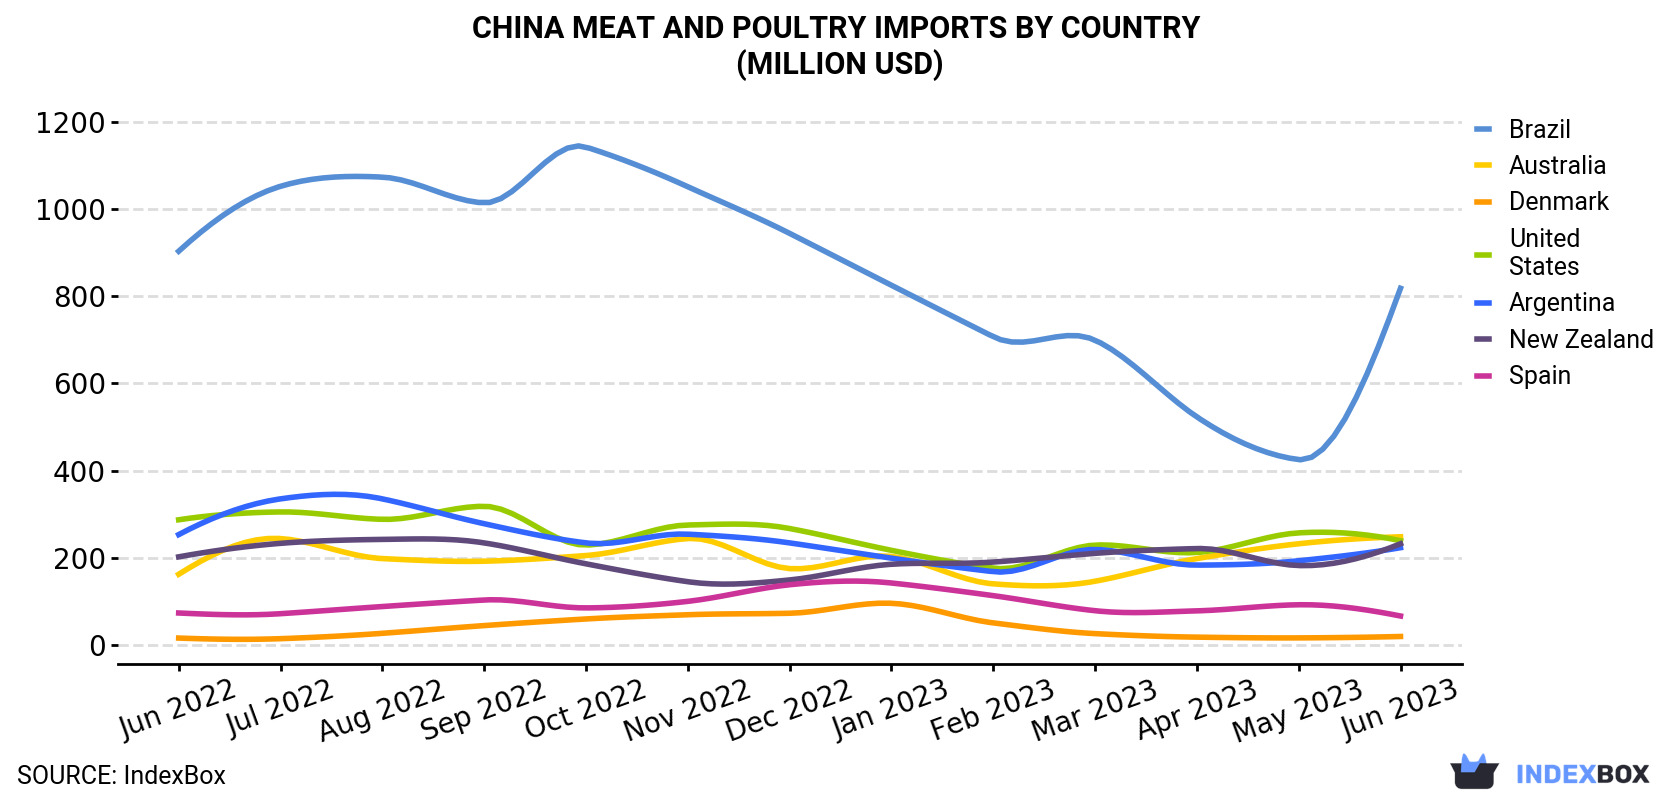
| COUNTRY | Import Value of Meat And Poultry in China (million USD) | ||||||||||||
|---|---|---|---|---|---|---|---|---|---|---|---|---|---|
| Jun 2022 | Jul 2022 | Aug 2022 | Sep 2022 | Oct 2022 | Nov 2022 | Dec 2022 | Jan 2023 | Feb 2023 | Mar 2023 | Apr 2023 | May 2023 | Jun 2023 | |
| Brazil | 903 | 1,052 | 1,073 | 1,014 | 1,142 | 1,051 | 944 | 825 | 707 | 699 | 523 | 425 | 818 |
| Australia | 162 | 244 | 198 | 192 | 205 | 244 | 175 | 203 | 140 | 146 | 198 | 232 | 248 |
| United States | 287 | 305 | 288 | 318 | 229 | 275 | 267 | 217 | 176 | 229 | 212 | 257 | 239 |
| New Zealand | 202 | 233 | 242 | 234 | 186 | 145 | 149 | 185 | 190 | 210 | 221 | 182 | 232 |
| Argentina | 253 | 335 | 335 | 278 | 234 | 254 | 234 | 199 | 168 | 219 | 183 | 193 | 223 |
| Spain | 73.2 | 71.6 | 88.0 | 103 | 84.9 | 99.9 | 138 | 142 | 113 | 78.4 | 78.1 | 92.1 | 66.3 |
| Denmark | 15.7 | 14.3 | 26.6 | 44.3 | 59.5 | 69.2 | 72.6 | 95.5 | 50.5 | 25.9 | 17.8 | 16.1 | 19.3 |
| Others | 429 | 481 | 526 | 445 | 391 | 410 | 485 | 427 | 419 | 403 | 393 | 447 | 405 |
| Total | 2,326 | 2,734 | 2,776 | 2,628 | 2,531 | 2,548 | 2,465 | 2,294 | 1,963 | 2,010 | 1,825 | 1,845 | 2,250 |
Imports by Country
In June 2023, Brazil (208K tons) constituted the largest meat and poultry supplier to China, with a 38% share of total imports. Moreover, meat and poultry imports from Brazil exceeded the figures recorded by the second-largest supplier, Argentina (50K tons), fourfold. The third position in this ranking was held by the United States (49K tons), with a 9% share.
From June 2022 to June 2023, the average monthly growth rate of volume from Brazil totaled +1.3%. The remaining supplying countries recorded the following average monthly rates of imports growth: Argentina (+0.4% per month) and the United States (-1.4% per month).
In value terms, Brazil ($818M) constituted the largest supplier of meat and poultry to China, comprising 36% of total imports. The second position in the ranking was held by Australia ($248M), with an 11% share of total imports. It was followed by the United States, with an 11% share.
From June 2022 to June 2023, the average monthly rate of growth in terms of value from Brazil was relatively modest. The remaining supplying countries recorded the following average monthly rates of imports growth: Australia (+3.6% per month) and the United States (-1.5% per month).
Imports by Type
Beef (cattle meat) (234K tons), chicken meat (138K tons) and pork (128K tons) were the main products of meat and poultry imports to China, with a combined 91% share of total imports. Lamb and sheep meat, horse, mule and donkey meat, turkey meat, goat meat and meat of camels and other animals lagged somewhat behind, together comprising a further 9.1%.
From June 2022 to June 2023, the biggest increases were in goat meat (with a CAGR of +69.4%), while purchases for the other products experienced more modest paces of growth.
In value terms, beef (cattle meat) ($1.3B) constituted the largest type of meat and poultry supplied to China, comprising 57% of total imports. The second position in the ranking was held by chicken meat ($444M), with a 20% share of total imports. It was followed by pork, with a 13% share.
Import Prices by Country
In June 2023, the meat and poultry price amounted to $4,090 per ton (CIF, China), surging by 5.2% against the previous month. In general, the import price, however, showed a mild decrease. The pace of growth was the most pronounced in July 2022 when the average import price increased by 7.9% m-o-m. As a result, import price attained the peak level of $5,074 per ton. From August 2022 to June 2023, the average import prices remained at a lower figure.
Prices varied noticeably by the country of origin: the country with the highest price was Australia ($5,837 per ton), while the price for Canada ($2,143 per ton) was amongst the lowest.
From June 2022 to June 2023, the most notable rate of growth in terms of prices was attained by the Netherlands (+1.0%), while the prices for the other major suppliers experienced more modest paces of growth.
This report provides an in-depth analysis of the meat and poultry market in China. Within it, you will discover the latest data on market trends and opportunities by country, consumption, production and price developments, as well as the global trade (imports and exports). The forecast exhibits the market prospects through 2030.
Product coverage:
- FCL 1108 - Meat of asses
- FCL 1089 - Meat of pigeons and other birds nes
- FCL 947 - Buffalo meat
- FCL 1127 - Meat of camels
- FCL 867 - Meat of cattle
- FCL 870 - Meat of cattle, boneless
- FCL 1058 - Chicken meat
- FCL 1069 - Duck meat
- FCL 1017 - Goat meat
- FCL 1073 - Goose meat
- FCL 1097 - Horse meat
- FCL 1111 - Meat of mules
- FCL 1158 - Meat of other domestic camelids
- FCL 1151 - Meat of other domestic rodents
- FCL 1035 - Pig meat
- FCL 1141 - Rabbit meat
- FCL 977 - Meat of sheep
- FCL 1080 - Turkey meat
Country coverage:
Data coverage:
- Market volume and value
- Per Capita consumption
- Forecast of the market dynamics in the medium term
- Trade (exports and imports) in China
- Export and import prices
- Market trends, drivers and restraints
- Key market players and their profiles
Reasons to buy this report:
- Take advantage of the latest data
- Find deeper insights into current market developments
- Discover vital success factors affecting the market
This report is designed for manufacturers, distributors, importers, and wholesalers, as well as for investors, consultants and advisors.
In this report, you can find information that helps you to make informed decisions on the following issues:
- How to diversify your business and benefit from new market opportunities
- How to load your idle production capacity
- How to boost your sales on overseas markets
- How to increase your profit margins
- How to make your supply chain more sustainable
- How to reduce your production and supply chain costs
- How to outsource production to other countries
- How to prepare your business for global expansion
While doing this research, we combine the accumulated expertise of our analysts and the capabilities of artificial intelligence. The AI-based platform, developed by our data scientists, constitutes the key working tool for business analysts, empowering them to discover deep insights and ideas from the marketing data.
-
1. INTRODUCTION
Making Data-Driven Decisions to Grow Your Business
- REPORT DESCRIPTION
- RESEARCH METHODOLOGY AND AI PLATFORM
- DATA-DRIVEN DECISIONS FOR YOUR BUSINESS
- GLOSSARY AND SPECIFIC TERMS
-
2. EXECUTIVE SUMMARY
A Quick Overview of Market Performance
- KEY FINDINGS
- MARKET TRENDS This Chapter is Available Only for the Professional Edition PRO
-
3. MARKET OVERVIEW
Understanding the Current State of The Market and Its Prospects
- MARKET SIZE
- MARKET STRUCTURE
- TRADE BALANCE
- PER CAPITA CONSUMPTION
- MARKET FORECAST TO 2030
-
4. MOST PROMISING PRODUCT
Finding New Products to Diversify Your Business
This Chapter is Available Only for the Professional Edition PRO- TOP PRODUCTS TO DIVERSIFY YOUR BUSINESS
- BEST-SELLING PRODUCTS
- MOST CONSUMED PRODUCT
- MOST TRADED PRODUCT
- MOST PROFITABLE PRODUCT FOR EXPORT
-
5. MOST PROMISING SUPPLYING COUNTRIES
Choosing the Best Countries to Establish Your Sustainable Supply Chain
This Chapter is Available Only for the Professional Edition PRO- TOP COUNTRIES TO SOURCE YOUR PRODUCT
- TOP PRODUCING COUNTRIES
- COUNTRIES WITH TOP YIELDS
- TOP EXPORTING COUNTRIES
- LOW-COST EXPORTING COUNTRIES
-
6. MOST PROMISING OVERSEAS MARKETS
Choosing the Best Countries to Boost Your Exports
This Chapter is Available Only for the Professional Edition PRO- TOP OVERSEAS MARKETS FOR EXPORTING YOUR PRODUCT
- TOP CONSUMING MARKETS
- UNSATURATED MARKETS
- TOP IMPORTING MARKETS
- MOST PROFITABLE MARKETS
7. PRODUCTION
The Latest Trends and Insights into The Industry
- PRODUCTION, PRODUCING ANIMALS AND YIELD
8. IMPORTS
The Largest Import Supplying Countries
- IMPORTS FROM 2012–2023
- IMPORTS BY COUNTRY
- IMPORT PRICES BY COUNTRY
9. EXPORTS
The Largest Destinations for Exports
- EXPORTS FROM 2012–2023
- EXPORTS BY COUNTRY
- EXPORT PRICES BY COUNTRY
-
10. PROFILES OF MAJOR PRODUCERS
The Largest Producers on The Market and Their Profiles
This Chapter is Available Only for the Professional Edition PRO -
LIST OF TABLES
- Key Findings In 2023
- Market Volume, In Physical Terms, 2012–2023
- Market Value, 2012–2023
- Per Capita Consumption In 2012-2023
- Imports, In Physical Terms, By Country, 2012–2023
- Imports, In Value Terms, By Country, 2012–2023
- Import Prices, By Country Of Origin, 2012–2023
- Exports, In Physical Terms, By Country, 2012–2023
- Exports, In Value Terms, By Country, 2012–2023
- Export Prices, By Country Of Destination, 2012–2023
-
LIST OF FIGURES
- Market Volume, In Physical Terms, 2012–2023
- Market Value, 2012–2023
- Market Structure – Domestic Supply vs. Imports, In Physical Terms, 2012-2023
- Market Structure – Domestic Supply vs. Imports, In Value Terms, 2012-2023
- Trade Balance, In Physical Terms, 2012-2023
- Trade Balance, In Value Terms, 2012-2023
- Per Capita Consumption, 2012-2023
- Market Volume Forecast to 2030
- Market Value Forecast to 2030
- Products: Market Size And Growth, By Type
- Products: Average Per Capita Consumption, By Type
- Products: Exports And Growth, By Type
- Products: Export Prices And Growth, By Type
- Production Volume And Growth
- Yield And Growth
- Exports And Growth
- Export Prices And Growth
- Market Size And Growth
- Per Capita Consumption
- Imports And Growth
- Import Prices
- Production, In Physical Terms, 2012–2023
- Production, In Value Terms, 2012–2023
- Producing Animals Slaughtered, 2012–2023
- Yield, 2012–2023
- Imports, In Physical Terms, 2012–2023
- Imports, In Value Terms, 2012–2023
- Imports, In Physical Terms, By Country, 2023
- Imports, In Physical Terms, By Country, 2012–2023
- Imports, In Value Terms, By Country, 2012–2023
- Import Prices, By Country Of Origin, 2012–2023
- Exports, In Physical Terms, 2012–2023
- Exports, In Value Terms, 2012–2023
- Exports, In Physical Terms, By Country, 2023
- Exports, In Physical Terms, By Country, 2012–2023
- Exports, In Value Terms, By Country, 2012–2023
- Export Prices, By Country Of Destination, 2012–2023


