Australia - Meat And Poultry - Market Analysis, Forecast, Size, Trends and Insights
Get instant access to more than 2 million reports, dashboards, and datasets on the IndexBox Platform.
View PricingAustralian Meat and Poultry Export Sees Modest Increase to $970M in September 2023
Australia Meat And Poultry Exports
Meat and poultry exports from Australia rose slightly to 176K tons in September 2023, increasing by 2.9% against the previous month's figure. Over the period under review, total exports indicated a measured increase from September 2022 to September 2023: its volume increased at an average monthly rate of +2.7% over the last twelve-month period. The trend pattern, however, indicated some noticeable fluctuations being recorded throughout the analyzed period. Based on September 2023 figures, exports increased by +6.6% against March 2023 indices. The most prominent rate of growth was recorded in March 2023 when exports increased by 37% month-to-month. Over the period under review, the exports reached the maximum in September 2023.
In value terms, meat and poultry exports reached $970M (IndexBox estimates) in September 2023. Overall, exports continue to indicate a relatively flat trend pattern. The pace of growth appeared the most rapid in February 2023 with an increase of 30% m-o-m.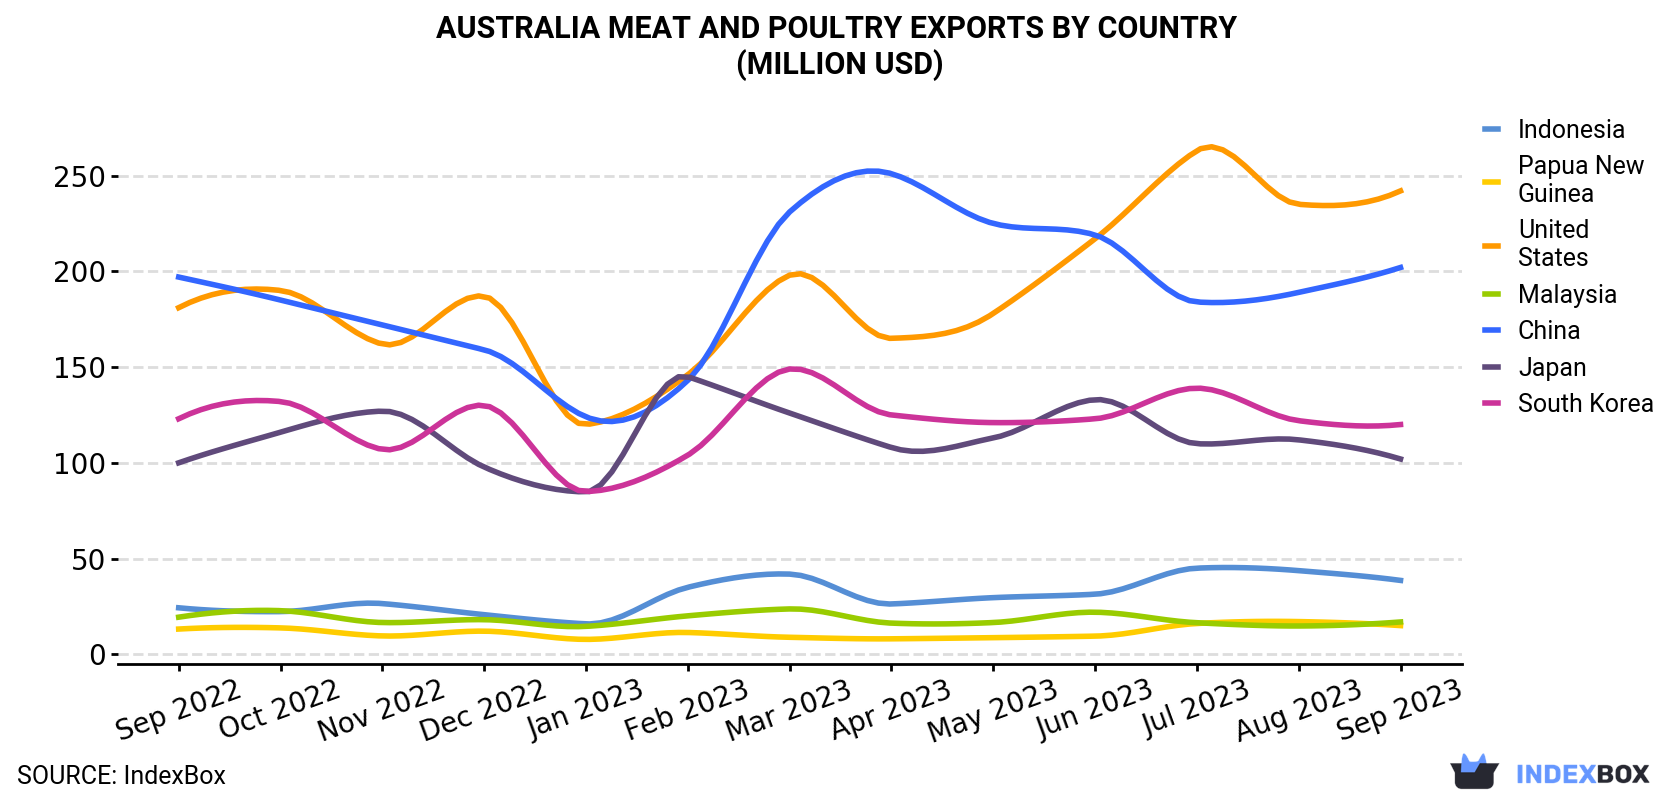
| COUNTRY | Export Value of Meat And Poultry in Australia (million USD) | ||||||||||||
|---|---|---|---|---|---|---|---|---|---|---|---|---|---|
| Sep 2022 | Oct 2022 | Nov 2022 | Dec 2022 | Jan 2023 | Feb 2023 | Mar 2023 | Apr 2023 | May 2023 | Jun 2023 | Jul 2023 | Aug 2023 | Sep 2023 | |
| United States | 181 | 190 | 162 | 187 | 120 | 146 | 198 | 165 | 178 | 217 | 263 | 235 | 242 |
| China | 197 | 185 | 172 | 159 | 124 | 143 | 231 | 251 | 225 | 219 | 184 | 189 | 202 |
| South Korea | 123 | 132 | 107 | 130 | 85.0 | 104 | 149 | 125 | 121 | 123 | 139 | 122 | 120 |
| Japan | 100 | 116 | 127 | 97.8 | 84.8 | 145 | 126 | 108 | 113 | 133 | 110 | 112 | 102 |
| Indonesia | 24.3 | 22.3 | 26.5 | 20.7 | 15.9 | 35.0 | 41.9 | 26.3 | 29.6 | 31.4 | 45.0 | 43.7 | 38.6 |
| Malaysia | 19.4 | 22.8 | 16.6 | 18.1 | 14.6 | 20.1 | 23.7 | 16.3 | 16.6 | 22.0 | 16.5 | 14.8 | 16.9 |
| Papua New Guinea | 13.2 | 13.8 | 9.6 | 12.1 | 7.8 | 11.4 | 8.9 | 8.1 | 8.7 | 9.5 | 16.1 | 17.1 | 15.0 |
| Others | 212 | 210 | 198 | 208 | 147 | 172 | 211 | 190 | 218 | 222 | 245 | 231 | 234 |
| Total | 871 | 892 | 818 | 833 | 599 | 776 | 990 | 888 | 911 | 977 | 1,019 | 963 | 970 |
Exports by Country
China (41K tons), the United States (35K tons) and South Korea (19K tons) were the main destinations of meat and poultry exports from Australia, together accounting for 54% of total exports.
From September 2022 to September 2023, the biggest increases were in the United States (with a CAGR of +4.9%), while shipments for the other leaders experienced more modest paces of growth.
In value terms, the United States ($242M), China ($202M) and South Korea ($120M) were the largest markets for meat and poultry exported from Australia worldwide, with a combined 58% share of total exports. These countries were followed by Japan, Indonesia, Malaysia and Papua New Guinea, which together accounted for a further 18%.
Indonesia, with a CAGR of +3.9%, saw the highest growth rate of the value of exports, in terms of the main countries of destination over the period under review, while shipments for the other leaders experienced more modest paces of growth.
Exports by Type
Beef (cattle meat) (110K tons) was the largest type of meat and poultry exported from Australia, with a 63% share of total exports. Moreover, beef (cattle meat) exceeded the volume of the second product type, lamb and sheep meat (54K tons), twofold. The third position in this ranking was taken by chicken meat (4.4K tons), with a 2.5% share.
From September 2022 to September 2023, the average monthly growth rate of the volume of export of beef (cattle meat) stood at +2.9%. With regard to the other exported products, the following average monthly rates of growth were recorded: lamb and sheep meat (+2.5% per month) and chicken meat (-0.2% per month).
In value terms, beef (cattle meat) ($671M) remains the largest type of meat and poultry exported from Australia, comprising 69% of total exports. The second position in the ranking was held by lamb and sheep meat ($260M), with a 27% share of total exports. It was followed by goat meat, with a 1.6% share.
From September 2022 to September 2023, the average monthly rate of growth in terms of the export volume of beef (cattle meat) stood at +1.4%. With regard to the other exported products, the following average monthly rates of growth were recorded: lamb and sheep meat (-0.2% per month) and goat meat (-1.1% per month).
Export Prices by Country
In September 2023, the meat and poultry price stood at $5,515 per ton (FOB, Australia), waning by -2.1% against the previous month. In general, the export price recorded a slight setback. The pace of growth appeared the most rapid in April 2023 an increase of 4.6% month-to-month. The export price peaked at $6,822 per ton in September 2022; however, from October 2022 to September 2023, the export prices failed to regain momentum.
There were significant differences in the average prices for the major external markets. In September 2023, the country with the highest price was the United Arab Emirates ($7,033 per ton), while the average price for exports to Papua New Guinea ($2,719 per ton) was amongst the lowest.
From September 2022 to September 2023, the most notable rate of growth in terms of prices was recorded for supplies to Papua New Guinea (+0.8%), while the prices for the other major destinations experienced a decline.
This report provides an in-depth analysis of the meat and poultry market in Australia. Within it, you will discover the latest data on market trends and opportunities by country, consumption, production and price developments, as well as the global trade (imports and exports). The forecast exhibits the market prospects through 2030.
Product coverage:
- FCL 1108 - Meat of asses
- FCL 1089 - Meat of pigeons and other birds nes
- FCL 947 - Buffalo meat
- FCL 1127 - Meat of camels
- FCL 867 - Meat of cattle
- FCL 870 - Meat of cattle, boneless
- FCL 1058 - Chicken meat
- FCL 1069 - Duck meat
- FCL 1017 - Goat meat
- FCL 1073 - Goose meat
- FCL 1097 - Horse meat
- FCL 1111 - Meat of mules
- FCL 1158 - Meat of other domestic camelids
- FCL 1151 - Meat of other domestic rodents
- FCL 1035 - Pig meat
- FCL 1141 - Rabbit meat
- FCL 977 - Meat of sheep
- FCL 1080 - Turkey meat
Country coverage:
- Australia
Data coverage:
- Market volume and value
- Per Capita consumption
- Forecast of the market dynamics in the medium term
- Trade (exports and imports) in Australia
- Export and import prices
- Market trends, drivers and restraints
- Key market players and their profiles
Reasons to buy this report:
- Take advantage of the latest data
- Find deeper insights into current market developments
- Discover vital success factors affecting the market
This report is designed for manufacturers, distributors, importers, and wholesalers, as well as for investors, consultants and advisors.
In this report, you can find information that helps you to make informed decisions on the following issues:
- How to diversify your business and benefit from new market opportunities
- How to load your idle production capacity
- How to boost your sales on overseas markets
- How to increase your profit margins
- How to make your supply chain more sustainable
- How to reduce your production and supply chain costs
- How to outsource production to other countries
- How to prepare your business for global expansion
While doing this research, we combine the accumulated expertise of our analysts and the capabilities of artificial intelligence. The AI-based platform, developed by our data scientists, constitutes the key working tool for business analysts, empowering them to discover deep insights and ideas from the marketing data.
-
1. INTRODUCTION
Making Data-Driven Decisions to Grow Your Business
- REPORT DESCRIPTION
- RESEARCH METHODOLOGY AND AI PLATFORM
- DATA-DRIVEN DECISIONS FOR YOUR BUSINESS
- GLOSSARY AND SPECIFIC TERMS
-
2. EXECUTIVE SUMMARY
A Quick Overview of Market Performance
- KEY FINDINGS
- MARKET TRENDS This Chapter is Available Only for the Professional Edition PRO
-
3. MARKET OVERVIEW
Understanding the Current State of The Market and Its Prospects
- MARKET SIZE
- MARKET STRUCTURE
- TRADE BALANCE
- PER CAPITA CONSUMPTION
- MARKET FORECAST TO 2030
-
4. MOST PROMISING PRODUCT
Finding New Products to Diversify Your Business
This Chapter is Available Only for the Professional Edition PRO- TOP PRODUCTS TO DIVERSIFY YOUR BUSINESS
- BEST-SELLING PRODUCTS
- MOST CONSUMED PRODUCT
- MOST TRADED PRODUCT
- MOST PROFITABLE PRODUCT FOR EXPORT
-
5. MOST PROMISING SUPPLYING COUNTRIES
Choosing the Best Countries to Establish Your Sustainable Supply Chain
This Chapter is Available Only for the Professional Edition PRO- TOP COUNTRIES TO SOURCE YOUR PRODUCT
- TOP PRODUCING COUNTRIES
- COUNTRIES WITH TOP YIELDS
- TOP EXPORTING COUNTRIES
- LOW-COST EXPORTING COUNTRIES
-
6. MOST PROMISING OVERSEAS MARKETS
Choosing the Best Countries to Boost Your Exports
This Chapter is Available Only for the Professional Edition PRO- TOP OVERSEAS MARKETS FOR EXPORTING YOUR PRODUCT
- TOP CONSUMING MARKETS
- UNSATURATED MARKETS
- TOP IMPORTING MARKETS
- MOST PROFITABLE MARKETS
7. PRODUCTION
The Latest Trends and Insights into The Industry
- PRODUCTION, PRODUCING ANIMALS AND YIELD
8. IMPORTS
The Largest Import Supplying Countries
- IMPORTS FROM 2012–2023
- IMPORTS BY COUNTRY
- IMPORT PRICES BY COUNTRY
9. EXPORTS
The Largest Destinations for Exports
- EXPORTS FROM 2012–2023
- EXPORTS BY COUNTRY
- EXPORT PRICES BY COUNTRY
-
10. PROFILES OF MAJOR PRODUCERS
The Largest Producers on The Market and Their Profiles
This Chapter is Available Only for the Professional Edition PRO -
LIST OF TABLES
- Key Findings In 2023
- Market Volume, In Physical Terms, 2012–2023
- Market Value, 2012–2023
- Per Capita Consumption In 2012-2023
- Imports, In Physical Terms, By Country, 2012–2023
- Imports, In Value Terms, By Country, 2012–2023
- Import Prices, By Country Of Origin, 2012–2023
- Exports, In Physical Terms, By Country, 2012–2023
- Exports, In Value Terms, By Country, 2012–2023
- Export Prices, By Country Of Destination, 2012–2023
-
LIST OF FIGURES
- Market Volume, In Physical Terms, 2012–2023
- Market Value, 2012–2023
- Market Structure – Domestic Supply vs. Imports, In Physical Terms, 2012-2023
- Market Structure – Domestic Supply vs. Imports, In Value Terms, 2012-2023
- Trade Balance, In Physical Terms, 2012-2023
- Trade Balance, In Value Terms, 2012-2023
- Per Capita Consumption, 2012-2023
- Market Volume Forecast to 2030
- Market Value Forecast to 2030
- Products: Market Size And Growth, By Type
- Products: Average Per Capita Consumption, By Type
- Products: Exports And Growth, By Type
- Products: Export Prices And Growth, By Type
- Production Volume And Growth
- Yield And Growth
- Exports And Growth
- Export Prices And Growth
- Market Size And Growth
- Per Capita Consumption
- Imports And Growth
- Import Prices
- Production, In Physical Terms, 2012–2023
- Production, In Value Terms, 2012–2023
- Producing Animals Slaughtered, 2012–2023
- Yield, 2012–2023
- Imports, In Physical Terms, 2012–2023
- Imports, In Value Terms, 2012–2023
- Imports, In Physical Terms, By Country, 2023
- Imports, In Physical Terms, By Country, 2012–2023
- Imports, In Value Terms, By Country, 2012–2023
- Import Prices, By Country Of Origin, 2012–2023
- Exports, In Physical Terms, 2012–2023
- Exports, In Value Terms, 2012–2023
- Exports, In Physical Terms, By Country, 2023
- Exports, In Physical Terms, By Country, 2012–2023
- Exports, In Value Terms, By Country, 2012–2023
- Export Prices, By Country Of Destination, 2012–2023


