Australia Experiences Significant Increase in Umbrella Imports, Reaching $3.7M in November 2023
Australia Umbrella Imports
In November 2023, approximately 357K units of umbrellas were imported into Australia; rising by 24% on the month before. Over the period under review, imports, however, recorded a abrupt slump. The most prominent rate of growth was recorded in May 2023 with an increase of 98% against the previous month. Over the period under review, imports hit record highs at 954K units in November 2022; however, from December 2022 to November 2023, imports failed to regain momentum.
In value terms, umbrella imports totaled $3.7M (IndexBox estimates) in November 2023. Overall, imports, however, recorded a noticeable shrinkage. The pace of growth appeared the most rapid in August 2023 when imports increased by 89% against the previous month. Imports peaked at 6.2M units in September 2023; however, from October 2023 to November 2023, imports stood at a somewhat lower figure.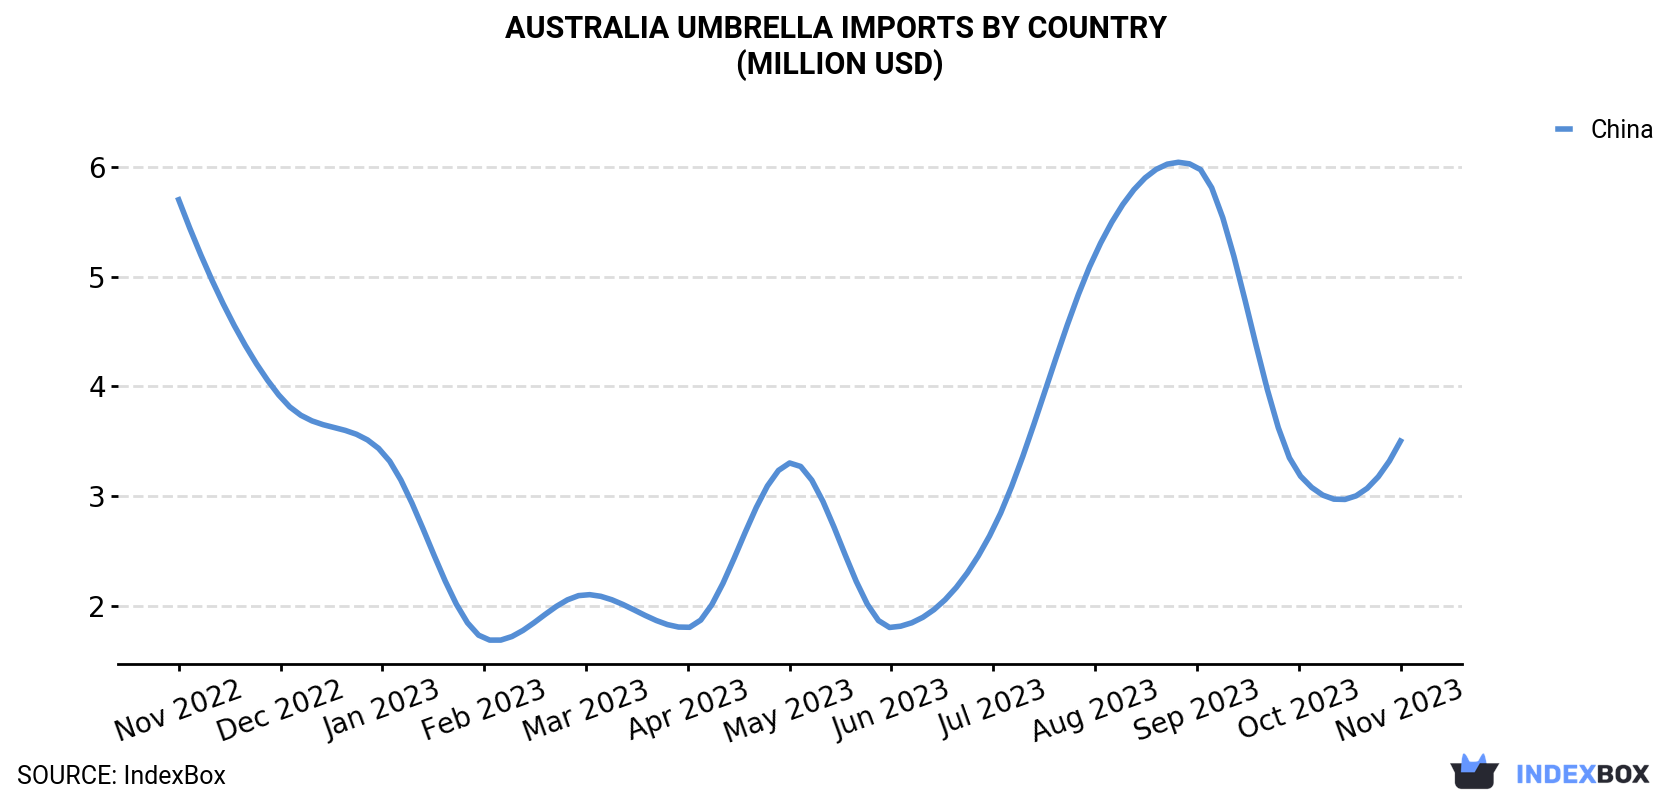
| COUNTRY | Import Value of Umbrella in Australia (million USD) | ||||||||||||
|---|---|---|---|---|---|---|---|---|---|---|---|---|---|
| Nov 2022 | Dec 2022 | Jan 2023 | Feb 2023 | Mar 2023 | Apr 2023 | May 2023 | Jun 2023 | Jul 2023 | Aug 2023 | Sep 2023 | Oct 2023 | Nov 2023 | |
| China | 5.7 | 3.9 | 3.4 | 1.7 | 2.1 | 1.8 | 3.3 | 1.8 | 2.7 | 5.2 | 6.0 | 3.2 | 3.5 |
| Others | 0.3 | 0.1 | 0.2 | 0.3 | 0.2 | 0.2 | 0.2 | 0.2 | 0.2 | 0.2 | 0.2 | 0.2 | 0.3 |
| Total | 6.0 | 4.0 | 3.6 | 2.0 | 2.4 | 2.0 | 3.5 | 2.0 | 2.9 | 5.4 | 6.2 | 3.4 | 3.7 |
Imports by Country
In November 2023, China (343K units) was the main supplier of umbrella to Australia, with a approximately 96% share of total imports.
From November 2022 to November 2023, the average monthly growth rate of volume from China totaled -8.0%.
In value terms, China ($3.5M) constituted the largest supplier of umbrella to Australia.
From November 2022 to November 2023, the average monthly growth rate of value from China stood at -4.0%.
Imports by Type
In November 2023, umbrellas and sun umbrellas (other than having a telescopic shaft or garden umbrellas) (263K units) constituted the largest type of umbrella supplied to Australia, with a 74% share of total imports. Moreover, umbrellas and sun umbrellas (other than having a telescopic shaft or garden umbrellas) exceeded the figures recorded for the second-largest type, garden or similar umbrellas (69K units), fourfold.
From November 2022 to November 2023, the average monthly rate of growth in terms of the volume of import of umbrellas and sun umbrellas (other than having a telescopic shaft or garden umbrellas) stood at -5.5%. With regard to the other supplied products, the following average monthly rates of growth were recorded: garden or similar umbrellas (+1.1% per month) and umbrellas having a telescopic shaft (excluding garden umbrellas) (-20.3% per month).
In value terms, the most traded types of umbrellas in Australia were umbrellas and sun umbrellas (other than having a telescopic shaft or garden umbrellas) ($2M), garden or similar umbrellas ($1.6M) and umbrellas having a telescopic shaft (excluding garden umbrellas) ($133K).
Import Prices by Country
In November 2023, the umbrella price stood at $10.5 per unit (CIF, Australia), with a decrease of -10.5% against the previous month. Over the period under review, the import price, however, showed a measured expansion. The growth pace was the most rapid in August 2023 when the average import price increased by 59% month-to-month. Over the period under review, average import prices hit record highs at $11.7 per unit in October 2023, and then reduced in the following month.
Average prices varied somewhat amongst the major supplying countries. In November 2023, the country with the highest price was China ($10.2 per unit), while the price for Cambodia totaled $6.9 per unit.
From November 2022 to November 2023, the most notable rate of growth in terms of prices was attained by China (+4.4%).
-
1. INTRODUCTION
Making Data-Driven Decisions to Grow Your Business
- REPORT DESCRIPTION
- RESEARCH METHODOLOGY AND AI PLATFORM
- DATA-DRIVEN DECISIONS FOR YOUR BUSINESS
- GLOSSARY AND SPECIFIC TERMS
-
2. EXECUTIVE SUMMARY
A Quick Overview of Market Performance
- KEY FINDINGS
- MARKET TRENDS This Chapter is Available Only for the Professional Edition PRO
-
3. MARKET OVERVIEW
Understanding the Current State of The Market and Its Prospects
- MARKET SIZE
- MARKET STRUCTURE
- TRADE BALANCE
- PER CAPITA CONSUMPTION
- MARKET FORECAST TO 2030
-
4. MOST PROMISING PRODUCT
Finding New Products to Diversify Your Business
This Chapter is Available Only for the Professional Edition PRO- TOP PRODUCTS TO DIVERSIFY YOUR BUSINESS
- BEST-SELLING PRODUCTS
- MOST CONSUMED PRODUCT
- MOST TRADED PRODUCT
- MOST PROFITABLE PRODUCT FOR EXPORT
-
5. MOST PROMISING SUPPLYING COUNTRIES
Choosing the Best Countries to Establish Your Sustainable Supply Chain
This Chapter is Available Only for the Professional Edition PRO- TOP COUNTRIES TO SOURCE YOUR PRODUCT
- TOP PRODUCING COUNTRIES
- TOP EXPORTING COUNTRIES
- LOW-COST EXPORTING COUNTRIES
-
6. MOST PROMISING OVERSEAS MARKETS
Choosing the Best Countries to Boost Your Exports
This Chapter is Available Only for the Professional Edition PRO- TOP OVERSEAS MARKETS FOR EXPORTING YOUR PRODUCT
- TOP CONSUMING MARKETS
- UNSATURATED MARKETS
- TOP IMPORTING MARKETS
- MOST PROFITABLE MARKETS
7. PRODUCTION
The Latest Trends and Insights into The Industry
- PRODUCTION VOLUME AND VALUE
8. IMPORTS
The Largest Import Supplying Countries
- IMPORTS FROM 2012–2023
- IMPORTS BY COUNTRY
- IMPORT PRICES BY COUNTRY
9. EXPORTS
The Largest Destinations for Exports
- EXPORTS FROM 2012–2023
- EXPORTS BY COUNTRY
- EXPORT PRICES BY COUNTRY
-
10. PROFILES OF MAJOR PRODUCERS
The Largest Producers on The Market and Their Profiles
This Chapter is Available Only for the Professional Edition PRO -
LIST OF TABLES
- Key Findings In 2023
- Market Volume, In Physical Terms, 2012–2023
- Market Value, 2012–2023
- Per Capita Consumption In 2012-2023
- Imports, In Physical Terms, By Country, 2012–2023
- Imports, In Value Terms, By Country, 2012–2023
- Import Prices, By Country Of Origin, 2012–2023
- Exports, In Physical Terms, By Country, 2012–2023
- Exports, In Value Terms, By Country, 2012–2023
- Export Prices, By Country Of Destination, 2012–2023
-
LIST OF FIGURES
- Market Volume, In Physical Terms, 2012–2023
- Market Value, 2012–2023
- Market Structure – Domestic Supply vs. Imports, In Physical Terms, 2012-2023
- Market Structure – Domestic Supply vs. Imports, In Value Terms, 2012-2023
- Trade Balance, In Physical Terms, 2012-2023
- Trade Balance, In Value Terms, 2012-2023
- Per Capita Consumption, 2012-2023
- Market Volume Forecast to 2030
- Market Value Forecast to 2030
- Products: Market Size And Growth, By Type
- Products: Average Per Capita Consumption, By Type
- Products: Exports And Growth, By Type
- Products: Export Prices And Growth, By Type
- Production Volume And Growth
- Exports And Growth
- Export Prices And Growth
- Market Size And Growth
- Per Capita Consumption
- Imports And Growth
- Import Prices
- Production, In Physical Terms, 2012–2023
- Production, In Value Terms, 2012–2023
- Imports, In Physical Terms, 2012–2023
- Imports, In Value Terms, 2012–2023
- Imports, In Physical Terms, By Country, 2023
- Imports, In Physical Terms, By Country, 2012–2023
- Imports, In Value Terms, By Country, 2012–2023
- Import Prices, By Country Of Origin, 2012–2023
- Exports, In Physical Terms, 2012–2023
- Exports, In Value Terms, 2012–2023
- Exports, In Physical Terms, By Country, 2023
- Exports, In Physical Terms, By Country, 2012–2023
- Exports, In Value Terms, By Country, 2012–2023
- Export Prices, By Country Of Destination, 2012–2023


