Surge in Brazil's Import of Umbrellas Soars 44% to $4.9M in August 2023
Brazil Umbrella Imports
In August 2023, approximately 7.4M units of umbrellas were imported into Brazil; growing by 46% against the previous month's figure. Overall, total imports indicated a tangible increase from August 2022 to August 2023: its volume increased at an average monthly rate of +2.0% over the last twelve-month period. The trend pattern, however, indicated some noticeable fluctuations being recorded throughout the analyzed period. Based on August 2023 figures, imports decreased by -14.4% against June 2023 indices. The growth pace was the most rapid in June 2023 with an increase of 52% m-o-m. As a result, imports attained the peak of 8.7M units. From July 2023 to August 2023, the growth of imports failed to regain momentum.
In value terms, umbrella imports skyrocketed to $4.9M (IndexBox estimates) in August 2023. In general, imports saw a relatively flat trend pattern. The pace of growth was the most pronounced in November 2022 when imports increased by 51% m-o-m. Imports peaked at 7.1M units in December 2022; however, from January 2023 to August 2023, imports stood at a somewhat lower figure.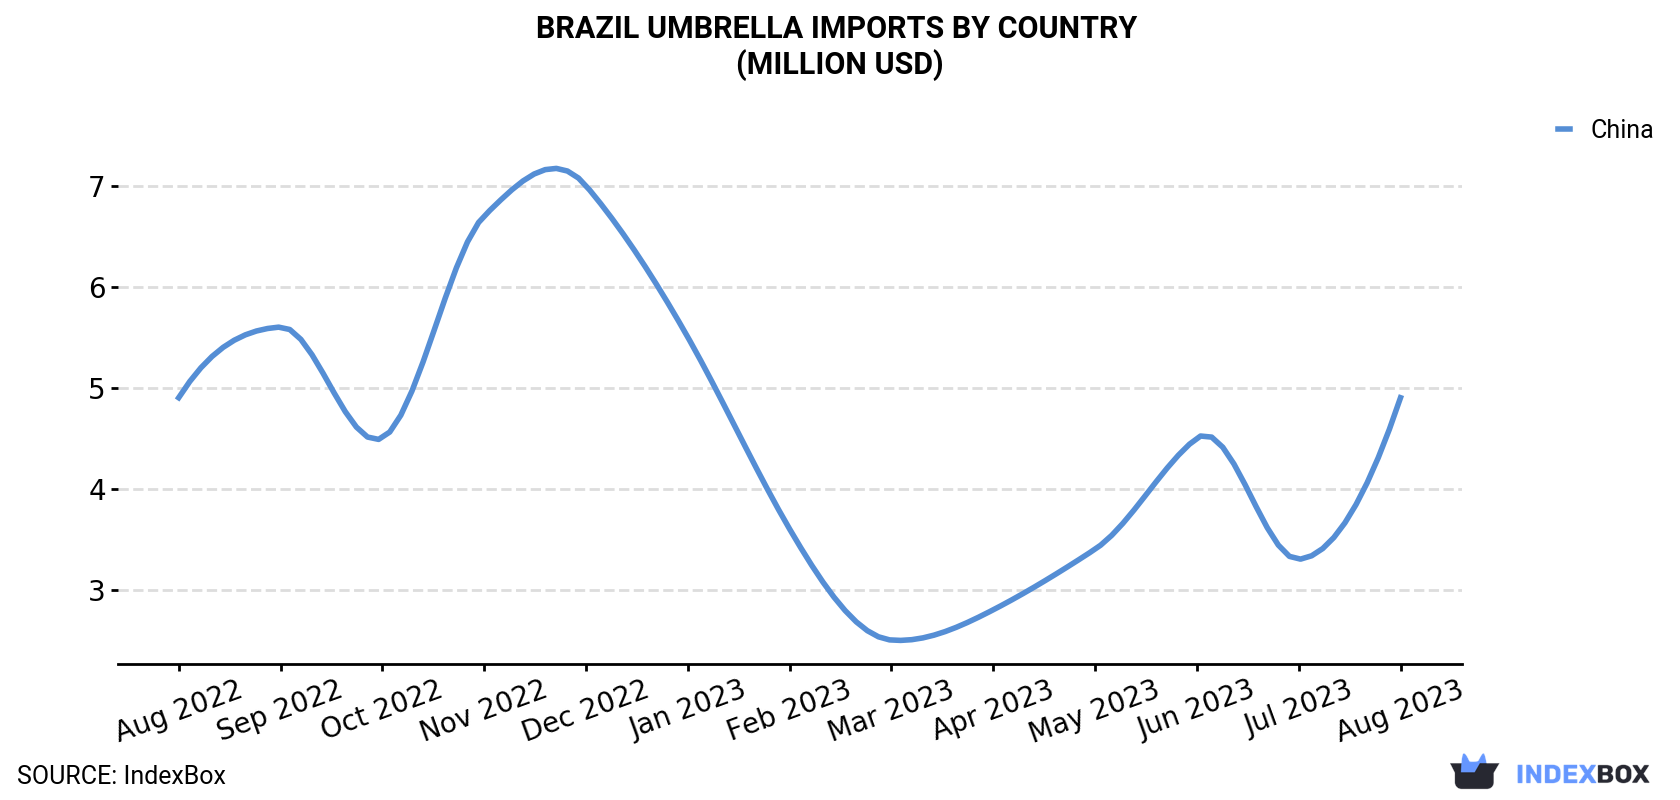
| COUNTRY | Import Value of Umbrella in Brazil (million USD) | ||||||||||||
|---|---|---|---|---|---|---|---|---|---|---|---|---|---|
| Aug 2022 | Sep 2022 | Oct 2022 | Nov 2022 | Dec 2022 | Jan 2023 | Feb 2023 | Mar 2023 | Apr 2023 | May 2023 | Jun 2023 | Jul 2023 | Aug 2023 | |
| China | 4.9 | 5.6 | 4.5 | 6.7 | 7.0 | 5.5 | 3.6 | 2.5 | 2.8 | 3.4 | 4.5 | 3.3 | 4.9 |
| Others | < 0.1 | 0.1 | < 0.1 | 0.2 | < 0.1 | < 0.1 | < 0.1 | < 0.1 | 0.1 | < 0.1 | 0.1 | 0.1 | < 0.1 |
| Total | 4.9 | 5.8 | 4.6 | 6.9 | 7.1 | 5.5 | 3.7 | 2.6 | 2.9 | 3.5 | 4.6 | 3.4 | 4.9 |
Imports by Country
In August 2023, China (7.4M units) was the main umbrella supplier to Brazil, with a approximately 100% share of total imports.
From August 2022 to August 2023, the average monthly rate of growth in terms of volume from China totaled +2.1%.
In value terms, China ($4.9M) constituted the largest supplier of umbrella to Brazil.
From August 2022 to August 2023, the average monthly growth rate of value from China was relatively modest.
Imports by Type
Umbrellas having a telescopic shaft (excluding garden umbrellas) (4.5M units), umbrellas and sun umbrellas (other than having a telescopic shaft or garden umbrellas) (2.7M units) and garden or similar umbrellas (148K units) were the main products of umbrella imports to Brazil, with a combined 99.9% share of total imports.
From August 2022 to August 2023, the biggest increases were in umbrellas having a telescopic shaft (excluding garden umbrellas) (with a CAGR of +3.4%), while purchases for the other products experienced more modest paces of growth.
In value terms, the most traded types of umbrellas in Brazil were umbrellas having a telescopic shaft (excluding garden umbrellas) ($2.2M), umbrellas and sun umbrellas (other than having a telescopic shaft or garden umbrellas) ($1.5M) and garden or similar umbrellas ($1.3M).
Import Prices by Country
In August 2023, the umbrella price stood at $667 per thousand units (CIF, Brazil), approximately reflecting the previous month. In general, the import price showed a pronounced slump. The pace of growth appeared the most rapid in September 2022 an increase of 42% m-o-m. As a result, import price attained the peak level of $1,202 per thousand units. From October 2022 to August 2023, the average import prices remained at a somewhat lower figure.
As there is only one major supplying country, the average price level is determined by prices for China.
From August 2022 to August 2023, the rate of growth in terms of prices for China amounted to -1.9% per month.
-
1. INTRODUCTION
Making Data-Driven Decisions to Grow Your Business
- REPORT DESCRIPTION
- RESEARCH METHODOLOGY AND AI PLATFORM
- DATA-DRIVEN DECISIONS FOR YOUR BUSINESS
- GLOSSARY AND SPECIFIC TERMS
-
2. EXECUTIVE SUMMARY
A Quick Overview of Market Performance
- KEY FINDINGS
- MARKET TRENDS This Chapter is Available Only for the Professional Edition PRO
-
3. MARKET OVERVIEW
Understanding the Current State of The Market and Its Prospects
- MARKET SIZE
- MARKET STRUCTURE
- TRADE BALANCE
- PER CAPITA CONSUMPTION
- MARKET FORECAST TO 2030
-
4. MOST PROMISING PRODUCT
Finding New Products to Diversify Your Business
This Chapter is Available Only for the Professional Edition PRO- TOP PRODUCTS TO DIVERSIFY YOUR BUSINESS
- BEST-SELLING PRODUCTS
- MOST CONSUMED PRODUCT
- MOST TRADED PRODUCT
- MOST PROFITABLE PRODUCT FOR EXPORT
-
5. MOST PROMISING SUPPLYING COUNTRIES
Choosing the Best Countries to Establish Your Sustainable Supply Chain
This Chapter is Available Only for the Professional Edition PRO- TOP COUNTRIES TO SOURCE YOUR PRODUCT
- TOP PRODUCING COUNTRIES
- TOP EXPORTING COUNTRIES
- LOW-COST EXPORTING COUNTRIES
-
6. MOST PROMISING OVERSEAS MARKETS
Choosing the Best Countries to Boost Your Exports
This Chapter is Available Only for the Professional Edition PRO- TOP OVERSEAS MARKETS FOR EXPORTING YOUR PRODUCT
- TOP CONSUMING MARKETS
- UNSATURATED MARKETS
- TOP IMPORTING MARKETS
- MOST PROFITABLE MARKETS
7. PRODUCTION
The Latest Trends and Insights into The Industry
- PRODUCTION VOLUME AND VALUE
8. IMPORTS
The Largest Import Supplying Countries
- IMPORTS FROM 2012–2023
- IMPORTS BY COUNTRY
- IMPORT PRICES BY COUNTRY
9. EXPORTS
The Largest Destinations for Exports
- EXPORTS FROM 2012–2023
- EXPORTS BY COUNTRY
- EXPORT PRICES BY COUNTRY
-
10. PROFILES OF MAJOR PRODUCERS
The Largest Producers on The Market and Their Profiles
This Chapter is Available Only for the Professional Edition PRO -
LIST OF TABLES
- Key Findings In 2023
- Market Volume, In Physical Terms, 2012–2023
- Market Value, 2012–2023
- Per Capita Consumption In 2012-2023
- Imports, In Physical Terms, By Country, 2012–2023
- Imports, In Value Terms, By Country, 2012–2023
- Import Prices, By Country Of Origin, 2012–2023
- Exports, In Physical Terms, By Country, 2012–2023
- Exports, In Value Terms, By Country, 2012–2023
- Export Prices, By Country Of Destination, 2012–2023
-
LIST OF FIGURES
- Market Volume, In Physical Terms, 2012–2023
- Market Value, 2012–2023
- Market Structure – Domestic Supply vs. Imports, In Physical Terms, 2012-2023
- Market Structure – Domestic Supply vs. Imports, In Value Terms, 2012-2023
- Trade Balance, In Physical Terms, 2012-2023
- Trade Balance, In Value Terms, 2012-2023
- Per Capita Consumption, 2012-2023
- Market Volume Forecast to 2030
- Market Value Forecast to 2030
- Products: Market Size And Growth, By Type
- Products: Average Per Capita Consumption, By Type
- Products: Exports And Growth, By Type
- Products: Export Prices And Growth, By Type
- Production Volume And Growth
- Exports And Growth
- Export Prices And Growth
- Market Size And Growth
- Per Capita Consumption
- Imports And Growth
- Import Prices
- Production, In Physical Terms, 2012–2023
- Production, In Value Terms, 2012–2023
- Imports, In Physical Terms, 2012–2023
- Imports, In Value Terms, 2012–2023
- Imports, In Physical Terms, By Country, 2023
- Imports, In Physical Terms, By Country, 2012–2023
- Imports, In Value Terms, By Country, 2012–2023
- Import Prices, By Country Of Origin, 2012–2023
- Exports, In Physical Terms, 2012–2023
- Exports, In Value Terms, 2012–2023
- Exports, In Physical Terms, By Country, 2023
- Exports, In Physical Terms, By Country, 2012–2023
- Exports, In Value Terms, By Country, 2012–2023
- Export Prices, By Country Of Destination, 2012–2023


