
World - Acetone - Market Analysis, Forecast, Size, Trends And Insights
Get instant access to more than 2 million reports, dashboards, and datasets on the IndexBox Platform.
View PricingAnticipated CAGR of 0.5% and Market Value of $3.1B projected for Acetone Market by 2030
IndexBox has just published a new report: World - Acetone - Market Analysis, Forecast, Size, Trends And Insights.
The article discusses the anticipated growth in acetone market volume and value from 2023 to 2030. It highlights trends in consumption, production, imports, and exports of acetone, with a focus on key countries like China, Belgium, and the United States. The report also covers per capita consumption, import and export prices, and the shifting dynamics of the global acetone market.
Market Forecast
Market Forecast
Driven by rising demand for acetone worldwide, the market is expected to start an upward consumption trend over the next seven-year period. The performance of the market is forecast to increase slightly, with an anticipated CAGR of +0.5% for the period from 2023 to 2030, which is projected to bring the market volume to 2.8M tons by the end of 2030.
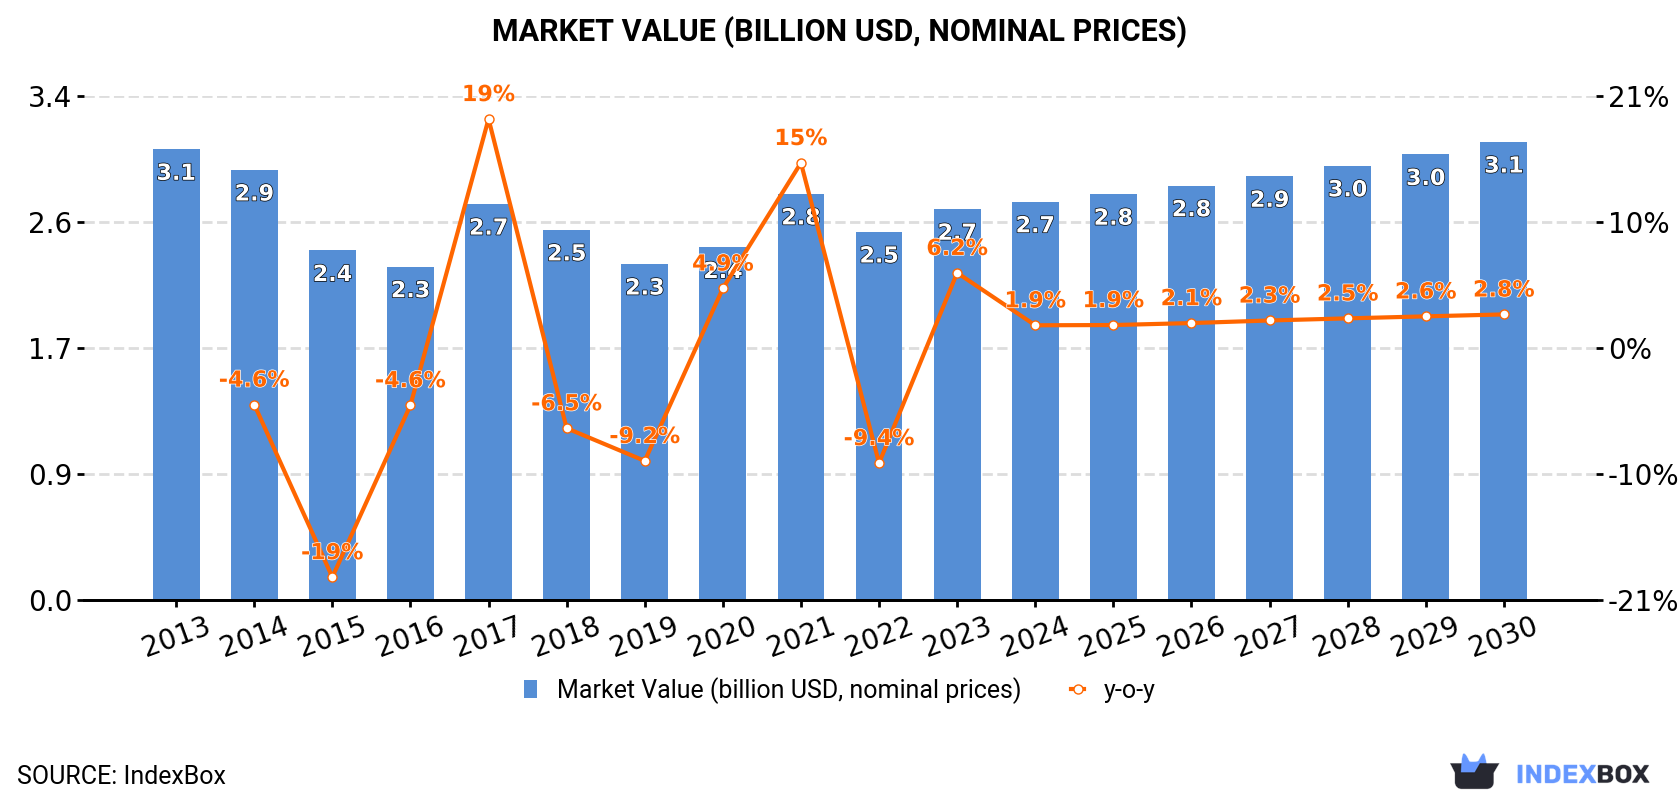
In value terms, the market is forecast to increase with an anticipated CAGR of +2.3% for the period from 2023 to 2030, which is projected to bring the market value to $3.1B (in nominal prices) by the end of 2030.
Consumption
Consumption
After three years of decline, consumption of acetone increased by 1.1% to 2.7M tons in 2023. In general, consumption, however, showed a relatively flat trend pattern. The pace of growth was the most pronounced in 2017 when the consumption volume increased by 5.1% against the previous year. Global consumption peaked at 3M tons in 2019; however, from 2020 to 2023, consumption stood at a somewhat lower figure.
The global acetone market revenue reached $2.7B in 2023, growing by 6.2% against the previous year. This figure reflects the total revenues of producers and importers (excluding logistics costs, retail marketing costs, and retailers' margins, which will be included in the final consumer price). Overall, consumption, however, continues to indicate a mild contraction. Global consumption peaked at $3.1B in 2013; however, from 2014 to 2023, consumption remained at a lower figure.
Consumption By Country
The countries with the highest volumes of consumption in 2023 were China (394K tons), Belgium (282K tons) and the United States (230K tons), together accounting for 33% of global consumption.
From 2013 to 2023, the most notable rate of growth in terms of consumption, amongst the key consuming countries, was attained by Belgium (with a CAGR of +36.3%), while consumption for the other global leaders experienced more modest paces of growth.
In value terms, the largest acetone markets worldwide were China ($301M), Belgium ($269M) and the United States ($240M), with a combined 30% share of the global market.
Belgium, with a CAGR of +35.2%, recorded the highest rates of growth with regard to market size among the main consuming countries over the period under review, while market for the other global leaders experienced more modest paces of growth.
In 2023, the highest levels of acetone per capita consumption was registered in Belgium (24 kg per person), followed by Switzerland (6.2 kg per person), Spain (4.2 kg per person) and Italy (1.8 kg per person), while the world average per capita consumption of acetone was estimated at 0.3 kg per person.
In Belgium, acetone per capita consumption increased at an average annual rate of +35.8% over the period from 2013-2023. In the other countries, the average annual rates were as follows: Switzerland (+0.7% per year) and Spain (+4.2% per year).
Production
Production
After three years of decline, production of acetone increased by 9.7% to 2.9M tons in 2023. Overall, production recorded a relatively flat trend pattern. Global production peaked at 2.9M tons in 2019; afterwards, it flattened through to 2023.
In value terms, acetone production stood at $2.8B in 2023 estimated in export price. Over the period under review, production, however, saw a relatively flat trend pattern. The most prominent rate of growth was recorded in 2017 when the production volume increased by 20% against the previous year. Over the period under review, global production reached the peak level at $3B in 2013; however, from 2014 to 2023, production failed to regain momentum.
Production By Country
The countries with the highest volumes of production in 2023 were Saudi Arabia (285K tons), Spain (272K tons) and the United States (272K tons), together comprising 28% of global production. South Korea, Germany, Belgium, Taiwan (Chinese), Thailand, Singapore, India, Russia and Japan lagged somewhat behind, together accounting for a further 55%.
From 2013 to 2023, the most notable rate of growth in terms of production, amongst the key producing countries, was attained by Germany (with a CAGR of +69.2%), while production for the other global leaders experienced more modest paces of growth.
Imports
Imports
In 2023, overseas purchases of acetone decreased by -22.4% to 1.6M tons, falling for the second consecutive year after two years of growth. Overall, imports saw a relatively flat trend pattern. The pace of growth appeared the most rapid in 2017 when imports increased by 19% against the previous year. Over the period under review, global imports attained the maximum at 2.4M tons in 2021; however, from 2022 to 2023, imports failed to regain momentum.
In value terms, acetone imports fell significantly to $1.5B in 2023. In general, imports recorded a pronounced contraction. The growth pace was the most rapid in 2017 when imports increased by 54%. Over the period under review, global imports attained the maximum at $2.4B in 2021; however, from 2022 to 2023, imports remained at a lower figure.
Imports By Country
In 2023, China (420K tons), distantly followed by Belgium (192K tons), the Netherlands (164K tons), India (117K tons) and Germany (102K tons) represented the major importers of acetone, together generating 61% of total imports. Mexico (61K tons), the United States (57K tons), Switzerland (56K tons), Italy (50K tons), Turkey (45K tons), France (34K tons), Thailand (31K tons) and Canada (26K tons) followed a long way behind the leaders.
Imports into China decreased at an average annual rate of -1.5% from 2013 to 2023. At the same time, Belgium (+7.3%), Canada (+6.3%), France (+5.0%), Italy (+4.8%), Turkey (+4.5%), the Netherlands (+2.2%) and Switzerland (+1.5%) displayed positive paces of growth. Moreover, Belgium emerged as the fastest-growing importer imported in the world, with a CAGR of +7.3% from 2013-2023. India experienced a relatively flat trend pattern. By contrast, the United States (-2.3%), Mexico (-4.1%), Thailand (-4.4%) and Germany (-6.9%) illustrated a downward trend over the same period. While the share of Belgium (+6.2 p.p.) and the Netherlands (+2.3 p.p.) increased significantly in terms of the global imports from 2013-2023, the share of Mexico (-1.7 p.p.), China (-3 p.p.) and Germany (-6 p.p.) displayed negative dynamics. The shares of the other countries remained relatively stable throughout the analyzed period.
In value terms, the largest acetone importing markets worldwide were China ($309M), Belgium ($189M) and the Netherlands ($157M), together accounting for 44% of global imports.
Belgium, with a CAGR of +6.1%, recorded the highest growth rate of the value of imports, among the main importing countries over the period under review, while purchases for the other global leaders experienced more modest paces of growth.
Import Prices By Country
In 2023, the average acetone import price amounted to $916 per ton, with an increase of 4.5% against the previous year. In general, the import price, however, recorded a perceptible downturn. The pace of growth was the most pronounced in 2020 an increase of 32%. Global import price peaked at $1,175 per ton in 2014; however, from 2015 to 2023, import prices remained at a lower figure.
Prices varied noticeably by country of destination: amid the top importers, the country with the highest price was France ($1,124 per ton), while the United States ($705 per ton) was amongst the lowest.
From 2013 to 2023, the most notable rate of growth in terms of prices was attained by Switzerland (-1.0%), while the other global leaders experienced a decline in the import price figures.
Exports
Exports
In 2023, shipments abroad of acetone decreased by -11.5% to 1.8M tons, falling for the second consecutive year after two years of growth. Overall, exports, however, saw a relatively flat trend pattern. The growth pace was the most rapid in 2017 with an increase of 19% against the previous year. Over the period under review, the global exports hit record highs at 2.5M tons in 2021; however, from 2022 to 2023, the exports failed to regain momentum.
In value terms, acetone exports dropped to $1.6B in 2023. Over the period under review, exports saw a mild decline. The pace of growth appeared the most rapid in 2017 with an increase of 56%. Over the period under review, the global exports attained the maximum at $2.4B in 2021; however, from 2022 to 2023, the exports stood at a somewhat lower figure.
Exports By Country
Saudi Arabia (254K tons), South Korea (220K tons), Taiwan (Chinese) (197K tons), Germany (195K tons), Thailand (154K tons), Belgium (126K tons), the Netherlands (124K tons), Singapore (124K tons), the United States (99K tons), Spain (81K tons) and Finland (69K tons) represented roughly 90% of total exports in 2023.
From 2013 to 2023, the biggest increases were recorded for Saudi Arabia (with a CAGR of +15.5%), while shipments for the other global leaders experienced more modest paces of growth.
In value terms, the largest acetone supplying countries worldwide were Saudi Arabia ($198M), Germany ($179M) and South Korea ($169M), with a combined 35% share of global exports. Taiwan (Chinese), Belgium, the United States, the Netherlands, Thailand, Spain, Finland and Singapore lagged somewhat behind, together comprising a further 53%.
The Netherlands, with a CAGR of +15.4%, saw the highest rates of growth with regard to the value of exports, in terms of the main exporting countries over the period under review, while shipments for the other global leaders experienced more modest paces of growth.
Export Prices By Country
In 2023, the average acetone export price amounted to $862 per ton, flattening at the previous year. Over the period under review, the export price, however, recorded a pronounced reduction. The pace of growth was the most pronounced in 2021 an increase of 37%. The global export price peaked at $1,103 per ton in 2013; however, from 2014 to 2023, the export prices stood at a somewhat lower figure.
Prices varied noticeably by country of origin: amid the top suppliers, the country with the highest price was the United States ($1,221 per ton), while Singapore ($495 per ton) was amongst the lowest.
From 2013 to 2023, the most notable rate of growth in terms of prices was attained by the Netherlands (+2.1%), while the other global leaders experienced a decline in the export price figures.
This report provides an in-depth analysis of the global acetone market. Within it, you will discover the latest data on market trends and opportunities by country, consumption, production and price developments, as well as the global trade (imports and exports). The forecast exhibits the market prospects through 2030.
Product coverage:
- Prodcom 20146211 - Acetone
Country coverage:
Worldwide - the report contains statistical data for 200 countries and includes detailed profiles of the 50 largest consuming countries:
- USA
- China
- Japan
- Germany
- United Kingdom
- France
- Brazil
- Italy
- Russian Federation
- India
- Canada
- Australia
- Republic of Korea
- Spain
- Mexico
- Indonesia
- Netherlands
- Turkey
- Saudi Arabia
- Switzerland
- Sweden
- Nigeria
- Poland
- Belgium
- Argentina
- Norway
- Austria
- Thailand
- United Arab Emirates
- Colombia
- Denmark
- South Africa
- Malaysia
- Israel
- Singapore
- Egypt
- Philippines
- Finland
- Chile
- Ireland
- Pakistan
- Greece
- Portugal
- Kazakhstan
- Algeria
- Czech Republic
- Qatar
- Peru
- Romania
- Vietnam
+ the largest producing countries
Data coverage:
- Global market volume and value
- Per Capita consumption
- Forecast of the market dynamics in the medium term
- Global production, split by region and country
- Global trade (exports and imports)
- Export and import prices
- Market trends, drivers and restraints
- Key market players and their profiles
Company coverage:
Reasons to buy this report:
- Take advantage of the latest data
- Find deeper insights into current market developments
- Discover vital success factors affecting the market
This report is designed for manufacturers, distributors, importers, and wholesalers, as well as for investors, consultants and advisors.
In this report, you can find information that helps you to make informed decisions on the following issues:
- How to diversify your business and benefit from new market opportunities
- How to load your idle production capacity
- How to boost your sales on overseas markets
- How to increase your profit margins
- How to make your supply chain more sustainable
- How to reduce your production and supply chain costs
- How to outsource production to other countries
- How to prepare your business for global expansion
While doing this research, we combine the accumulated expertise of our analysts and the capabilities of artificial intelligence. The AI-based platform, developed by our data scientists, constitutes the key working tool for business analysts, empowering them to discover deep insights and ideas from the marketing data.
-
1. INTRODUCTION
Making Data-Driven Decisions to Grow Your Business
- REPORT DESCRIPTION
- RESEARCH METHODOLOGY AND AI PLATFORM
- DATA-DRIVEN DECISIONS FOR YOUR BUSINESS
- GLOSSARY AND SPECIFIC TERMS
-
2. EXECUTIVE SUMMARY
A Quick Overview of Market Performance
- KEY FINDINGS
- MARKET TRENDS This Chapter is Available Only for the Professional Edition PRO
-
3. MARKET OVERVIEW
Understanding the Current State of The Market and Its Prospects
- MARKET SIZE
- CONSUMPTION BY COUNTRY
- MARKET FORECAST TO 2030
-
4. MOST PROMISING PRODUCT
Finding New Products to Diversify Your Business
This Chapter is Available Only for the Professional Edition PRO- TOP PRODUCTS TO DIVERSIFY YOUR BUSINESS
- BEST-SELLING PRODUCTS
- MOST CONSUMED PRODUCT
- MOST TRADED PRODUCT
- MOST PROFITABLE PRODUCT FOR EXPORT
-
5. MOST PROMISING SUPPLYING COUNTRIES
Choosing the Best Countries to Establish Your Sustainable Supply Chain
This Chapter is Available Only for the Professional Edition PRO- TOP COUNTRIES TO SOURCE YOUR PRODUCT
- TOP PRODUCING COUNTRIES
- TOP EXPORTING COUNTRIES
- LOW-COST EXPORTING COUNTRIES
-
6. MOST PROMISING OVERSEAS MARKETS
Choosing the Best Countries to Boost Your Exports
This Chapter is Available Only for the Professional Edition PRO- TOP OVERSEAS MARKETS FOR EXPORTING YOUR PRODUCT
- TOP CONSUMING MARKETS
- UNSATURATED MARKETS
- TOP IMPORTING MARKETS
- MOST PROFITABLE MARKETS
7. GLOBAL PRODUCTION
The Latest Trends and Insights into The Industry
- PRODUCTION VOLUME AND VALUE
- PRODUCTION BY COUNTRY
8. GLOBAL IMPORTS
The Largest Importers on The Market and How They Succeed
- IMPORTS FROM 2012–2023
- IMPORTS BY COUNTRY
- IMPORT PRICES BY COUNTRY
9. GLOBAL EXPORTS
The Largest Exporters on The Market and How They Succeed
- EXPORTS FROM 2012–2023
- EXPORTS BY COUNTRY
- EXPORT PRICES BY COUNTRY
-
10. PROFILES OF MAJOR PRODUCERS
The Largest Producers on The Market and Their Profiles
This Chapter is Available Only for the Professional Edition PRO -
11. COUNTRY PROFILES
The Largest Markets And Their Profiles
This Chapter is Available Only for the Professional Edition PRO- United States
- China
- Japan
- Germany
- United Kingdom
- France
- Brazil
- Italy
- Russian Federation
- India
- Canada
- Australia
- Republic of Korea
- Spain
- Mexico
- Indonesia
- Netherlands
- Turkey
- Saudi Arabia
- Switzerland
- Sweden
- Nigeria
- Poland
- Belgium
- Argentina
- Norway
- Austria
- Thailand
- United Arab Emirates
- Colombia
- Denmark
- South Africa
- Malaysia
- Israel
- Singapore
- Egypt
- Philippines
- Finland
- Chile
- Ireland
- Pakistan
- Greece
- Portugal
- Kazakhstan
- Algeria
- Czech Republic
- Qatar
- Peru
- Romania
- Vietnam
-
LIST OF TABLES
- Key Findings In 2023
- Market Volume, In Physical Terms, 2012–2023
- Market Value, 2012–2023
- Per Capita Consumption, By Country, 2018–2023
- Production, In Physical Terms, By Country, 2012–2023
- Imports, In Physical Terms, By Country, 2012–2023
- Imports, In Value Terms, By Country, 2012–2023
- Import Prices, By Country Of Destination, 2012–2023
- Exports, In Physical Terms, By Country, 2012–2023
- Exports, In Value Terms, By Country, 2012–2023
- Export Prices, By Country Of Origin, 2012–2023
-
LIST OF FIGURES
- Market Volume, In Physical Terms, 2012–2023
- Market Value, 2012–2023
- Consumption, By Country, 2023
- Market Volume Forecast to 2030
- Market Value Forecast to 2030
- Products: Market Size And Growth, By Type
- Products: Average Per Capita Consumption, By Type
- Products: Exports And Growth, By Type
- Products: Export Prices And Growth, By Type
- Production Volume And Growth
- Exports And Growth
- Export Prices And Growth
- Market Size And Growth
- Per Capita Consumption
- Imports And Growth
- Import Prices
- Production, In Physical Terms, 2012–2023
- Production, In Value Terms, 2012–2023
- Production, By Country, 2023
- Production, In Physical Terms, By Country, 2012–2023
- Imports, In Physical Terms, 2012–2023
- Imports, In Value Terms, 2012–2023
- Imports, In Physical Terms, By Country, 2023
- Imports, In Physical Terms, By Country, 2012–2023
- Imports, In Value Terms, By Country, 2012–2023
- Import Prices, By Country, 2012–2023
- Exports, In Physical Terms, 2012–2023
- Exports, In Value Terms, 2012–2023
- Exports, In Physical Terms, By Country, 2023
- Exports, In Physical Terms, By Country, 2012–2023
- Exports, In Value Terms, By Country, 2012–2023
- Export Prices, 2012–2023


