Market Size for Dog And Cat Food in the Czech Republic
The Czech dog and cat food market declined markedly to $X in 2025, waning by X% against the previous year. In general, consumption continues to indicate a relatively flat trend pattern. Dog and cat food consumption peaked at $X in 2023, and then reduced dramatically in the following year.
Production of Dog And Cat Food in the Czech Republic
In value terms, dog and cat food production rose markedly to $X in 2025 estimated in export price. Over the period under review, production enjoyed buoyant growth. The most prominent rate of growth was recorded in 2021 with an increase of X% against the previous year. Dog and cat food production peaked in 2025 and is expected to retain growth in the near future.
Exports of Dog And Cat Food
Exports from the Czech Republic
In 2025, dog and cat food exports from the Czech Republic soared to X tons, picking up by X% on 2023 figures. Over the period under review, exports recorded a strong expansion. The most prominent rate of growth was recorded in 2013 with an increase of X%. The exports peaked in 2025 and are likely to see gradual growth in years to come.
In value terms, dog and cat food exports soared to $X in 2025. In general, exports showed buoyant growth. The growth pace was the most rapid in 2013 with an increase of X%. Over the period under review, the exports attained the peak figure in 2025 and are expected to retain growth in the immediate term.
Exports by Country
Poland (X tons), the Netherlands (X tons) and Germany (X tons) were the main destinations of dog and cat food exports from the Czech Republic, with a combined X% share of total exports.
From 2012 to 2025, the most notable rate of growth in terms of shipments, amongst the main countries of destination, was attained by the Netherlands (with a CAGR of X%), while the other leaders experienced more modest paces of growth.
In value terms, the largest markets for dog and cat food exported from the Czech Republic were Germany ($X), Poland ($X) and the Netherlands ($X), with a combined X% share of total exports.
The Netherlands, with a CAGR of X%, saw the highest growth rate of the value of exports, among the main countries of destination over the period under review, while shipments for the other leaders experienced more modest paces of growth.
Export Prices by Country
In 2025, the average dog and cat food export price amounted to $X per ton, rising by X% against the previous year. In general, the export price saw a resilient increase. The pace of growth appeared the most rapid in 2023 when the average export price increased by X% against the previous year. Over the period under review, the average export prices hit record highs in 2025 and is expected to retain growth in years to come.
There were significant differences in the average prices for the major export markets. In 2025, amid the top suppliers, the country with the highest price was Germany ($X per ton), while the average price for exports to Hungary ($X per ton) was amongst the lowest.
From 2012 to 2025, the most notable rate of growth in terms of prices was recorded for supplies to Poland (X%), while the prices for the other major destinations experienced more modest paces of growth.
Imports of Dog And Cat Food
Imports into the Czech Republic
For the third year in a row, the Czech Republic recorded growth in overseas purchases of dog and cat food, which increased by X% to X tons in 2025. Overall, total imports indicated a strong expansion from 2012 to 2025: its volume increased at an average annual rate of X% over the last twelve-year period. The trend pattern, however, indicated some noticeable fluctuations being recorded throughout the analyzed period. Based on 2025 figures, imports increased by X% against 2018 indices. The most prominent rate of growth was recorded in 2018 with an increase of X% against the previous year. Over the period under review, imports hit record highs in 2025 and are likely to see gradual growth in the immediate term.
In value terms, dog and cat food imports surged to $X in 2025. In general, imports continue to indicate strong growth. The pace of growth was the most pronounced in 2023 with an increase of X% against the previous year. Imports peaked in 2025 and are expected to retain growth in the near future.
Imports by Country
Germany (X tons), Poland (X tons) and Hungary (X tons) were the main suppliers of dog and cat food imports to the Czech Republic, together comprising X% of total imports. The Netherlands, France, Italy, Slovakia, Lithuania, Spain, China, Austria and Canada lagged somewhat behind, together comprising a further X%.
From 2012 to 2025, the biggest increases were recorded for Slovakia (with a CAGR of X%), while purchases for the other leaders experienced more modest paces of growth.
In value terms, Germany ($X) constituted the largest supplier of dog and cat food to the Czech Republic, comprising X% of total imports. The second position in the ranking was held by Poland ($X), with a X% share of total imports. It was followed by the Netherlands, with a X% share.
From 2012 to 2025, the average annual rate of growth in terms of value from Germany stood at X%. The remaining supplying countries recorded the following average annual rates of imports growth: Poland (X% per year) and the Netherlands (X% per year).
Import Prices by Country
The average dog and cat food import price stood at $X per ton in 2025, growing by X% against the previous year. In general, the import price saw a resilient expansion. The pace of growth appeared the most rapid in 2019 an increase of X%. The import price peaked in 2025 and is likely to see steady growth in years to come.
There were significant differences in the average prices amongst the major supplying countries. In 2025, amid the top importers, the country with the highest price was China ($X per ton), while the price for Hungary ($X per ton) was amongst the lowest.
From 2012 to 2025, the most notable rate of growth in terms of prices was attained by Spain (X%), while the prices for the other major suppliers experienced more modest paces of growth.
Frequently Asked Questions (FAQ) :
The countries with the highest volumes of consumption in 2024 were China, the United States and India, together comprising 40% of global consumption. Pakistan, Indonesia, Brazil, Nigeria, Japan, Mexico and Bangladesh lagged somewhat behind, together comprising a further 19%.
The countries with the highest volumes of production in 2024 were China, the United States and India, together accounting for 40% of global production. Brazil, Pakistan, Indonesia, Nigeria, Japan, Mexico and France lagged somewhat behind, together accounting for a further 19%.
In value terms, Germany constituted the largest supplier of dog and cat food to the Czech Republic, comprising 40% of total imports. The second position in the ranking was held by Poland, with a 19% share of total imports. It was followed by the Netherlands, with a 14% share.
In value terms, Germany, Poland and the Netherlands were the largest markets for dog and cat food exported from the Czech Republic worldwide, with a combined 42% share of total exports.
The average dog and cat food export price stood at $2,933 per ton in 2024, with an increase of 11% against the previous year. Overall, the export price showed a prominent increase. The most prominent rate of growth was recorded in 2023 when the average export price increased by 40% against the previous year. Over the period under review, the average export prices hit record highs in 2024 and is expected to retain growth in the immediate term.
In 2024, the average dog and cat food import price amounted to $3,064 per ton, increasing by 7.5% against the previous year. In general, the import price showed a buoyant increase. The growth pace was the most rapid in 2019 an increase of 37%. The import price peaked in 2024 and is likely to see gradual growth in the near future.
This report provides a comprehensive view of the dog and cat food industry in the Czech Republic, tracking demand, supply, and trade flows across the national value chain. It explains how demand across key channels and end-use segments shapes consumption patterns, while also mapping the role of input availability, production efficiency, and regulatory standards on supply.
Beyond headline metrics, the study benchmarks prices, margins, and trade routes so you can see where value is created and how it moves between domestic suppliers and international partners. The analysis is designed to support strategic planning, market entry, portfolio prioritization, and risk management in the dog and cat food landscape in the Czech Republic.
Domestic demand is shaped by both household and industrial usage, with trade flows linking local supply to imports and exports.
Pricing dynamics reflect unit values, freight costs, exchange rates, and regulatory shifts that affect sourcing decisions.
Supply depends on input availability and production efficiency, creating a distinct national cost curve.
Market concentration varies by segment, creating different competitive landscapes and entry barriers.
The 2035 outlook highlights where capacity investment and demand growth are most aligned within the country.
Report scope
The report combines market sizing with trade intelligence and price analytics for the Czech Republic. It covers both historical performance and the forward outlook to 2035, allowing you to compare cycles, structural shifts, and policy impacts.
Market size and growth in value and volume terms
Consumption structure by end-use segments
Production capacity, output, and cost dynamics
Trade flows, exporters, importers, and balances
Price benchmarks, unit values, and margin signals
Competitive context and market entry conditions
Product coverage
Prodcom 10921030 - Dog or cat food, p.r.s.
Country coverage
Czech Republic
Country profile and benchmarks
This report provides a consistent view of market size, trade balance, prices, and per-capita indicators for the Czech Republic. The profile highlights demand structure and trade position, enabling benchmarking against regional and global peers.
Methodology
The analysis is built on a multi-source framework that combines official statistics, trade records, company disclosures, and expert validation. Data are standardized, reconciled, and cross-checked to ensure consistency across time series.
International trade data (exports, imports, and mirror statistics)
National production and consumption statistics
Company-level information from financial filings and public releases
Price series and unit value benchmarks
Analyst review, outlier checks, and time-series validation
All data are normalized to a common product definition and mapped to a consistent set of codes. This ensures that comparisons across time are aligned and actionable.
Forecasts to 2035
The forecast horizon extends to 2035 and is based on a structured model that links dog and cat food demand and supply to macroeconomic indicators, trade patterns, and sector-specific drivers. The model captures both cyclical and structural factors and reflects known policy and technology shifts in the Czech Republic.
Historical baseline: 2012-2025
Forecast horizon: 2026-2035
Scenario-based sensitivity to income growth, substitution, and regulation
Capacity and investment outlook for major producing companies
Each projection is built from national historical patterns and the broader regional context, allowing the report to show where growth is concentrated and where risks are elevated.
Price analysis and trade dynamics
Prices are analyzed in detail, including export and import unit values, regional spreads, and changes in trade costs. The report highlights how seasonality, freight rates, exchange rates, and supply disruptions influence pricing and margins.
Price benchmarks by country and sub-region
Export and import unit value trends
Seasonality and calendar effects in trade flows
Price outlook to 2035 under baseline assumptions
Profiles of market participants
Key producers, exporters, and distributors are profiled with a focus on their operational scale, geographic footprint, product mix, and market positioning. This helps identify competitive pressure points, partnership opportunities, and routes to differentiation.
Business focus and production capabilities
Geographic reach and distribution networks
Cost structure and pricing strategy indicators
Compliance, certification, and sustainability context
How to use this report
Quantify domestic demand and identify the most attractive segments
Evaluate export opportunities and prioritize target destinations
Track price dynamics and protect margins
Benchmark performance against leading competitors
Build evidence-based forecasts for investment decisions
This report is designed for manufacturers, distributors, importers, wholesalers, investors, and advisors who need a clear, data-driven picture of dog and cat food dynamics in the Czech Republic.
FAQ
What is included in the dog and cat food market in the Czech Republic?
The market size aggregates consumption and trade data, presented in both value and volume terms.
How are the forecasts to 2035 built?
The projections combine historical trends with macroeconomic indicators, trade dynamics, and sector-specific drivers.
Does the report cover prices and margins?
Yes, it includes export and import unit values, regional spreads, and a pricing outlook to 2035.
Which benchmarks are included?
The report benchmarks market size, trade balance, prices, and per-capita indicators for the Czech Republic.
Can this report support market entry decisions?
Yes, it highlights demand hotspots, trade routes, pricing trends, and competitive context.
1. INTRODUCTION
Making Data-Driven Decisions to Grow Your Business
Market Volume, In Physical Terms: Historical Data (2012–2025) and Forecast (2026–2035)
Market Value: Historical Data (2012–2025) and Forecast (2026–2035)
Per Capita Consumption: Historical Data (2012–2025) and Forecast (2026–2035)
Imports, In Physical Terms, By Country, 2012–2025
Imports, In Value Terms, By Country, 2012–2025
Import Prices, By Country, 2012–2025
Exports, In Physical Terms, By Country, 2012–2025
Exports, In Value Terms, By Country, 2012–2025
Export Prices, By Country, 2012–2025
LIST OF FIGURES
Market Volume, In Physical Terms: Historical Data (2012–2025) and Forecast (2026–2035)
Market Value: Historical Data (2012–2025) and Forecast (2026–2035)
Market Structure – Domestic Supply vs. Imports, in Physical Terms: Historical Data (2012–2025) and Forecast (2026–2035)
Market Structure – Domestic Supply vs. Imports, in Value Terms: Historical Data (2012–2025) and Forecast (2026–2035)
Trade Balance, In Physical Terms: Historical Data (2012–2025) and Forecast (2026–2035)
Trade Balance, In Value Terms: Historical Data (2012–2025) and Forecast (2026–2035)
Per Capita Consumption: Historical Data (2012–2025) and Forecast (2026–2035)
Market Volume Forecast to 2035
Market Value Forecast to 2035
Market Size and Growth, By Product
Average Per Capita Consumption, By Product
Exports and Growth, By Product
Export Prices and Growth, By Product
Production Volume and Growth
Exports and Growth
Export Prices and Growth
Market Size and Growth
Per Capita Consumption
Imports and Growth
Import Prices
Production, In Physical Terms: Historical Data (2012–2025) and Forecast (2026–2035)
Production, In Value Terms: Historical Data (2012–2025) and Forecast (2026–2035)
Imports, In Physical Terms: Historical Data (2012–2025) and Forecast (2026–2035)
Imports, In Value Terms: Historical Data (2012–2025) and Forecast (2026–2035)
Imports, In Physical Terms, By Country, 2025
Imports, In Physical Terms, By Country, 2012–2025
Imports, In Value Terms, By Country, 2012–2025
Import Prices, By Country, 2012–2025
Exports, In Physical Terms: Historical Data (2012–2025) and Forecast (2026–2035)
Exports, In Value Terms: Historical Data (2012–2025) and Forecast (2026–2035)
Exports, In Physical Terms, By Country, 2025
Exports, In Physical Terms, By Country, 2012–2025
Exports, In Value Terms, By Country, 2012–2025
Export Prices, By Country, 2012–2025
Mar 20, 2026
Oregon Legislature Cuts Funding for 100% Fish Seafood Waste Reduction Pilot
Oregon's legislature removed funding for a 100% Fish pilot project aimed at reducing seafood waste by repurposing byproducts, though supporters plan to reintroduce the proposal.
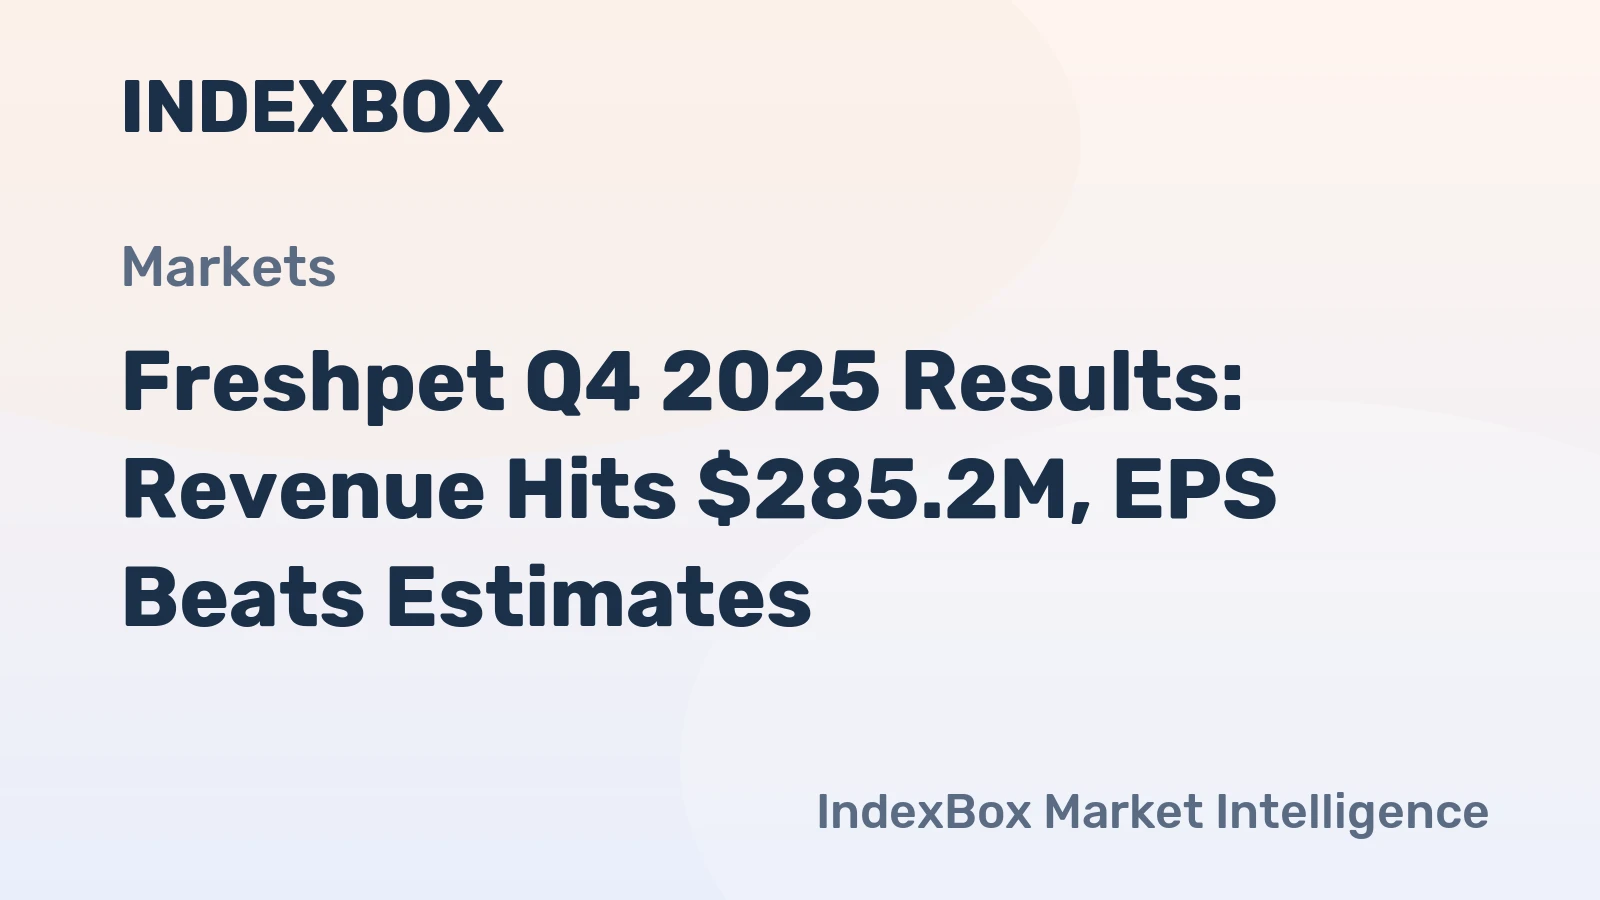
Freshpet reports strong Q4 2025 earnings with revenue growth and significant EPS beat, achieving over $1 billion in annual sales for the first time while providing its financial outlook for 2026.
New Report: AI Accelerates Packaging Circularity and Design Optimization
A 2026 industry report outlines how artificial intelligence is being used to design better packaging, sort waste, and trace materials to create a more circular economy for consumer goods.
Pet Food Market Hits $161.72 Billion, Fueled by Humanization and Premium Demand
Analysis of the $161.72 billion global pet food market in 2026, highlighting growth driven by pet humanization and premiumization, alongside key challenges like rising costs and sustainability demands.
Global Dog and Cat Food Market's Value Set for 2.0% CAGR Growth Through 2035
Global dog and cat food market to reach 103M tons and $331.4B by 2035, driven by steady demand. Key insights on consumption, production, trade, and leading countries.
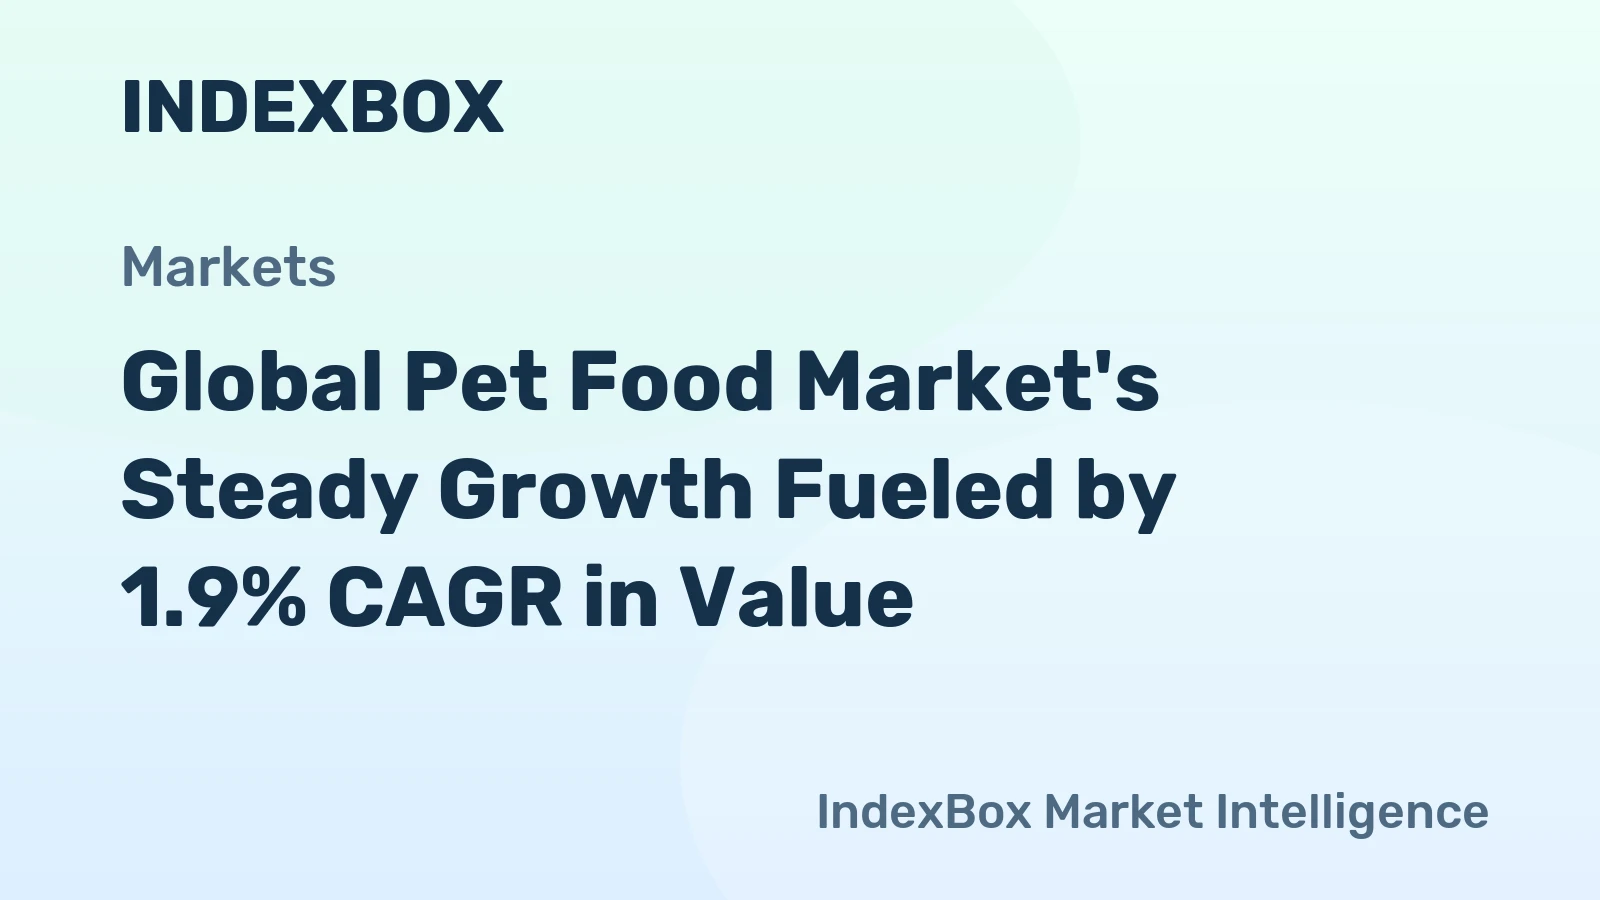
Global Pet Food Market's Steady Growth Fueled by 1.9% CAGR in Value
Global dog and cat food market analysis and forecast to 2035, covering consumption, production, trade, and key country-level insights. The market is projected to reach 97M tons and $315.2B by 2035.