
U.S. Speed Changers, Industrial High-Speed Drives, And Gear Market. Analysis And Forecast to 2030
Get instant access to more than 2 million reports, dashboards, and datasets on the IndexBox Platform.
View PricingChina's June 2023 Export of Speed Changers Decreases to $533M
U.S. Speed Changer Exports
In 2021, approx. 92K tons of speed changers, industrial high-speed drives and gear were exported from the United States; with an increase of 4.5% compared with 2020 figures. Over the period under review, exports, however, continue to indicate a noticeable curtailment. The pace of growth was the most pronounced in 2014 when exports increased by 32% against the previous year. Over the period under review, the exports hit record highs at 174K tons in 2019; however, from 2020 to 2021, the exports stood at a somewhat lower figure.
In value terms, speed changer exports soared to $3.1B (IndexBox estimates) in 2021. The total export value increased at an average annual rate of +1.4% from 2012 to 2021; however, the trend pattern remained consistent, with only minor fluctuations in certain years. The most prominent rate of growth was recorded in 2014 when exports increased by 23% against the previous year. As a result, the exports reached the peak of $3.3B. From 2015 to 2021, the growth of the exports failed to regain momentum. 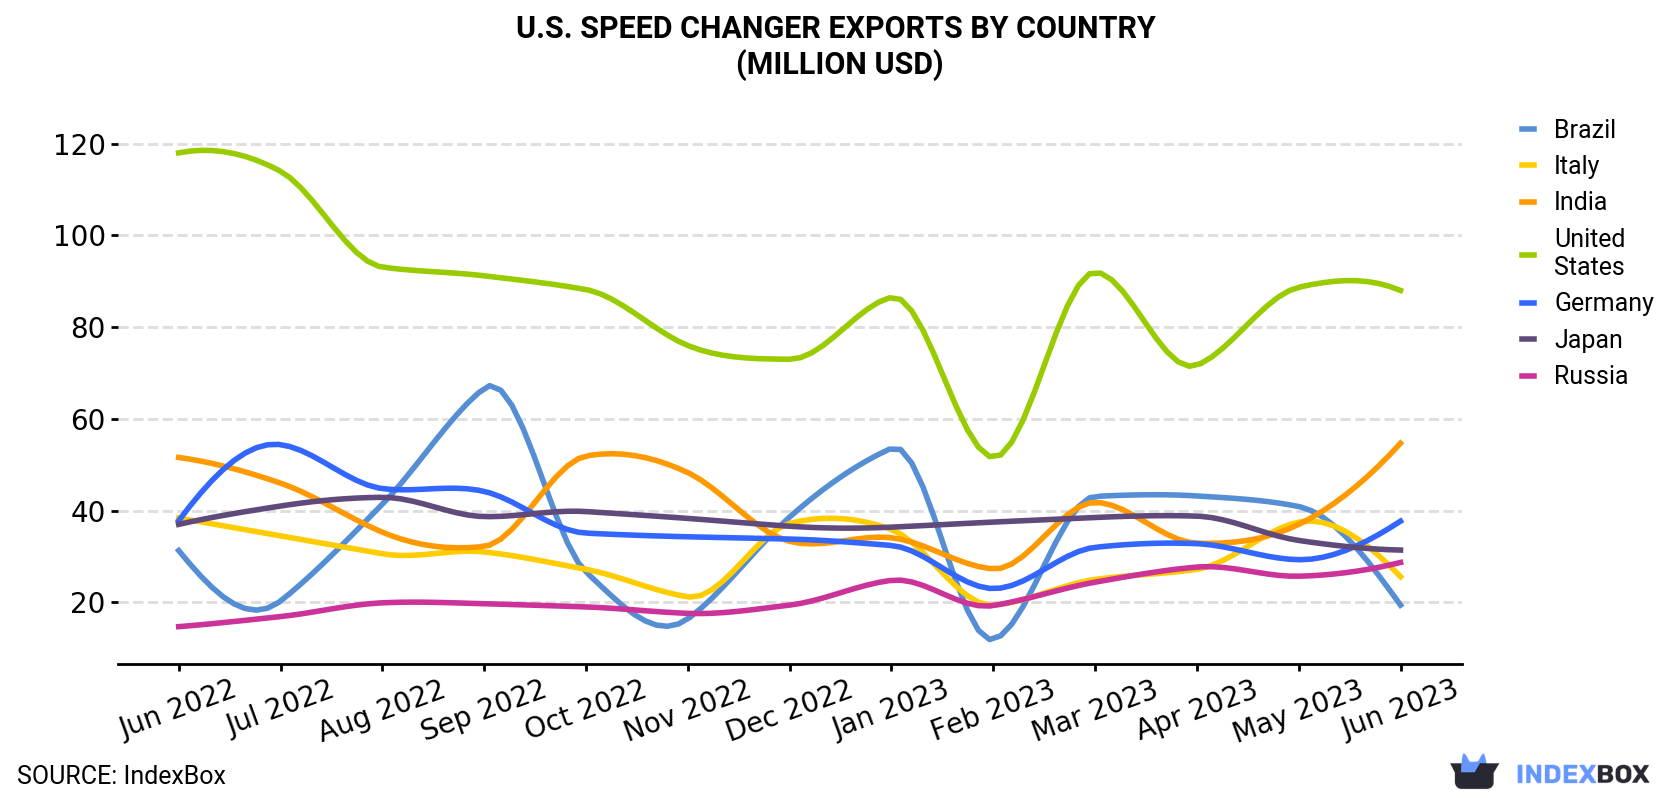
| COUNTRY | Export Value of Speed Changer in U.S. (million USD) | ||||||||||||
|---|---|---|---|---|---|---|---|---|---|---|---|---|---|
| Jun 2022 | Jul 2022 | Aug 2022 | Sep 2022 | Oct 2022 | Nov 2022 | Dec 2022 | Jan 2023 | Feb 2023 | Mar 2023 | Apr 2023 | May 2023 | Jun 2023 | |
| United States | 118 | 114 | 93.1 | 91.2 | 88.2 | 76.0 | 73.0 | 86.5 | 51.6 | 92.0 | 71.7 | 88.7 | 88.0 |
| India | 51.6 | 46.0 | 35.3 | 32.2 | 51.9 | 48.3 | 33.3 | 34.1 | 27.3 | 41.8 | 32.9 | 37.0 | 54.7 |
| Germany | 37.8 | 54.4 | 44.8 | 44.2 | 35.1 | 34.3 | 33.8 | 32.4 | 23.0 | 32.0 | 32.8 | 29.3 | 37.7 |
| Japan | 37.0 | 41.0 | 42.9 | 38.7 | 39.8 | 38.3 | 36.6 | 36.4 | 37.5 | 38.5 | 38.8 | 33.5 | 31.4 |
| Russia | 14.7 | 16.9 | 19.9 | 19.7 | 19.0 | 17.6 | 19.4 | 24.8 | 19.3 | 24.4 | 27.7 | 25.7 | 28.7 |
| Italy | 38.4 | 34.5 | 30.6 | 31.0 | 27.2 | 21.2 | 37.2 | 35.9 | 19.4 | 25.0 | 27.2 | 37.5 | 25.6 |
| Brazil | 31.3 | 20.3 | 41.4 | 66.7 | 26.6 | 16.4 | 38.6 | 53.6 | 11.9 | 43.1 | 43.2 | 40.9 | 19.4 |
| Others | 317 | 332 | 315 | 292 | 241 | 270 | 229 | 274 | 206 | 290 | 262 | 249 | 248 |
| Total | 646 | 659 | 623 | 616 | 528 | 522 | 501 | 578 | 396 | 587 | 536 | 542 | 533 |
Exports by Country
Mexico (34K tons) was the main destination for speed changer exports from the United States, with a 36% share of total exports. Moreover, speed changer exports to Mexico exceeded the volume sent to the second major destination, China (9.6K tons), threefold. The third position in this ranking was held by Canada (8.2K tons), with an 8.9% share.
From 2012 to 2021, the average annual rate of growth in terms of volume to Mexico amounted to +7.2%. Exports to the other major destinations recorded the following average annual rates of exports growth: China (+2.1% per year) and Canada (-13.8% per year).
In value terms, Canada ($983M), Mexico ($509M) and China ($242M) were the largest markets for speed changer exported from the United States worldwide, together accounting for 55% of total exports. Germany, Brazil, Chile, Australia, Belgium, Singapore, Japan, France, the UK and India lagged somewhat behind, together accounting for a further 27%.
In terms of the main countries of destination, Germany, with a CAGR of +7.7%, saw the highest rates of growth with regard to the value of exports, over the period under review, while shipments for the other leaders experienced more modest paces of growth.
Exports by Type
Toothed wheels, chain sprockets and other transmission elements (6.5K tons) was the largest type of speed changer exported from the United States, with a 79% share of total exports. Moreover, toothed wheels, chain sprockets and other transmission elements exceeded the volume of the second product type, gearboxes and speed changers (1.7K tons), fourfold.
From January 2022 to October 2022, the average monthly growth rate of the volume of export of toothed wheels, chain sprockets and other transmission elements totaled +3.7%.
In value terms, the most traded types of speed changers, industrial high-speed drives and gear in the United States were gearboxes and speed changers ($180M) and toothed wheels, chain sprockets and other transmission elements ($147M).
Gearboxes and speed changers, with a CAGR of +3.4%, recorded the highest growth rate of the value of exports, in terms of the main product categories over the period under review.
Export Prices by Country
In June 2023, the speed changer price stood at $33,989 per ton in 2021 (FOB, US), picking up by 11% against the previous year. Over the period under review, export price indicated a tangible expansion from 2012 to 2021: its price increased at an average annual rate of +4.4% over the last nine years. The trend pattern, however, indicated some noticeable fluctuations being recorded throughout the analyzed period. Based on 2021 figures, speed changer export price increased by +85.3% against 2019 indices. The most prominent rate of growth was recorded in 2020 an increase of 67%. The export price peaked in 2021 and is expected to retain growth in the immediate term.
There were significant differences in the average prices for the major overseas markets. In 2021, amid the top suppliers, the country with the highest price was Canada ($119,221 per ton), while the average price for exports to Mexico ($15,150 per ton) was amongst the lowest.
From 2012 to 2021, the most notable rate of growth in terms of prices was recorded for supplies to Canada (+20.4%), while the prices for the other major destinations experienced more modest paces of growth.
This report provides an in-depth analysis of the speed changer market in the U.S.. Within it, you will discover the latest data on market trends and opportunities by country, consumption, production and price developments, as well as the global trade (imports and exports). The forecast exhibits the market prospects through 2030.
Product coverage:
- NAICS 333612 - Speed changers, industrial high-speed drives, and gear manufacturing
Companies mentioned:
- Nord Gear Corporation
- Quad Plus
- Cone Drive Operations
- Sew-Eurodrive
- Habasit America
- Martin Sprocket & Gear
- Columbia Gear Corporation
- Amarillo Gear Company
- C G I
- Rexnord
- The Horsburgh & Scott Co
- The Gear Works Seattle
- Cotta Transmission Company
- Bunting Bearings
- Precipart Corporation
- United Gear & Assembly
- Steward Machine Co.
- Angelus Sanitary Can Machine Company
- Overton Chicago Gear Corporation
- Koellmann Gear Corporation
- Carolina Keller
- Brad Foote Gear Works
- Westerman
- Merit Gear
- Perfection Gear
- Linamar Forgings
- Thunder Basin Corporation
Country coverage:
- United States
Data coverage:
- Market volume and value
- Per Capita consumption
- Forecast of the market dynamics in the medium term
- Trade (exports and imports) in the U.S.
- Export and import prices
- Market trends, drivers and restraints
- Key market players and their profiles
Reasons to buy this report:
- Take advantage of the latest data
- Find deeper insights into current market developments
- Discover vital success factors affecting the market
This report is designed for manufacturers, distributors, importers, and wholesalers, as well as for investors, consultants and advisors.
In this report, you can find information that helps you to make informed decisions on the following issues:
- How to diversify your business and benefit from new market opportunities
- How to load your idle production capacity
- How to boost your sales on overseas markets
- How to increase your profit margins
- How to make your supply chain more sustainable
- How to reduce your production and supply chain costs
- How to outsource production to other countries
- How to prepare your business for global expansion
While doing this research, we combine the accumulated expertise of our analysts and the capabilities of artificial intelligence. The AI-based platform, developed by our data scientists, constitutes the key working tool for business analysts, empowering them to discover deep insights and ideas from the marketing data.
-
1. INTRODUCTION
Making Data-Driven Decisions to Grow Your Business
- REPORT DESCRIPTION
- RESEARCH METHODOLOGY AND AI PLATFORM
- DATA-DRIVEN DECISIONS FOR YOUR BUSINESS
- GLOSSARY AND SPECIFIC TERMS
-
2. EXECUTIVE SUMMARY
A Quick Overview of Market Performance
- KEY FINDINGS
- MARKET TRENDS This Chapter is Available Only for the Professional Edition PRO
-
3. MARKET OVERVIEW
Understanding the Current State of The Market and Its Prospects
- MARKET SIZE
- MARKET STRUCTURE
- TRADE BALANCE
- PER CAPITA CONSUMPTION
- MARKET FORECAST TO 2030
-
4. MOST PROMISING PRODUCT
Finding New Products to Diversify Your Business
This Chapter is Available Only for the Professional Edition PRO- TOP PRODUCTS TO DIVERSIFY YOUR BUSINESS
- BEST-SELLING PRODUCTS
- MOST CONSUMED PRODUCT
- MOST TRADED PRODUCT
- MOST PROFITABLE PRODUCT FOR EXPORT
-
5. MOST PROMISING SUPPLYING COUNTRIES
Choosing the Best Countries to Establish Your Sustainable Supply Chain
This Chapter is Available Only for the Professional Edition PRO- TOP COUNTRIES TO SOURCE YOUR PRODUCT
- TOP PRODUCING COUNTRIES
- TOP EXPORTING COUNTRIES
- LOW-COST EXPORTING COUNTRIES
-
6. MOST PROMISING OVERSEAS MARKETS
Choosing the Best Countries to Boost Your Exports
This Chapter is Available Only for the Professional Edition PRO- TOP OVERSEAS MARKETS FOR EXPORTING YOUR PRODUCT
- TOP CONSUMING MARKETS
- UNSATURATED MARKETS
- TOP IMPORTING MARKETS
- MOST PROFITABLE MARKETS
7. PRODUCTION
The Latest Trends and Insights into The Industry
- PRODUCTION VOLUME AND VALUE
8. IMPORTS
The Largest Import Supplying Countries
- IMPORTS FROM 2012–2023
- IMPORTS BY COUNTRY
- IMPORT PRICES BY COUNTRY
9. EXPORTS
The Largest Destinations for Exports
- EXPORTS FROM 2012–2023
- EXPORTS BY COUNTRY
- EXPORT PRICES BY COUNTRY
-
10. PROFILES OF MAJOR PRODUCERS
The Largest Producers on The Market and Their Profiles
This Chapter is Available Only for the Professional Edition PRO -
LIST OF TABLES
- Key Findings In 2023
- Market Volume, In Physical Terms, 2012–2023
- Market Value, 2012–2023
- Per Capita Consumption In 2012-2023
- Imports, In Physical Terms, By Country, 2012–2023
- Imports, In Value Terms, By Country, 2012–2023
- Import Prices, By Country Of Origin, 2012–2023
- Exports, In Physical Terms, By Country, 2012–2023
- Exports, In Value Terms, By Country, 2012–2023
- Export Prices, By Country Of Destination, 2012–2023
-
LIST OF FIGURES
- Market Volume, In Physical Terms, 2012–2023
- Market Value, 2012–2023
- Market Structure – Domestic Supply vs. Imports, In Physical Terms, 2012-2023
- Market Structure – Domestic Supply vs. Imports, In Value Terms, 2012-2023
- Trade Balance, In Physical Terms, 2012-2023
- Trade Balance, In Value Terms, 2012-2023
- Per Capita Consumption, 2012-2023
- Market Volume Forecast to 2030
- Market Value Forecast to 2030
- Products: Market Size And Growth, By Type
- Products: Average Per Capita Consumption, By Type
- Products: Exports And Growth, By Type
- Products: Export Prices And Growth, By Type
- Production Volume And Growth
- Exports And Growth
- Export Prices And Growth
- Market Size And Growth
- Per Capita Consumption
- Imports And Growth
- Import Prices
- Production, In Physical Terms, 2012–2023
- Production, In Value Terms, 2012–2023
- Imports, In Physical Terms, 2012–2023
- Imports, In Value Terms, 2012–2023
- Imports, In Physical Terms, By Country, 2023
- Imports, In Physical Terms, By Country, 2012–2023
- Imports, In Value Terms, By Country, 2012–2023
- Import Prices, By Country Of Origin, 2012–2023
- Exports, In Physical Terms, 2012–2023
- Exports, In Value Terms, 2012–2023
- Exports, In Physical Terms, By Country, 2023
- Exports, In Physical Terms, By Country, 2012–2023
- Exports, In Value Terms, By Country, 2012–2023
- Export Prices, By Country Of Destination, 2012–2023


