U.S. - Soap And Detergent - Market Analysis, Forecast, Size, Trends And Insights
Get instant access to more than 2 million reports, dashboards, and datasets on the IndexBox Platform.
View PricingJuly 2023 Witnessed a 6% Drop in U.S. Soap and Detergent Exports, Amounting to $408M
U.S. Soap And Detergent Exports
In July 2023, the amount of soap and detergents exported from the United States fell to 125K tons, with a decrease of -6.5% on June 2023 figures. Over the period under review, exports recorded a mild contraction. The most prominent rate of growth was recorded in March 2023 with an increase of 16% m-o-m.
In value terms, soap and detergent exports declined to $408M (IndexBox estimates) in July 2023. Overall, exports recorded a mild descent. The most prominent rate of growth was recorded in March 2023 when exports increased by 23% against the previous month. As a result, the exports reached the peak of $495M. From April 2023 to July 2023, the growth of the exports failed to regain momentum. 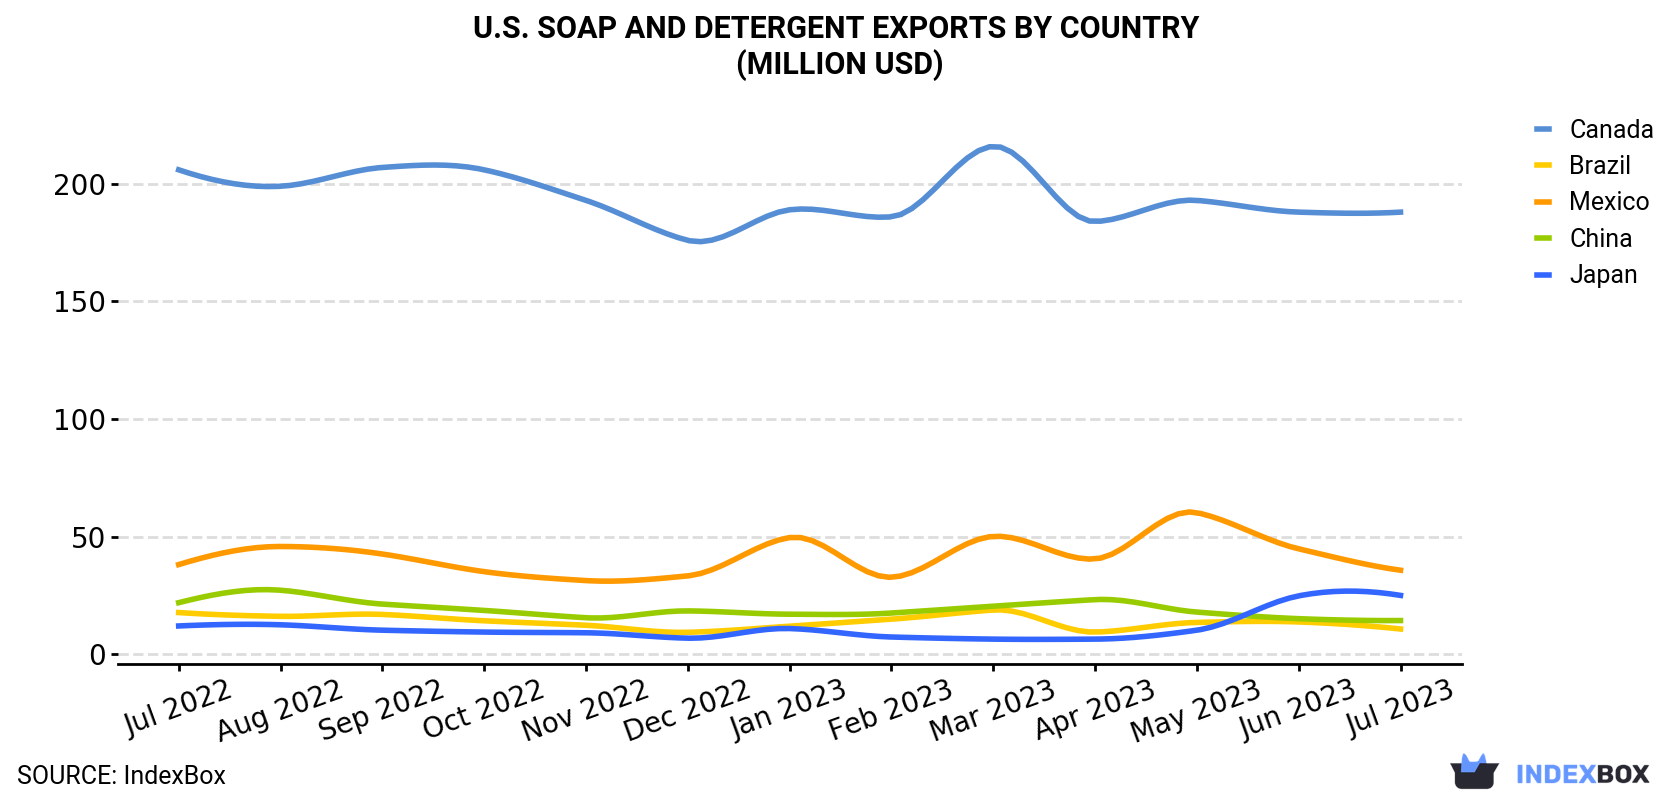
| COUNTRY | Export Value of Soap And Detergent in U.S. (million USD) | ||||||||||||
|---|---|---|---|---|---|---|---|---|---|---|---|---|---|
| Jul 2022 | Aug 2022 | Sep 2022 | Oct 2022 | Nov 2022 | Dec 2022 | Jan 2023 | Feb 2023 | Mar 2023 | Apr 2023 | May 2023 | Jun 2023 | Jul 2023 | |
| Canada | 206 | 199 | 207 | 206 | 193 | 176 | 189 | 186 | 216 | 184 | 193 | 188 | 188 |
| Mexico | 38.1 | 45.8 | 42.6 | 35.1 | 31.3 | 33.3 | 49.6 | 32.7 | 50.1 | 40.5 | 60.2 | 44.8 | 35.7 |
| Japan | 12.0 | 12.5 | 10.2 | 9.4 | 9.1 | 6.8 | 10.9 | 7.3 | 6.4 | 6.4 | 10.2 | 24.8 | 25.0 |
| China | 21.9 | 27.2 | 21.3 | 18.6 | 15.5 | 18.4 | 17.0 | 17.5 | 20.4 | 23.2 | 17.9 | 15.1 | 14.3 |
| Brazil | 17.7 | 16.1 | 16.9 | 14.2 | 12.3 | 9.3 | 11.9 | 14.9 | 18.8 | 9.4 | 13.5 | 13.7 | 10.7 |
| Others | 177 | 184 | 195 | 179 | 172 | 179 | 154 | 144 | 184 | 155 | 155 | 149 | 135 |
| Total | 472 | 484 | 493 | 462 | 433 | 423 | 433 | 403 | 495 | 419 | 450 | 436 | 408 |
Exports by Country
Canada (73K tons) was the main destination for soap and detergent exports from the United States, with a 58% share of total exports. Moreover, soap and detergent exports to Canada exceeded the volume sent to the second major destination, Mexico (13K tons), sixfold. The third position in this ranking was held by Brazil (2.6K tons), with a 2.1% share.
From July 2022 to July 2023, the average monthly rate of growth in terms of volume to Canada was relatively modest. Exports to the other major destinations recorded the following average monthly rates of exports growth: Mexico (+0.3% per month) and Brazil (-5.5% per month).
In value terms, Canada ($188M) remains the key foreign market for soap and detergent exports from the United States, comprising 46% of total exports. The second position in the ranking was held by Mexico ($36M), with an 8.7% share of total exports. It was followed by Japan, with a 6.1% share.
From July 2022 to July 2023, the average monthly rate of growth in terms of value to Canada was relatively modest. Exports to the other major destinations recorded the following average monthly rates of exports growth: Mexico (-0.5% per month) and Japan (+6.3% per month).
Exports by Type
Non-soap washing and cleaning preparations (100K tons) was the largest type of soap and detergent exported from the United States, accounting for a 80% share of total exports. Moreover, non-soap washing and cleaning preparations exceeded the volume of the second product type, soap (25K tons), fourfold.
From July 2022 to July 2023, the average monthly growth rate of the volume of export of non-soap washing and cleaning preparations stood at -1.6%.
In value terms, non-soap washing and cleaning preparations ($318M) remains the largest type of soap and detergent exported from the United States, comprising 78% of total exports. The second position in the ranking was taken by soap ($90M), with a 22% share of total exports.
From July 2022 to July 2023, the average monthly growth rate of the export volume of non-soap washing and cleaning preparations totaled -1.4%.
Export Prices by Country
In July 2023, the soap and detergent price amounted to $3,268 per ton (FOB, US), remaining stable against the previous month. Overall, the export price showed a relatively flat trend pattern. The pace of growth was the most pronounced in December 2022 an increase of 11% m-o-m. As a result, the export price reached the peak level of $3,696 per ton. From January 2023 to July 2023, the the average export prices remained at a lower figure.
Prices varied noticeably by the country of destination: the country with the highest price was Japan ($12,371 per ton), while the average price for exports to Malaysia ($956 per ton) was amongst the lowest.
From July 2022 to July 2023, the most notable rate of growth in terms of prices was recorded for supplies to Japan (+12.3%), while the prices for the other major destinations experienced more modest paces of growth.
This report provides an in-depth analysis of the soap and detergent market in the U.S.. Within it, you will discover the latest data on market trends and opportunities by country, consumption, production and price developments, as well as the global trade (imports and exports). The forecast exhibits the market prospects through 2030.
Product coverage:
- Prodcom 20413120 - Soap and organic surface-active products in bars, etc., n.e.c.
- Prodcom 20413150 - Soap in the form of flakes, wafers, granules or powders
- Prodcom 20413180 - Soap in forms excluding bars, cakes or moulded shapes, p aper, wadding, felt and non-wovens impregnated or coated with soap/detergent, flakes, granules or powders
- Prodcom 20421915 - Soap and organic surface-active products in bars, etc., for toilet use
- Prodcom 20421930 - Organic surface-active products and preparations for washing the skin, whether or not containing soap, p.r.s.
- Prodcom 20413240 - Surface-active preparations, whether or not containing soap, p .r.s. (excluding those for use as soap)
- Prodcom 20413250 - Washing preparations and cleaning preparations, with or without soap, p.r.s. including auxiliary washing preparations excluding those for use as soap, surface-active preparations
- Prodcom 20413260 - Surface-active preparations, whether or not containing soap, n .p.r.s. (excluding those for use as soap)
- Prodcom 20413270 - Washing preparations and cleaning preparations, with or without soap, n.p.r.s. including auxiliary washing preparations excluding those for use as soap, surface-active preparations
- Prodcom 20421850 - Dentifrices (including toothpaste, denture cleaners)
- Prodcom 20411000 - Glycerol (glycerine), crude, glycerol waters and glycerol lyes
Country coverage:
- United States
Data coverage:
- Market volume and value
- Per Capita consumption
- Forecast of the market dynamics in the medium term
- Trade (exports and imports) in the U.S.
- Export and import prices
- Market trends, drivers and restraints
- Key market players and their profiles
Reasons to buy this report:
- Take advantage of the latest data
- Find deeper insights into current market developments
- Discover vital success factors affecting the market
This report is designed for manufacturers, distributors, importers, and wholesalers, as well as for investors, consultants and advisors.
In this report, you can find information that helps you to make informed decisions on the following issues:
- How to diversify your business and benefit from new market opportunities
- How to load your idle production capacity
- How to boost your sales on overseas markets
- How to increase your profit margins
- How to make your supply chain more sustainable
- How to reduce your production and supply chain costs
- How to outsource production to other countries
- How to prepare your business for global expansion
While doing this research, we combine the accumulated expertise of our analysts and the capabilities of artificial intelligence. The AI-based platform, developed by our data scientists, constitutes the key working tool for business analysts, empowering them to discover deep insights and ideas from the marketing data.
-
1. INTRODUCTION
Making Data-Driven Decisions to Grow Your Business
- REPORT DESCRIPTION
- RESEARCH METHODOLOGY AND AI PLATFORM
- DATA-DRIVEN DECISIONS FOR YOUR BUSINESS
- GLOSSARY AND SPECIFIC TERMS
-
2. EXECUTIVE SUMMARY
A Quick Overview of Market Performance
- KEY FINDINGS
- MARKET TRENDS This Chapter is Available Only for the Professional Edition PRO
-
3. MARKET OVERVIEW
Understanding the Current State of The Market and Its Prospects
- MARKET SIZE
- MARKET STRUCTURE
- TRADE BALANCE
- PER CAPITA CONSUMPTION
- MARKET FORECAST TO 2030
-
4. MOST PROMISING PRODUCT
Finding New Products to Diversify Your Business
This Chapter is Available Only for the Professional Edition PRO- TOP PRODUCTS TO DIVERSIFY YOUR BUSINESS
- BEST-SELLING PRODUCTS
- MOST CONSUMED PRODUCT
- MOST TRADED PRODUCT
- MOST PROFITABLE PRODUCT FOR EXPORT
-
5. MOST PROMISING SUPPLYING COUNTRIES
Choosing the Best Countries to Establish Your Sustainable Supply Chain
This Chapter is Available Only for the Professional Edition PRO- TOP COUNTRIES TO SOURCE YOUR PRODUCT
- TOP PRODUCING COUNTRIES
- TOP EXPORTING COUNTRIES
- LOW-COST EXPORTING COUNTRIES
-
6. MOST PROMISING OVERSEAS MARKETS
Choosing the Best Countries to Boost Your Exports
This Chapter is Available Only for the Professional Edition PRO- TOP OVERSEAS MARKETS FOR EXPORTING YOUR PRODUCT
- TOP CONSUMING MARKETS
- UNSATURATED MARKETS
- TOP IMPORTING MARKETS
- MOST PROFITABLE MARKETS
7. PRODUCTION
The Latest Trends and Insights into The Industry
- PRODUCTION VOLUME AND VALUE
8. IMPORTS
The Largest Import Supplying Countries
- IMPORTS FROM 2012–2023
- IMPORTS BY COUNTRY
- IMPORT PRICES BY COUNTRY
9. EXPORTS
The Largest Destinations for Exports
- EXPORTS FROM 2012–2023
- EXPORTS BY COUNTRY
- EXPORT PRICES BY COUNTRY
-
10. PROFILES OF MAJOR PRODUCERS
The Largest Producers on The Market and Their Profiles
This Chapter is Available Only for the Professional Edition PRO -
LIST OF TABLES
- Key Findings In 2023
- Market Volume, In Physical Terms, 2012–2023
- Market Value, 2012–2023
- Per Capita Consumption In 2012-2023
- Imports, In Physical Terms, By Country, 2012–2023
- Imports, In Value Terms, By Country, 2012–2023
- Import Prices, By Country Of Origin, 2012–2023
- Exports, In Physical Terms, By Country, 2012–2023
- Exports, In Value Terms, By Country, 2012–2023
- Export Prices, By Country Of Destination, 2012–2023
-
LIST OF FIGURES
- Market Volume, In Physical Terms, 2012–2023
- Market Value, 2012–2023
- Market Structure – Domestic Supply vs. Imports, In Physical Terms, 2012-2023
- Market Structure – Domestic Supply vs. Imports, In Value Terms, 2012-2023
- Trade Balance, In Physical Terms, 2012-2023
- Trade Balance, In Value Terms, 2012-2023
- Per Capita Consumption, 2012-2023
- Market Volume Forecast to 2030
- Market Value Forecast to 2030
- Products: Market Size And Growth, By Type
- Products: Average Per Capita Consumption, By Type
- Products: Exports And Growth, By Type
- Products: Export Prices And Growth, By Type
- Production Volume And Growth
- Exports And Growth
- Export Prices And Growth
- Market Size And Growth
- Per Capita Consumption
- Imports And Growth
- Import Prices
- Production, In Physical Terms, 2012–2023
- Production, In Value Terms, 2012–2023
- Imports, In Physical Terms, 2012–2023
- Imports, In Value Terms, 2012–2023
- Imports, In Physical Terms, By Country, 2023
- Imports, In Physical Terms, By Country, 2012–2023
- Imports, In Value Terms, By Country, 2012–2023
- Import Prices, By Country Of Origin, 2012–2023
- Exports, In Physical Terms, 2012–2023
- Exports, In Value Terms, 2012–2023
- Exports, In Physical Terms, By Country, 2023
- Exports, In Physical Terms, By Country, 2012–2023
- Exports, In Value Terms, By Country, 2012–2023
- Export Prices, By Country Of Destination, 2012–2023


