
U.S. Small Electrical Appliance Market. Analysis And Forecast to 2030
Get instant access to more than 2 million reports, dashboards, and datasets on the IndexBox Platform.
View PricingAugust 2023 Sees a $1.6B Surge in Small Electrical Appliance Imports to the United States
U.S. Small Electrical Appliance Imports
In August 2023, imports of small electrical appliances into the United States surged to 152M units, jumping by 28% compared with July 2023. Overall, total imports indicated mild growth from August 2022 to August 2023: its volume increased at an average monthly rate of +1.2% over the last twelve-month period. The trend pattern, however, indicated some noticeable fluctuations being recorded throughout the analyzed period. Based on August 2023 figures, imports increased by +55.5% against June 2023 indices. As a result, imports attained the peak and are likely to continue growth in the immediate term.
In value terms, small electrical appliance imports surged to $1.6B (IndexBox estimates) in August 2023. In general, imports, however, showed a mild shrinkage. Over the period under review, imports reached the peak figure at 1.8B units in August 2022; however, from September 2022 to August 2023, imports remained at a lower figure.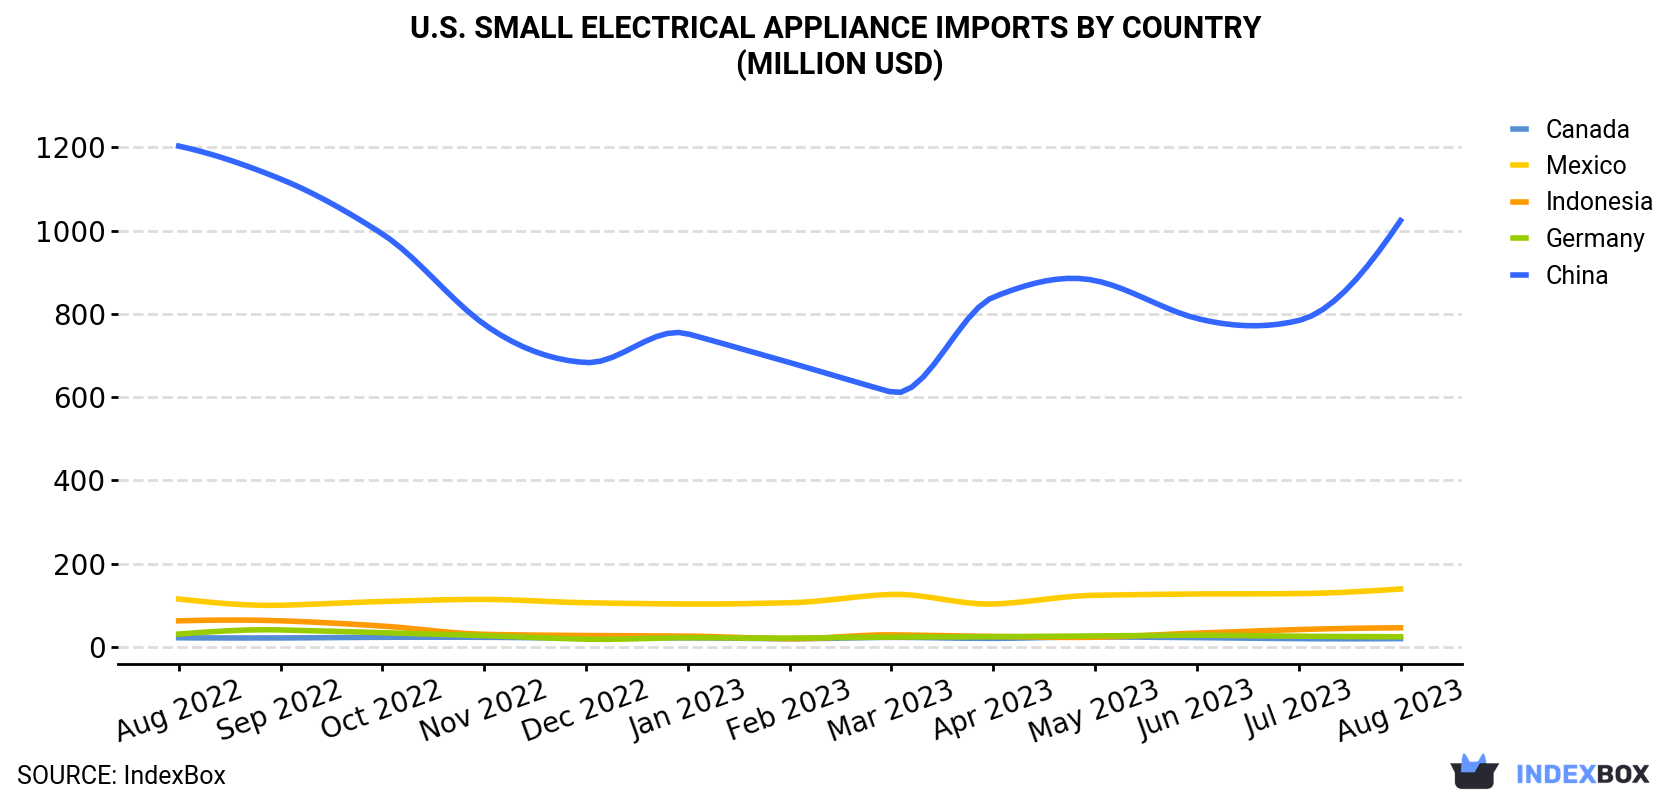
| COUNTRY | Import Value of Small Electrical Appliance in U.S. (million USD) | ||||||||||||
|---|---|---|---|---|---|---|---|---|---|---|---|---|---|
| Aug 2022 | Sep 2022 | Oct 2022 | Nov 2022 | Dec 2022 | Jan 2023 | Feb 2023 | Mar 2023 | Apr 2023 | May 2023 | Jun 2023 | Jul 2023 | Aug 2023 | |
| China | 1,203 | 1,124 | 992 | 775 | 683 | 752 | 683 | 612 | 840 | 880 | 789 | 784 | 1,024 |
| Mexico | 115 | 100 | 109 | 114 | 106 | 103 | 106 | 126 | 103 | 124 | 127 | 128 | 139 |
| Indonesia | 62.5 | 62.6 | 50.0 | 30.2 | 27.3 | 25.8 | 19.5 | 28.8 | 25.2 | 23.2 | 33.0 | 41.6 | 45.9 |
| Germany | 30.8 | 40.7 | 34.1 | 27.0 | 18.5 | 22.0 | 21.1 | 23.4 | 24.4 | 26.3 | 27.8 | 25.6 | 24.3 |
| Canada | 21.8 | 21.5 | 23.0 | 23.0 | 21.0 | 21.8 | 19.7 | 22.8 | 20.5 | 23.9 | 22.2 | 19.8 | 19.8 |
| Others | 359 | 320 | 364 | 290 | 219 | 238 | 221 | 279 | 265 | 260 | 266 | 294 | 304 |
| Total | 1,792 | 1,669 | 1,572 | 1,259 | 1,074 | 1,163 | 1,070 | 1,092 | 1,279 | 1,338 | 1,265 | 1,293 | 1,556 |
Imports by Country
In August 2023, China (120M units) constituted the largest supplier of small electrical appliance to the United States, with a 79% share of total imports. Moreover, small electrical appliance imports from China exceeded the figures recorded by the second-largest supplier, Mexico (6.8M units), more than tenfold. The third position in this ranking was taken by Canada (5.4M units), with a 3.6% share.
From August 2022 to August 2023, the average monthly growth rate of volume from China amounted to +2.1%. The remaining supplying countries recorded the following average monthly rates of imports growth: Mexico (+0.2% per month) and Canada (-6.6% per month).
In value terms, China ($1B) constituted the largest supplier of small electrical appliance to the United States, comprising 66% of total imports. The second position in the ranking was taken by Mexico ($139M), with an 8.9% share of total imports. It was followed by Indonesia, with a 2.9% share.
From August 2022 to August 2023, the average monthly growth rate of value from China amounted to -1.3%. The remaining supplying countries recorded the following average monthly rates of imports growth: Mexico (+1.6% per month) and Indonesia (-2.5% per month).
Import Prices by Country
In August 2023, the small electrical appliance price stood at $10.3 per unit (CIF, US), dropping by -6.1% against the previous month. In general, the import price saw a perceptible setback. The most prominent rate of growth was recorded in September 2022 when the average import price increased by 10% month-to-month. The import price peaked at $15.6 per unit in October 2022; however, from November 2022 to August 2023, import prices stood at a somewhat lower figure.
There were significant differences in the average prices amongst the major supplying countries. In August 2023, the country with the highest price was Vietnam ($24.9 per unit), while the price for Canada ($3.6 per unit) was amongst the lowest.
From August 2022 to August 2023, the most notable rate of growth in terms of prices was attained by Canada (+6.3%), while the prices for the other major suppliers experienced more modest paces of growth.
This report provides an in-depth analysis of the small electrical appliance market in the U.S.. Within it, you will discover the latest data on market trends and opportunities by country, consumption, production and price developments, as well as the global trade (imports and exports). The forecast exhibits the market prospects through 2030.
Product coverage:
- NAICS 335210 - Small electrical appliance manufacturing
Companies mentioned:
- Conair Corporation
- Nacco Industries
- Dyson
- Hamilton Beach Brands
- Helen of Troy
- Delta T Corporation
- Karcher North America
- Broan-Nutone
- The Kirby Sales Company
- Tacony Corporation
- Regal Ware
- Edgecraft Corporation
- Fanimation, Rexair
- E.G.O. North America
- The Metal Ware Corporation
- Tutco
- Trantech Radiator Products
- Turbochef Technologies
- Ad Corporation
- Edwards Vacuum
- Ceramaspeed
- Bath Solutions
- Bissell Homecare
- Applica Consumer Products
- Midwest Energy Cooperativ
- Housewares Holding Company
- Russell Hobbs
- Rexair Holdings
- BHSF
- Western/Scott Fetzer Company
Country coverage:
- United States
Data coverage:
- Market volume and value
- Per Capita consumption
- Forecast of the market dynamics in the medium term
- Trade (exports and imports) in the U.S.
- Export and import prices
- Market trends, drivers and restraints
- Key market players and their profiles
Reasons to buy this report:
- Take advantage of the latest data
- Find deeper insights into current market developments
- Discover vital success factors affecting the market
This report is designed for manufacturers, distributors, importers, and wholesalers, as well as for investors, consultants and advisors.
In this report, you can find information that helps you to make informed decisions on the following issues:
- How to diversify your business and benefit from new market opportunities
- How to load your idle production capacity
- How to boost your sales on overseas markets
- How to increase your profit margins
- How to make your supply chain more sustainable
- How to reduce your production and supply chain costs
- How to outsource production to other countries
- How to prepare your business for global expansion
While doing this research, we combine the accumulated expertise of our analysts and the capabilities of artificial intelligence. The AI-based platform, developed by our data scientists, constitutes the key working tool for business analysts, empowering them to discover deep insights and ideas from the marketing data.
-
1. INTRODUCTION
Making Data-Driven Decisions to Grow Your Business
- REPORT DESCRIPTION
- RESEARCH METHODOLOGY AND AI PLATFORM
- DATA-DRIVEN DECISIONS FOR YOUR BUSINESS
- GLOSSARY AND SPECIFIC TERMS
-
2. EXECUTIVE SUMMARY
A Quick Overview of Market Performance
- KEY FINDINGS
- MARKET TRENDS This Chapter is Available Only for the Professional Edition PRO
-
3. MARKET OVERVIEW
Understanding the Current State of The Market and Its Prospects
- MARKET SIZE
- MARKET STRUCTURE
- TRADE BALANCE
- PER CAPITA CONSUMPTION
- MARKET FORECAST TO 2030
-
4. MOST PROMISING PRODUCT
Finding New Products to Diversify Your Business
This Chapter is Available Only for the Professional Edition PRO- TOP PRODUCTS TO DIVERSIFY YOUR BUSINESS
- BEST-SELLING PRODUCTS
- MOST CONSUMED PRODUCT
- MOST TRADED PRODUCT
- MOST PROFITABLE PRODUCT FOR EXPORT
-
5. MOST PROMISING SUPPLYING COUNTRIES
Choosing the Best Countries to Establish Your Sustainable Supply Chain
This Chapter is Available Only for the Professional Edition PRO- TOP COUNTRIES TO SOURCE YOUR PRODUCT
- TOP PRODUCING COUNTRIES
- TOP EXPORTING COUNTRIES
- LOW-COST EXPORTING COUNTRIES
-
6. MOST PROMISING OVERSEAS MARKETS
Choosing the Best Countries to Boost Your Exports
This Chapter is Available Only for the Professional Edition PRO- TOP OVERSEAS MARKETS FOR EXPORTING YOUR PRODUCT
- TOP CONSUMING MARKETS
- UNSATURATED MARKETS
- TOP IMPORTING MARKETS
- MOST PROFITABLE MARKETS
7. PRODUCTION
The Latest Trends and Insights into The Industry
- PRODUCTION VOLUME AND VALUE
8. IMPORTS
The Largest Import Supplying Countries
- IMPORTS FROM 2012–2023
- IMPORTS BY COUNTRY
- IMPORT PRICES BY COUNTRY
9. EXPORTS
The Largest Destinations for Exports
- EXPORTS FROM 2012–2023
- EXPORTS BY COUNTRY
- EXPORT PRICES BY COUNTRY
-
10. PROFILES OF MAJOR PRODUCERS
The Largest Producers on The Market and Their Profiles
This Chapter is Available Only for the Professional Edition PRO -
LIST OF TABLES
- Key Findings In 2023
- Market Volume, In Physical Terms, 2012–2023
- Market Value, 2012–2023
- Per Capita Consumption In 2012-2023
- Imports, In Physical Terms, By Country, 2012–2023
- Imports, In Value Terms, By Country, 2012–2023
- Import Prices, By Country Of Origin, 2012–2023
- Exports, In Physical Terms, By Country, 2012–2023
- Exports, In Value Terms, By Country, 2012–2023
- Export Prices, By Country Of Destination, 2012–2023
-
LIST OF FIGURES
- Market Volume, In Physical Terms, 2012–2023
- Market Value, 2012–2023
- Market Structure – Domestic Supply vs. Imports, In Physical Terms, 2012-2023
- Market Structure – Domestic Supply vs. Imports, In Value Terms, 2012-2023
- Trade Balance, In Physical Terms, 2012-2023
- Trade Balance, In Value Terms, 2012-2023
- Per Capita Consumption, 2012-2023
- Market Volume Forecast to 2030
- Market Value Forecast to 2030
- Products: Market Size And Growth, By Type
- Products: Average Per Capita Consumption, By Type
- Products: Exports And Growth, By Type
- Products: Export Prices And Growth, By Type
- Production Volume And Growth
- Exports And Growth
- Export Prices And Growth
- Market Size And Growth
- Per Capita Consumption
- Imports And Growth
- Import Prices
- Production, In Physical Terms, 2012–2023
- Production, In Value Terms, 2012–2023
- Imports, In Physical Terms, 2012–2023
- Imports, In Value Terms, 2012–2023
- Imports, In Physical Terms, By Country, 2023
- Imports, In Physical Terms, By Country, 2012–2023
- Imports, In Value Terms, By Country, 2012–2023
- Import Prices, By Country Of Origin, 2012–2023
- Exports, In Physical Terms, 2012–2023
- Exports, In Value Terms, 2012–2023
- Exports, In Physical Terms, By Country, 2023
- Exports, In Physical Terms, By Country, 2012–2023
- Exports, In Value Terms, By Country, 2012–2023
- Export Prices, By Country Of Destination, 2012–2023


