
U.S. Sanitary Paper Product Market. Analysis And Forecast to 2030
Get instant access to more than 2 million reports, dashboards, and datasets on the IndexBox Platform.
View PricingJuly 2023 Sees An All-time High of $287M Worth of Sanitary Paper Product Imports in the United States.
U.S. Sanitary Paper Product Imports
In July 2023, the amount of sanitary paper product imported into the United States totaled 96K tons, standing approximately at the month before. Overall, imports saw a relatively flat trend pattern. The most prominent rate of growth was recorded in April 2023 with an increase of 13% month-to-month. Over the period under review, imports hit record highs in July 2023.
In value terms, sanitary paper product imports totaled $287M (IndexBox estimates) in July 2023. Over the period under review, imports showed a relatively flat trend pattern. The most prominent rate of growth was recorded in March 2023 with an increase of 8.1% against the previous month. Imports peaked in July 2023. 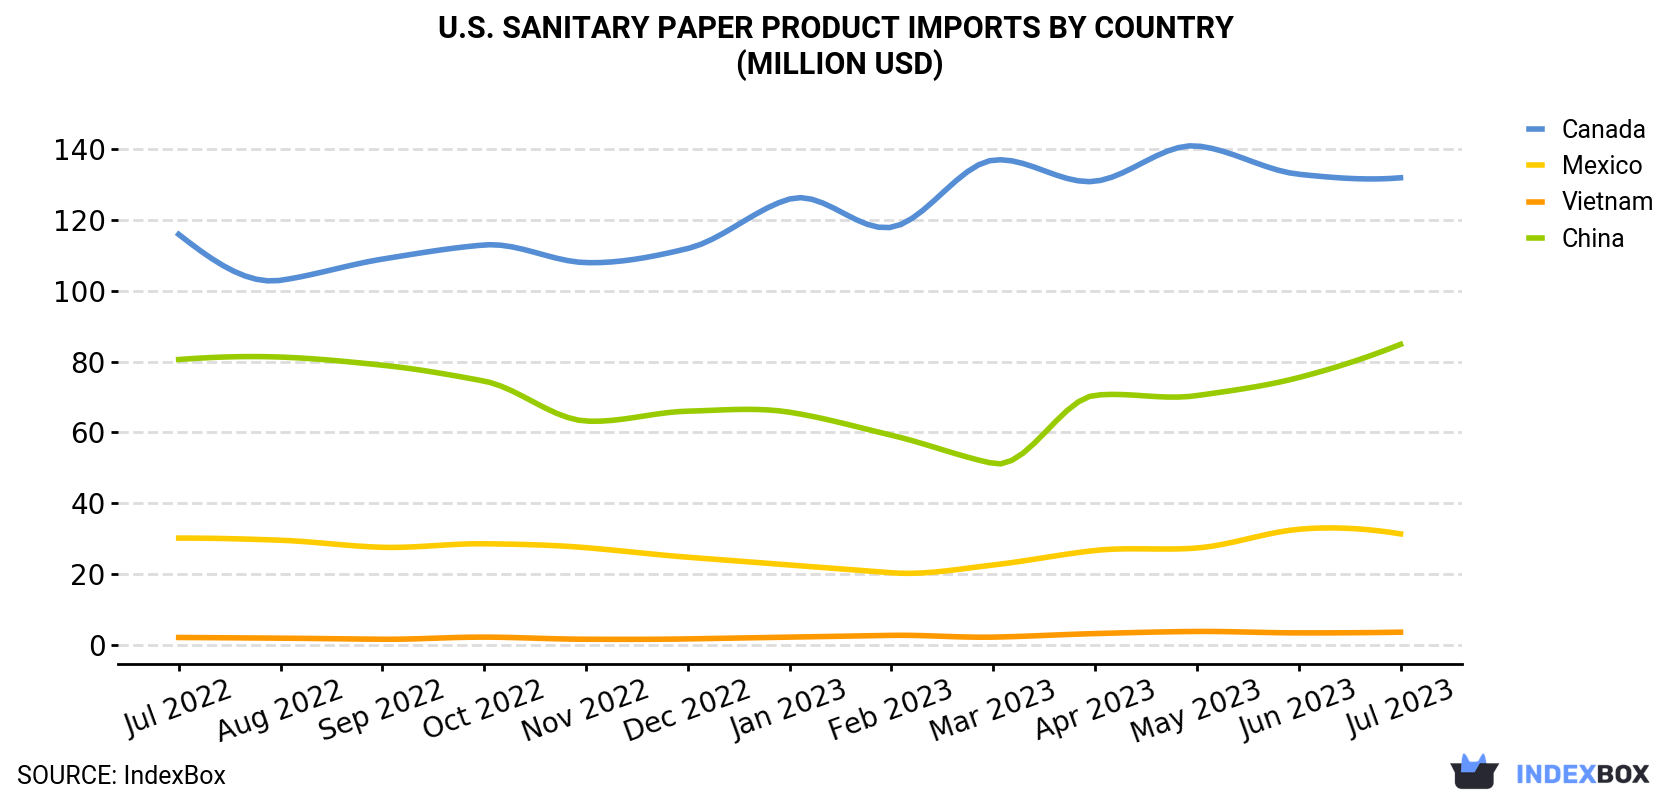
| COUNTRY | Import Value of Sanitary Paper Product in U.S. (million USD) | ||||||||||||
|---|---|---|---|---|---|---|---|---|---|---|---|---|---|
| Jul 2022 | Aug 2022 | Sep 2022 | Oct 2022 | Nov 2022 | Dec 2022 | Jan 2023 | Feb 2023 | Mar 2023 | Apr 2023 | May 2023 | Jun 2023 | Jul 2023 | |
| Canada | 116 | 103 | 109 | 113 | 108 | 112 | 126 | 118 | 137 | 131 | 141 | 133 | 132 |
| China | 80.6 | 81.3 | 79.0 | 74.5 | 63.2 | 66.0 | 65.7 | 59.2 | 51.2 | 70.5 | 70.4 | 75.5 | 84.9 |
| Mexico | 30.1 | 29.5 | 27.5 | 28.5 | 27.4 | 24.7 | 22.5 | 20.3 | 22.5 | 26.6 | 27.3 | 32.6 | 31.3 |
| Vietnam | 2.0 | 1.8 | 1.5 | 2.1 | 1.5 | 1.6 | 2.1 | 2.6 | 2.1 | 3.1 | 3.7 | 3.3 | 3.5 |
| Others | 33.1 | 35.9 | 29.3 | 33.3 | 25.5 | 28.9 | 33.0 | 27.6 | 33.4 | 34.8 | 34.5 | 40.7 | 35.3 |
| Total | 262 | 252 | 246 | 252 | 226 | 233 | 249 | 228 | 246 | 266 | 277 | 285 | 287 |
Imports by Country
China (37K tons), Canada (37K tons) and Mexico (9.1K tons) were the main suppliers of sanitary paper product imports to the United States, together comprising 87% of total imports. These countries were followed by Vietnam, which accounted for a further 2.5%.
From July 2022 to July 2023, the most notable rate of growth in terms of purchases, amongst the main suppliers, was attained by Vietnam (with a CAGR of +5.1%), while imports for the other leaders experienced more modest paces of growth.
In value terms, Canada ($132M), China ($85M) and Mexico ($31M) constituted the largest sanitary paper product suppliers to the United States, together accounting for 86% of total imports. Vietnam lagged somewhat behind, accounting for a further 1.2%.
Vietnam, with a CAGR of +4.9%, saw the highest rates of growth with regard to the value of imports, in terms of the main suppliers over the period under review, while purchases for the other leaders experienced more modest paces of growth.
Import Prices by Country
In July 2023, the sanitary paper product price amounted to $2,987 per ton (CIF, US), remaining relatively unchanged against the previous month. Over the period under review, the import price, however, showed a relatively flat trend pattern. The most prominent rate of growth was recorded in January 2023 when the average import price increased by 2.1% month-to-month. The import price peaked at $3,165 per ton in March 2023; however, from April 2023 to July 2023, import prices stood at a somewhat lower figure.
There were significant differences in the average prices amongst the major supplying countries. In July 2023, the country with the highest price was Canada ($3,558 per ton), while the price for Vietnam ($1,483 per ton) was amongst the lowest.
From July 2022 to July 2023, the most notable rate of growth in terms of prices was attained by Mexico (+1.2%), while the prices for the other major suppliers experienced mixed trend patterns.
This report provides an in-depth analysis of the sanitary paper product market in the U.S.. Within it, you will discover the latest data on market trends and opportunities by country, consumption, production and price developments, as well as the global trade (imports and exports). The forecast exhibits the market prospects through 2030.
Product coverage:
- NAICS 322291 - Sanitary paper product manufacturing
Companies mentioned:
- Johnson & Johnson
- Georgia-Pacific
- Marcal Manufacturing
- Hoffmaster Group
- Professional Disposables
- Cascades Tissue Group - North Carolina
- Attends Healthcare Products
- Principle Business Enterprises
- Royal Paper Converting
- First Quality Baby Products
- Orchids Paper Products Company
- U.S. Alliance Paper
- Associated Hygienic Products
- Allied West Paper Corp.
- Cascades Tissue Group - Pennsylvania
- Playtex Products
- Leaf River Cellulose
- Rose's Southwest Papers
- Playtex Manufacturing
- Tambrands Sales Corp.
- The Procter & Gamble Paper Products Company
- The Tranzonic Companies
- Tz Acquisition Corp.
- First Quality Products
- Marcal Paper Mills
- Soundview Paper Mills
- Soundview Paper Holdings
- Omganics
Country coverage:
- United States
Data coverage:
- Market volume and value
- Per Capita consumption
- Forecast of the market dynamics in the medium term
- Trade (exports and imports) in the U.S.
- Export and import prices
- Market trends, drivers and restraints
- Key market players and their profiles
Reasons to buy this report:
- Take advantage of the latest data
- Find deeper insights into current market developments
- Discover vital success factors affecting the market
This report is designed for manufacturers, distributors, importers, and wholesalers, as well as for investors, consultants and advisors.
In this report, you can find information that helps you to make informed decisions on the following issues:
- How to diversify your business and benefit from new market opportunities
- How to load your idle production capacity
- How to boost your sales on overseas markets
- How to increase your profit margins
- How to make your supply chain more sustainable
- How to reduce your production and supply chain costs
- How to outsource production to other countries
- How to prepare your business for global expansion
While doing this research, we combine the accumulated expertise of our analysts and the capabilities of artificial intelligence. The AI-based platform, developed by our data scientists, constitutes the key working tool for business analysts, empowering them to discover deep insights and ideas from the marketing data.
-
1. INTRODUCTION
Making Data-Driven Decisions to Grow Your Business
- REPORT DESCRIPTION
- RESEARCH METHODOLOGY AND AI PLATFORM
- DATA-DRIVEN DECISIONS FOR YOUR BUSINESS
- GLOSSARY AND SPECIFIC TERMS
-
2. EXECUTIVE SUMMARY
A Quick Overview of Market Performance
- KEY FINDINGS
- MARKET TRENDS This Chapter is Available Only for the Professional Edition PRO
-
3. MARKET OVERVIEW
Understanding the Current State of The Market and Its Prospects
- MARKET SIZE
- MARKET STRUCTURE
- TRADE BALANCE
- PER CAPITA CONSUMPTION
- MARKET FORECAST TO 2030
-
4. MOST PROMISING PRODUCT
Finding New Products to Diversify Your Business
This Chapter is Available Only for the Professional Edition PRO- TOP PRODUCTS TO DIVERSIFY YOUR BUSINESS
- BEST-SELLING PRODUCTS
- MOST CONSUMED PRODUCT
- MOST TRADED PRODUCT
- MOST PROFITABLE PRODUCT FOR EXPORT
-
5. MOST PROMISING SUPPLYING COUNTRIES
Choosing the Best Countries to Establish Your Sustainable Supply Chain
This Chapter is Available Only for the Professional Edition PRO- TOP COUNTRIES TO SOURCE YOUR PRODUCT
- TOP PRODUCING COUNTRIES
- TOP EXPORTING COUNTRIES
- LOW-COST EXPORTING COUNTRIES
-
6. MOST PROMISING OVERSEAS MARKETS
Choosing the Best Countries to Boost Your Exports
This Chapter is Available Only for the Professional Edition PRO- TOP OVERSEAS MARKETS FOR EXPORTING YOUR PRODUCT
- TOP CONSUMING MARKETS
- UNSATURATED MARKETS
- TOP IMPORTING MARKETS
- MOST PROFITABLE MARKETS
7. PRODUCTION
The Latest Trends and Insights into The Industry
- PRODUCTION VOLUME AND VALUE
8. IMPORTS
The Largest Import Supplying Countries
- IMPORTS FROM 2012–2023
- IMPORTS BY COUNTRY
- IMPORT PRICES BY COUNTRY
9. EXPORTS
The Largest Destinations for Exports
- EXPORTS FROM 2012–2023
- EXPORTS BY COUNTRY
- EXPORT PRICES BY COUNTRY
-
10. PROFILES OF MAJOR PRODUCERS
The Largest Producers on The Market and Their Profiles
This Chapter is Available Only for the Professional Edition PRO -
LIST OF TABLES
- Key Findings In 2023
- Market Volume, In Physical Terms, 2012–2023
- Market Value, 2012–2023
- Per Capita Consumption In 2012-2023
- Imports, In Physical Terms, By Country, 2012–2023
- Imports, In Value Terms, By Country, 2012–2023
- Import Prices, By Country Of Origin, 2012–2023
- Exports, In Physical Terms, By Country, 2012–2023
- Exports, In Value Terms, By Country, 2012–2023
- Export Prices, By Country Of Destination, 2012–2023
-
LIST OF FIGURES
- Market Volume, In Physical Terms, 2012–2023
- Market Value, 2012–2023
- Market Structure – Domestic Supply vs. Imports, In Physical Terms, 2012-2023
- Market Structure – Domestic Supply vs. Imports, In Value Terms, 2012-2023
- Trade Balance, In Physical Terms, 2012-2023
- Trade Balance, In Value Terms, 2012-2023
- Per Capita Consumption, 2012-2023
- Market Volume Forecast to 2030
- Market Value Forecast to 2030
- Products: Market Size And Growth, By Type
- Products: Average Per Capita Consumption, By Type
- Products: Exports And Growth, By Type
- Products: Export Prices And Growth, By Type
- Production Volume And Growth
- Exports And Growth
- Export Prices And Growth
- Market Size And Growth
- Per Capita Consumption
- Imports And Growth
- Import Prices
- Production, In Physical Terms, 2012–2023
- Production, In Value Terms, 2012–2023
- Imports, In Physical Terms, 2012–2023
- Imports, In Value Terms, 2012–2023
- Imports, In Physical Terms, By Country, 2023
- Imports, In Physical Terms, By Country, 2012–2023
- Imports, In Value Terms, By Country, 2012–2023
- Import Prices, By Country Of Origin, 2012–2023
- Exports, In Physical Terms, 2012–2023
- Exports, In Value Terms, 2012–2023
- Exports, In Physical Terms, By Country, 2023
- Exports, In Physical Terms, By Country, 2012–2023
- Exports, In Value Terms, By Country, 2012–2023
- Export Prices, By Country Of Destination, 2012–2023


