
U.S. Petroleum Market. Analysis And Forecast to 2030
Get instant access to more than 2 million reports, dashboards, and datasets on the IndexBox Platform.
View PricingPrice of Petroleum Drops to $591/ton in US
U.S. Petroleum Export Price in June 2023
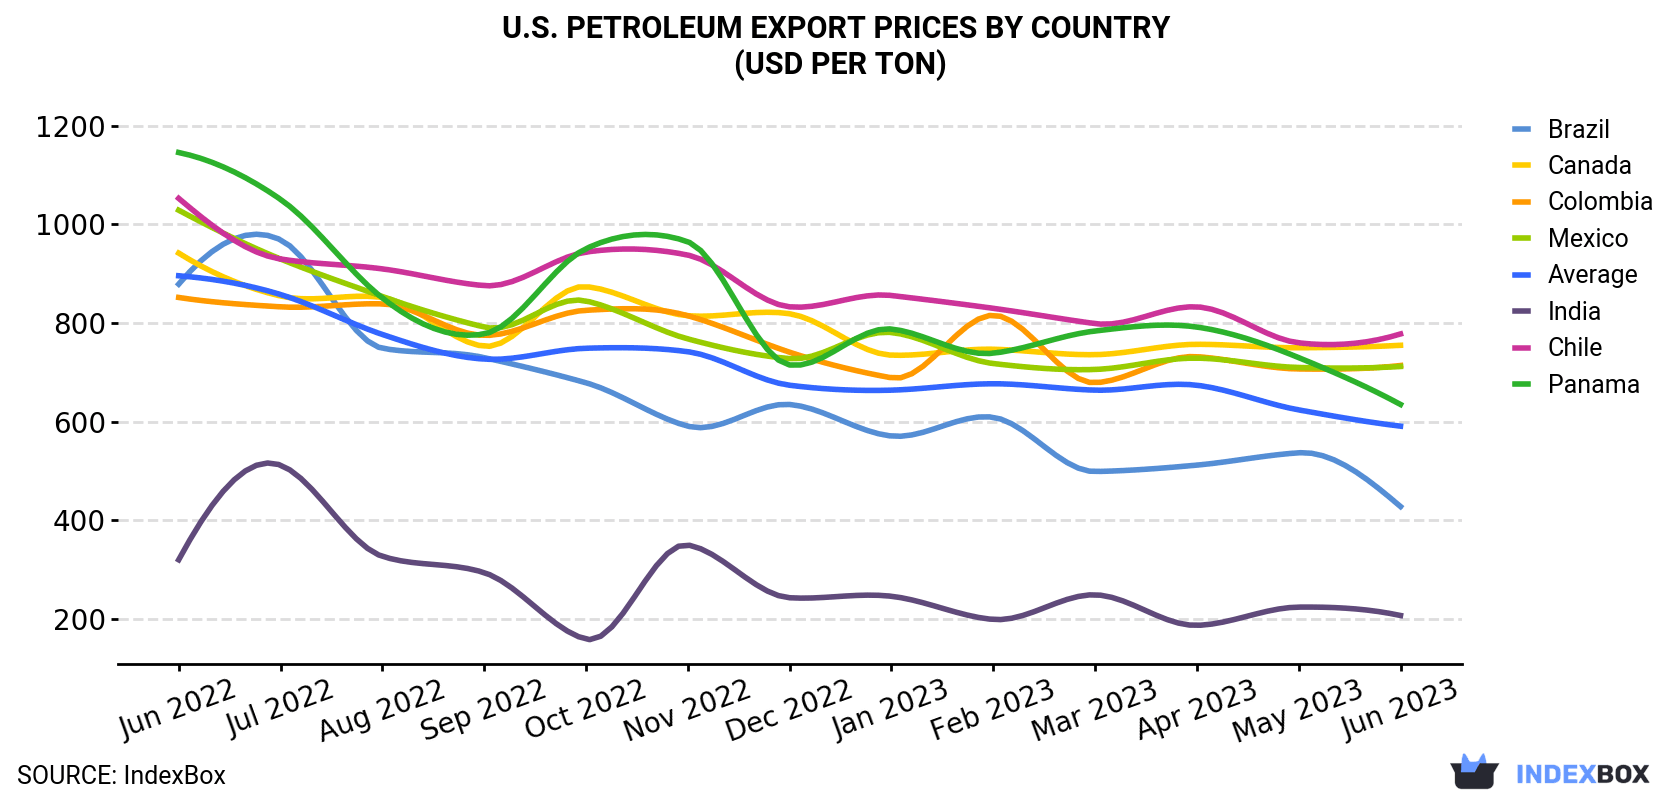
In June 2023, the petroleum price stood at $591 per ton (FOB, US), falling by -5.2% against the previous month. Over the period under review, the export price continues to indicate a pronounced decline. The pace of growth appeared the most rapid in October 2022 an increase of 3.2% against the previous month. The export price peaked at $896 per ton in June 2022; however, from July 2022 to June 2023, the export prices failed to regain momentum.
Prices varied noticeably by the country of destination: the country with the highest price was Chile ($778 per ton), while the average price for exports to India ($207 per ton) was amongst the lowest.
From June 2022 to June 2023, the most notable rate of growth in terms of prices was recorded for supplies to Colombia (-1.5%), while the prices for the other major destinations experienced a decline.
| COUNTRY | Export Price of Petroleum in U.S. (USD per ton) | ||||||||||||
|---|---|---|---|---|---|---|---|---|---|---|---|---|---|
| Jun 2022 | Jul 2022 | Aug 2022 | Sep 2022 | Oct 2022 | Nov 2022 | Dec 2022 | Jan 2023 | Feb 2023 | Mar 2023 | Apr 2023 | May 2023 | Jun 2023 | |
| Chile | 1,053 | 930 | 910 | 876 | 944 | 938 | 833 | 856 | 830 | 799 | 833 | 760 | 778 |
| Canada | 942 | 855 | 852 | 753 | 874 | 815 | 819 | 735 | 747 | 736 | 757 | 750 | 755 |
| Colombia | 852 | 833 | 839 | 775 | 826 | 815 | 741 | 689 | 816 | 679 | 732 | 707 | 714 |
| Mexico | 1,029 | 930 | 854 | 792 | 845 | 768 | 728 | 781 | 718 | 706 | 729 | 710 | 712 |
| Panama | 1,146 | 1,051 | 851 | 778 | 951 | 965 | 715 | 788 | 739 | 784 | 792 | 730 | 635 |
| Brazil | 879 | 969 | 749 | 730 | 679 | 591 | 635 | 571 | 609 | 499 | 512 | 537 | 428 |
| India | 320 | 512 | 327 | 294 | 159 | 350 | 243 | 246 | 199 | 249 | 187 | 224 | 207 |
| Average | 896 | 858 | 777 | 727 | 749 | 742 | 674 | 664 | 677 | 664 | 674 | 624 | 591 |
U.S. Petroleum Exports
In June 2023, approximately 16M tons of petroleum were exported from the United States; remaining constant against the previous month. In general, exports, however, showed a relatively flat trend pattern. The most prominent rate of growth was recorded in March 2023 when exports increased by 27% m-o-m.
In value terms, petroleum exports contracted modestly to $9.4B (IndexBox estimates) in June 2023. Over the period under review, exports, however, recorded a perceptible setback. The growth pace was the most rapid in March 2023 with an increase of 24% against the previous month.
U.S. Petroleum Exports by Country
Mexico (3.9M tons) was the main destination for petroleum exports from the United States, with a 25% share of total exports. Moreover, petroleum exports to Mexico exceeded the volume sent to the second major destination, Canada (1.2M tons), threefold. The third position in this ranking was held by India (981K tons), with a 6.2% share.
From June 2022 to June 2023, the average monthly rate of growth in terms of volume to Mexico was relatively modest. Exports to the other major destinations recorded the following average monthly rates of exports growth: Canada (-4.6% per month) and India (+3.8% per month).
In value terms, Mexico ($2.8B) remains the key foreign market for petroleum exports from the United States, comprising 30% of total exports. The second position in the ranking was taken by Canada ($913M), with a 9.7% share of total exports. It was followed by Chile, with a 5.3% share.
From June 2022 to June 2023, the average monthly rate of growth in terms of value to Mexico totaled -3.1%. Exports to the other major destinations recorded the following average monthly rates of exports growth: Canada (-6.3% per month) and Chile (-6.0% per month).
This report provides an in-depth analysis of the petroleum market in the U.S.. Within it, you will discover the latest data on market trends and opportunities by country, consumption, production and price developments, as well as the global trade (imports and exports). The forecast exhibits the market prospects through 2030.
Product coverage:
- NAICS 324110 - Petroleum refineries
Companies mentioned:
- Chevron Corporation
- Exxon Mobil Corporation
- Valero Energy Corporation
- Koch Industries
- Hollyfrontier Corporation
- Calumet Specialty Products Partners
- United Refining Company
- Western Refining
- Alon USA Energy
- Pbf Energy Company
- Pbf Energy
- Cvr Energy
- Murphy Oil Usa
- Chc McPherson Refinery
- BP America
- Delek US Holdings
- Marathon Petroleum Corporation
- Placid Refining Company
- Cvr Refining
- Northern Tier Energy
- Paulsboro Refining Company
- United Refining
- Valero Refining-New Orleans
- Shell Petroleum
- Exxonmobil Oil Corporation
- Placid Holding Company
- The Sinclair Companies
- United Acquisition Corp.
- Alon Refining Krotz Springs
- Pbf Holding Company
- Phillips 66 Company
- Alon USA Partners
- BP Corporation North America
Country coverage:
- United States
Data coverage:
- Market volume and value
- Per Capita consumption
- Forecast of the market dynamics in the medium term
- Trade (exports and imports) in the U.S.
- Export and import prices
- Market trends, drivers and restraints
- Key market players and their profiles
Reasons to buy this report:
- Take advantage of the latest data
- Find deeper insights into current market developments
- Discover vital success factors affecting the market
This report is designed for manufacturers, distributors, importers, and wholesalers, as well as for investors, consultants and advisors.
In this report, you can find information that helps you to make informed decisions on the following issues:
- How to diversify your business and benefit from new market opportunities
- How to load your idle production capacity
- How to boost your sales on overseas markets
- How to increase your profit margins
- How to make your supply chain more sustainable
- How to reduce your production and supply chain costs
- How to outsource production to other countries
- How to prepare your business for global expansion
While doing this research, we combine the accumulated expertise of our analysts and the capabilities of artificial intelligence. The AI-based platform, developed by our data scientists, constitutes the key working tool for business analysts, empowering them to discover deep insights and ideas from the marketing data.
-
1. INTRODUCTION
Making Data-Driven Decisions to Grow Your Business
- REPORT DESCRIPTION
- RESEARCH METHODOLOGY AND AI PLATFORM
- DATA-DRIVEN DECISIONS FOR YOUR BUSINESS
- GLOSSARY AND SPECIFIC TERMS
-
2. EXECUTIVE SUMMARY
A Quick Overview of Market Performance
- KEY FINDINGS
- MARKET TRENDS This Chapter is Available Only for the Professional Edition PRO
-
3. MARKET OVERVIEW
Understanding the Current State of The Market and Its Prospects
- MARKET SIZE
- MARKET STRUCTURE
- TRADE BALANCE
- PER CAPITA CONSUMPTION
- MARKET FORECAST TO 2030
-
4. MOST PROMISING PRODUCT
Finding New Products to Diversify Your Business
This Chapter is Available Only for the Professional Edition PRO- TOP PRODUCTS TO DIVERSIFY YOUR BUSINESS
- BEST-SELLING PRODUCTS
- MOST CONSUMED PRODUCT
- MOST TRADED PRODUCT
- MOST PROFITABLE PRODUCT FOR EXPORT
-
5. MOST PROMISING SUPPLYING COUNTRIES
Choosing the Best Countries to Establish Your Sustainable Supply Chain
This Chapter is Available Only for the Professional Edition PRO- TOP COUNTRIES TO SOURCE YOUR PRODUCT
- TOP PRODUCING COUNTRIES
- TOP EXPORTING COUNTRIES
- LOW-COST EXPORTING COUNTRIES
-
6. MOST PROMISING OVERSEAS MARKETS
Choosing the Best Countries to Boost Your Exports
This Chapter is Available Only for the Professional Edition PRO- TOP OVERSEAS MARKETS FOR EXPORTING YOUR PRODUCT
- TOP CONSUMING MARKETS
- UNSATURATED MARKETS
- TOP IMPORTING MARKETS
- MOST PROFITABLE MARKETS
7. PRODUCTION
The Latest Trends and Insights into The Industry
- PRODUCTION VOLUME AND VALUE
8. IMPORTS
The Largest Import Supplying Countries
- IMPORTS FROM 2012–2023
- IMPORTS BY COUNTRY
- IMPORT PRICES BY COUNTRY
9. EXPORTS
The Largest Destinations for Exports
- EXPORTS FROM 2012–2023
- EXPORTS BY COUNTRY
- EXPORT PRICES BY COUNTRY
-
10. PROFILES OF MAJOR PRODUCERS
The Largest Producers on The Market and Their Profiles
This Chapter is Available Only for the Professional Edition PRO -
LIST OF TABLES
- Key Findings In 2023
- Market Volume, In Physical Terms, 2012–2023
- Market Value, 2012–2023
- Per Capita Consumption In 2012-2023
- Imports, In Physical Terms, By Country, 2012–2023
- Imports, In Value Terms, By Country, 2012–2023
- Import Prices, By Country Of Origin, 2012–2023
- Exports, In Physical Terms, By Country, 2012–2023
- Exports, In Value Terms, By Country, 2012–2023
- Export Prices, By Country Of Destination, 2012–2023
-
LIST OF FIGURES
- Market Volume, In Physical Terms, 2012–2023
- Market Value, 2012–2023
- Market Structure – Domestic Supply vs. Imports, In Physical Terms, 2012-2023
- Market Structure – Domestic Supply vs. Imports, In Value Terms, 2012-2023
- Trade Balance, In Physical Terms, 2012-2023
- Trade Balance, In Value Terms, 2012-2023
- Per Capita Consumption, 2012-2023
- Market Volume Forecast to 2030
- Market Value Forecast to 2030
- Products: Market Size And Growth, By Type
- Products: Average Per Capita Consumption, By Type
- Products: Exports And Growth, By Type
- Products: Export Prices And Growth, By Type
- Production Volume And Growth
- Exports And Growth
- Export Prices And Growth
- Market Size And Growth
- Per Capita Consumption
- Imports And Growth
- Import Prices
- Production, In Physical Terms, 2012–2023
- Production, In Value Terms, 2012–2023
- Imports, In Physical Terms, 2012–2023
- Imports, In Value Terms, 2012–2023
- Imports, In Physical Terms, By Country, 2023
- Imports, In Physical Terms, By Country, 2012–2023
- Imports, In Value Terms, By Country, 2012–2023
- Import Prices, By Country Of Origin, 2012–2023
- Exports, In Physical Terms, 2012–2023
- Exports, In Value Terms, 2012–2023
- Exports, In Physical Terms, By Country, 2023
- Exports, In Physical Terms, By Country, 2012–2023
- Exports, In Value Terms, By Country, 2012–2023
- Export Prices, By Country Of Destination, 2012–2023


