
U.S. - Narrow Woven Fabrics - Market Analysis, Forecast, Size, Trends and Insights
Get instant access to more than 2 million reports, dashboards, and datasets on the IndexBox Platform.
View PricingPrice of Narrow Woven Fabric in United States Sees 4% Increase, Reaching An Average of $11.0/kg
U.S. Narrow Woven Fabric Import Price in August 2023
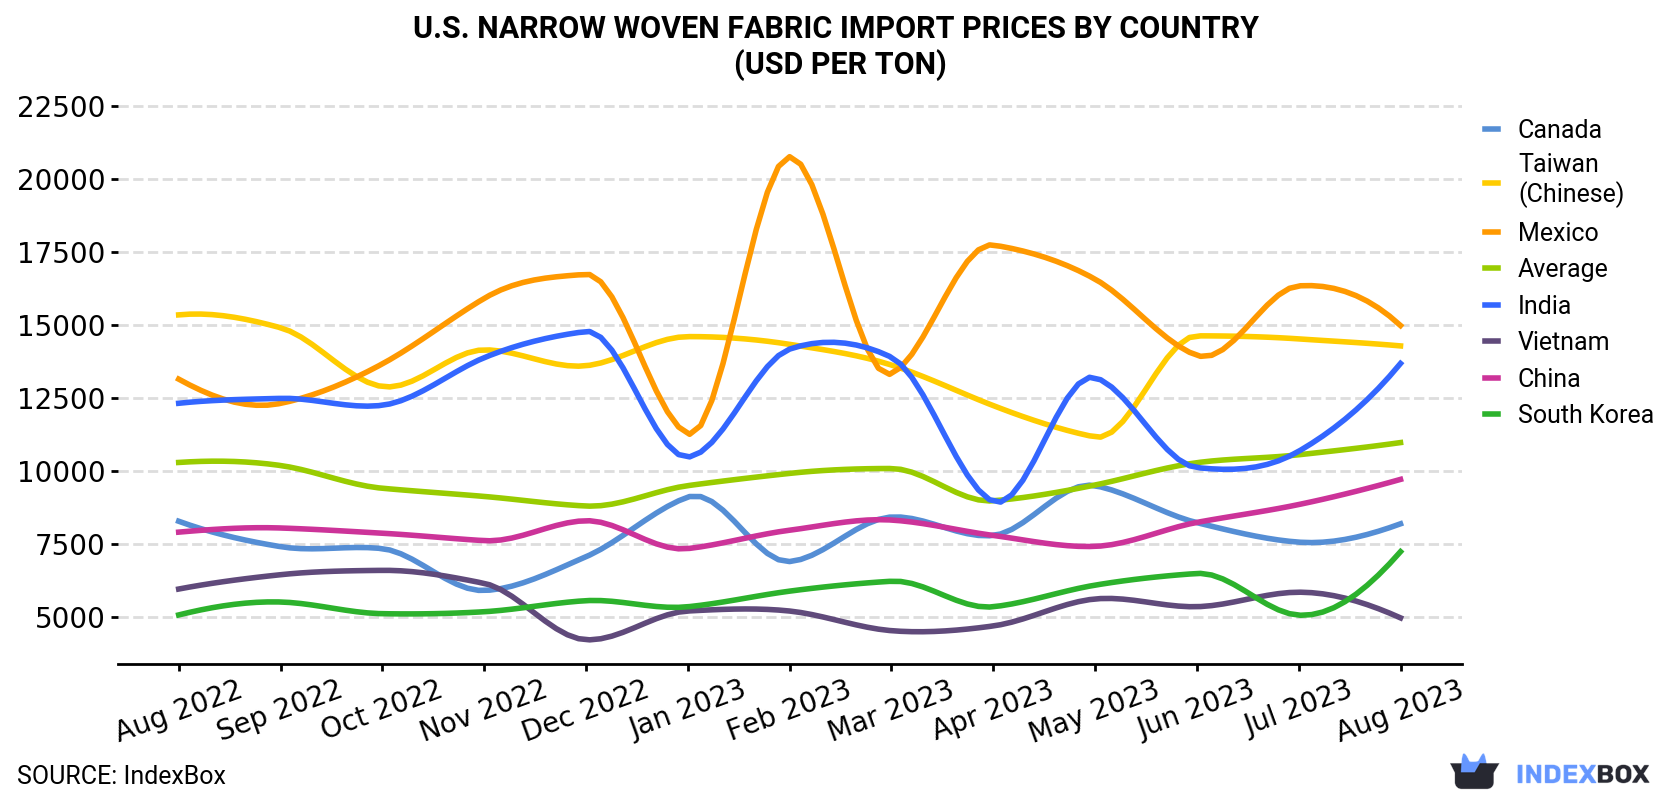
In August 2023, the narrow woven fabric price stood at $10,982 per ton (CIF, US), picking up by 3.9% against the previous month. Overall, the import price recorded a relatively flat trend pattern. The growth pace was the most rapid in June 2023 an increase of 8% against the previous month. The import price peaked in August 2023.
There were significant differences in the average prices amongst the major supplying countries. In August 2023, the country with the highest price was Mexico ($14,985 per ton), while the price for Vietnam ($4,987 per ton) was amongst the lowest.
From August 2022 to August 2023, the most notable rate of growth in terms of prices was attained by South Korea (+3.0%), while the prices for the other major suppliers experienced more modest paces of growth.
| COUNTRY | Import Price of Narrow Woven Fabric in U.S. (USD per ton) | ||||||||||||
|---|---|---|---|---|---|---|---|---|---|---|---|---|---|
| Aug 2022 | Sep 2022 | Oct 2022 | Nov 2022 | Dec 2022 | Jan 2023 | Feb 2023 | Mar 2023 | Apr 2023 | May 2023 | Jun 2023 | Jul 2023 | Aug 2023 | |
| Mexico | 13,152 | 12,322 | 13,674 | 15,913 | 16,738 | 11,281 | 20,759 | 13,334 | 17,739 | 16,572 | 13,964 | 16,341 | 14,985 |
| Taiwan (Chinese) | 15,349 | 14,910 | 12,898 | 14,153 | 13,609 | 14,606 | 14,341 | 13,634 | 12,247 | 11,173 | 14,632 | 14,528 | 14,288 |
| India | 12,326 | 12,494 | 12,258 | 13,885 | 14,782 | 10,486 | 14,179 | 13,900 | 8,964 | 13,206 | 10,126 | 10,684 | 13,688 |
| China | 7,919 | 8,061 | 7,882 | 7,628 | 8,310 | 7,356 | 7,985 | 8,333 | 7,806 | 7,432 | 8,252 | 8,863 | 9,723 |
| Canada | 8,292 | 7,423 | 7,355 | 5,923 | 7,078 | 9,118 | 6,913 | 8,437 | 7,804 | 9,508 | 8,244 | 7,577 | 8,204 |
| South Korea | 5,087 | 5,530 | 5,130 | 5,197 | 5,575 | 5,367 | 5,901 | 6,240 | 5,367 | 6,106 | 6,505 | 5,079 | 7,251 |
| Vietnam | 5,973 | 6,463 | 6,612 | 6,168 | 4,238 | 5,222 | 5,221 | 4,549 | 4,711 | 5,634 | 5,369 | 5,865 | 4,987 |
| Average | 10,302 | 10,198 | 9,420 | 9,140 | 8,812 | 9,509 | 9,928 | 10,095 | 8,991 | 9,531 | 10,294 | 10,565 | 10,982 |
U.S. Narrow Woven Fabric Import Prices by Type
There were significant differences in the average prices amongst the major supplied products. In August 2023, the product with the highest price was labels, badges and similar articles; of textile materials, in the piece, in strips or cut to shape or size, not embroidered ($54,159 per ton), while the price for fabrics; narrow woven, other than goods of heading no. 5807; narrow fabrics consisting of warp without weft assembled by means of an adhesive (bolducs) ($10,001 per ton) was amongst the lowest.
From August 2022 to August 2023, the most notable rate of growth in terms of prices was attained by braids in the piece; ornamental trimmings in the piece, without embroidery, other than knitted or crocheted; tassels, pompons and similar articles (+1.1%), while the prices for the other products experienced mixed trend patterns.
U.S. Narrow Woven Fabric Imports
Narrow woven fabric imports into the United States rose notably to 4.2K tons in August 2023, picking up by 13% against the month before. Over the period under review, imports, however, showed a pronounced descent. The pace of growth was the most pronounced in May 2023 when imports increased by 28% month-to-month.
In value terms, narrow woven fabric imports soared to $46M (IndexBox estimates) in August 2023. Overall, imports, however, showed a noticeable shrinkage. The pace of growth appeared the most rapid in May 2023 with an increase of 36% against the previous month.
U.S. Narrow Woven Fabric Imports by Type
In August 2023, fabrics; narrow woven, other than goods of heading no. 5807; narrow fabrics consisting of warp without weft assembled by means of an adhesive (bolducs) (3.9K tons) was the main type of narrow woven fabric supplied to the United States, with a 94% share of total imports. Moreover, fabrics; narrow woven, other than goods of heading no. 5807; narrow fabrics consisting of warp without weft assembled by means of an adhesive (bolducs) exceeded the figures recorded for the second-largest type, braids in the piece; ornamental trimmings in the piece, without embroidery, other than knitted or crocheted; tassels, pompons and similar articles (185 tons), more than tenfold.
From August 2022 to August 2023, the average monthly growth rate of the volume of import of fabrics; narrow woven, other than goods of heading no. 5807; narrow fabrics consisting of warp without weft assembled by means of an adhesive (bolducs) stood at -3.1%. With regard to the other supplied products, the following average monthly rates of growth were recorded: braids in the piece; ornamental trimmings in the piece, without embroidery, other than knitted or crocheted; tassels, pompons and similar articles (-1.6% per month) and labels, badges and similar articles; of textile materials, in the piece, in strips or cut to shape or size, not embroidered (-0.0% per month).
In value terms, fabrics; narrow woven, other than goods of heading no. 5807; narrow fabrics consisting of warp without weft assembled by means of an adhesive (bolducs) ($39M) constituted the largest type of narrow woven fabric supplied to the United States, comprising 86% of total imports. The second position in the ranking was held by braids in the piece; ornamental trimmings in the piece, without embroidery, other than knitted or crocheted; tassels, pompons and similar articles ($3.5M), with a 7.7% share of total imports.
U.S. Narrow Woven Fabric Imports by Country
Taiwan (Chinese) (1.2K tons), China (931 tons) and Vietnam (544 tons) were the main suppliers of narrow woven fabric imports to the United States, with a combined 65% share of total imports. These countries were followed by South Korea, Mexico, India and Canada, which together accounted for a further 19%.
From August 2022 to August 2023, the most notable rate of growth in terms of purchases, amongst the main suppliers, was attained by India (with a CAGR of -0.8%), while imports for the other leaders experienced a decline.
In value terms, Taiwan (Chinese) ($18M), China ($9.1M) and Mexico ($3.3M) constituted the largest narrow woven fabric suppliers to the United States, with a combined 66% share of total imports.
In terms of the main suppliers, Mexico, with a CAGR of +0.2%, saw the highest rates of growth with regard to the value of imports, over the period under review, while purchases for the other leaders experienced mixed trend patterns.
This report provides an in-depth analysis of the narrow woven fabric market in the U.S.. Within it, you will discover the latest data on market trends and opportunities by country, consumption, production and price developments, as well as the global trade (imports and exports). The forecast exhibits the market prospects through 2030.
Product coverage:
- Prodcom 13961730 - Narrow woven fabrics other than labels, badges and other similar articles
- Prodcom 13961750 - Labels, badges and similar articles in textile materials (excluding embroidered)
- Prodcom 13961770 - Braids in the piece, tassels and pompons, ornamental trimmings (excluding knitted or crocheted)
Country coverage:
- United States
Data coverage:
- Market volume and value
- Per Capita consumption
- Forecast of the market dynamics in the medium term
- Trade (exports and imports) in the U.S.
- Export and import prices
- Market trends, drivers and restraints
- Key market players and their profiles
Reasons to buy this report:
- Take advantage of the latest data
- Find deeper insights into current market developments
- Discover vital success factors affecting the market
This report is designed for manufacturers, distributors, importers, and wholesalers, as well as for investors, consultants and advisors.
In this report, you can find information that helps you to make informed decisions on the following issues:
- How to diversify your business and benefit from new market opportunities
- How to load your idle production capacity
- How to boost your sales on overseas markets
- How to increase your profit margins
- How to make your supply chain more sustainable
- How to reduce your production and supply chain costs
- How to outsource production to other countries
- How to prepare your business for global expansion
While doing this research, we combine the accumulated expertise of our analysts and the capabilities of artificial intelligence. The AI-based platform, developed by our data scientists, constitutes the key working tool for business analysts, empowering them to discover deep insights and ideas from the marketing data.
-
1. INTRODUCTION
Making Data-Driven Decisions to Grow Your Business
- REPORT DESCRIPTION
- RESEARCH METHODOLOGY AND AI PLATFORM
- DATA-DRIVEN DECISIONS FOR YOUR BUSINESS
- GLOSSARY AND SPECIFIC TERMS
-
2. EXECUTIVE SUMMARY
A Quick Overview of Market Performance
- KEY FINDINGS
- MARKET TRENDS This Chapter is Available Only for the Professional Edition PRO
-
3. MARKET OVERVIEW
Understanding the Current State of The Market and Its Prospects
- MARKET SIZE
- MARKET STRUCTURE
- TRADE BALANCE
- PER CAPITA CONSUMPTION
- MARKET FORECAST TO 2030
-
4. MOST PROMISING PRODUCT
Finding New Products to Diversify Your Business
This Chapter is Available Only for the Professional Edition PRO- TOP PRODUCTS TO DIVERSIFY YOUR BUSINESS
- BEST-SELLING PRODUCTS
- MOST CONSUMED PRODUCT
- MOST TRADED PRODUCT
- MOST PROFITABLE PRODUCT FOR EXPORT
-
5. MOST PROMISING SUPPLYING COUNTRIES
Choosing the Best Countries to Establish Your Sustainable Supply Chain
This Chapter is Available Only for the Professional Edition PRO- TOP COUNTRIES TO SOURCE YOUR PRODUCT
- TOP PRODUCING COUNTRIES
- TOP EXPORTING COUNTRIES
- LOW-COST EXPORTING COUNTRIES
-
6. MOST PROMISING OVERSEAS MARKETS
Choosing the Best Countries to Boost Your Exports
This Chapter is Available Only for the Professional Edition PRO- TOP OVERSEAS MARKETS FOR EXPORTING YOUR PRODUCT
- TOP CONSUMING MARKETS
- UNSATURATED MARKETS
- TOP IMPORTING MARKETS
- MOST PROFITABLE MARKETS
7. PRODUCTION
The Latest Trends and Insights into The Industry
- PRODUCTION VOLUME AND VALUE
8. IMPORTS
The Largest Import Supplying Countries
- IMPORTS FROM 2012–2023
- IMPORTS BY COUNTRY
- IMPORT PRICES BY COUNTRY
9. EXPORTS
The Largest Destinations for Exports
- EXPORTS FROM 2012–2023
- EXPORTS BY COUNTRY
- EXPORT PRICES BY COUNTRY
-
10. PROFILES OF MAJOR PRODUCERS
The Largest Producers on The Market and Their Profiles
This Chapter is Available Only for the Professional Edition PRO -
LIST OF TABLES
- Key Findings In 2023
- Market Volume, In Physical Terms, 2012–2023
- Market Value, 2012–2023
- Per Capita Consumption In 2012-2023
- Imports, In Physical Terms, By Country, 2012–2023
- Imports, In Value Terms, By Country, 2012–2023
- Import Prices, By Country Of Origin, 2012–2023
- Exports, In Physical Terms, By Country, 2012–2023
- Exports, In Value Terms, By Country, 2012–2023
- Export Prices, By Country Of Destination, 2012–2023
-
LIST OF FIGURES
- Market Volume, In Physical Terms, 2012–2023
- Market Value, 2012–2023
- Market Structure – Domestic Supply vs. Imports, In Physical Terms, 2012-2023
- Market Structure – Domestic Supply vs. Imports, In Value Terms, 2012-2023
- Trade Balance, In Physical Terms, 2012-2023
- Trade Balance, In Value Terms, 2012-2023
- Per Capita Consumption, 2012-2023
- Market Volume Forecast to 2030
- Market Value Forecast to 2030
- Products: Market Size And Growth, By Type
- Products: Average Per Capita Consumption, By Type
- Products: Exports And Growth, By Type
- Products: Export Prices And Growth, By Type
- Production Volume And Growth
- Exports And Growth
- Export Prices And Growth
- Market Size And Growth
- Per Capita Consumption
- Imports And Growth
- Import Prices
- Production, In Physical Terms, 2012–2023
- Production, In Value Terms, 2012–2023
- Imports, In Physical Terms, 2012–2023
- Imports, In Value Terms, 2012–2023
- Imports, In Physical Terms, By Country, 2023
- Imports, In Physical Terms, By Country, 2012–2023
- Imports, In Value Terms, By Country, 2012–2023
- Import Prices, By Country Of Origin, 2012–2023
- Exports, In Physical Terms, 2012–2023
- Exports, In Value Terms, 2012–2023
- Exports, In Physical Terms, By Country, 2023
- Exports, In Physical Terms, By Country, 2012–2023
- Exports, In Value Terms, By Country, 2012–2023
- Export Prices, By Country Of Destination, 2012–2023


