
U.S. Iron And Steel Forging Market. Analysis And Forecast to 2030
Get instant access to more than 2 million reports, dashboards, and datasets on the IndexBox Platform.
View PricingImport of Iron and Steel Forging in United States Soars by 66% to $10M in August 2023
U.S. Iron And Steel Forging Imports
In August 2023, approximately 2M units of iron and steel forging were imported into the United States; with an increase of 70% against the previous month's figure. Overall, total imports indicated a noticeable increase from August 2022 to August 2023: its volume increased at an average monthly rate of +2.1% over the last twelve-month period. The trend pattern, however, indicated some noticeable fluctuations being recorded throughout the analyzed period. Based on August 2023 figures, imports increased by +70.0% against July 2023 indices. Over the period under review, imports hit record highs at 2.2M units in September 2022; however, from October 2022 to August 2023, imports stood at a somewhat lower figure.
In value terms, iron and steel forging imports skyrocketed to $10M (IndexBox estimates) in August 2023. In general, total imports indicated a pronounced increase from August 2022 to August 2023: its value increased at an average monthly rate of +2.1% over the last twelve months. The trend pattern, however, indicated some noticeable fluctuations being recorded throughout the analyzed period. Based on August 2023 figures, imports increased by +65.6% against July 2023 indices. As a result, imports reached the peak and are likely to continue growth in the immediate term.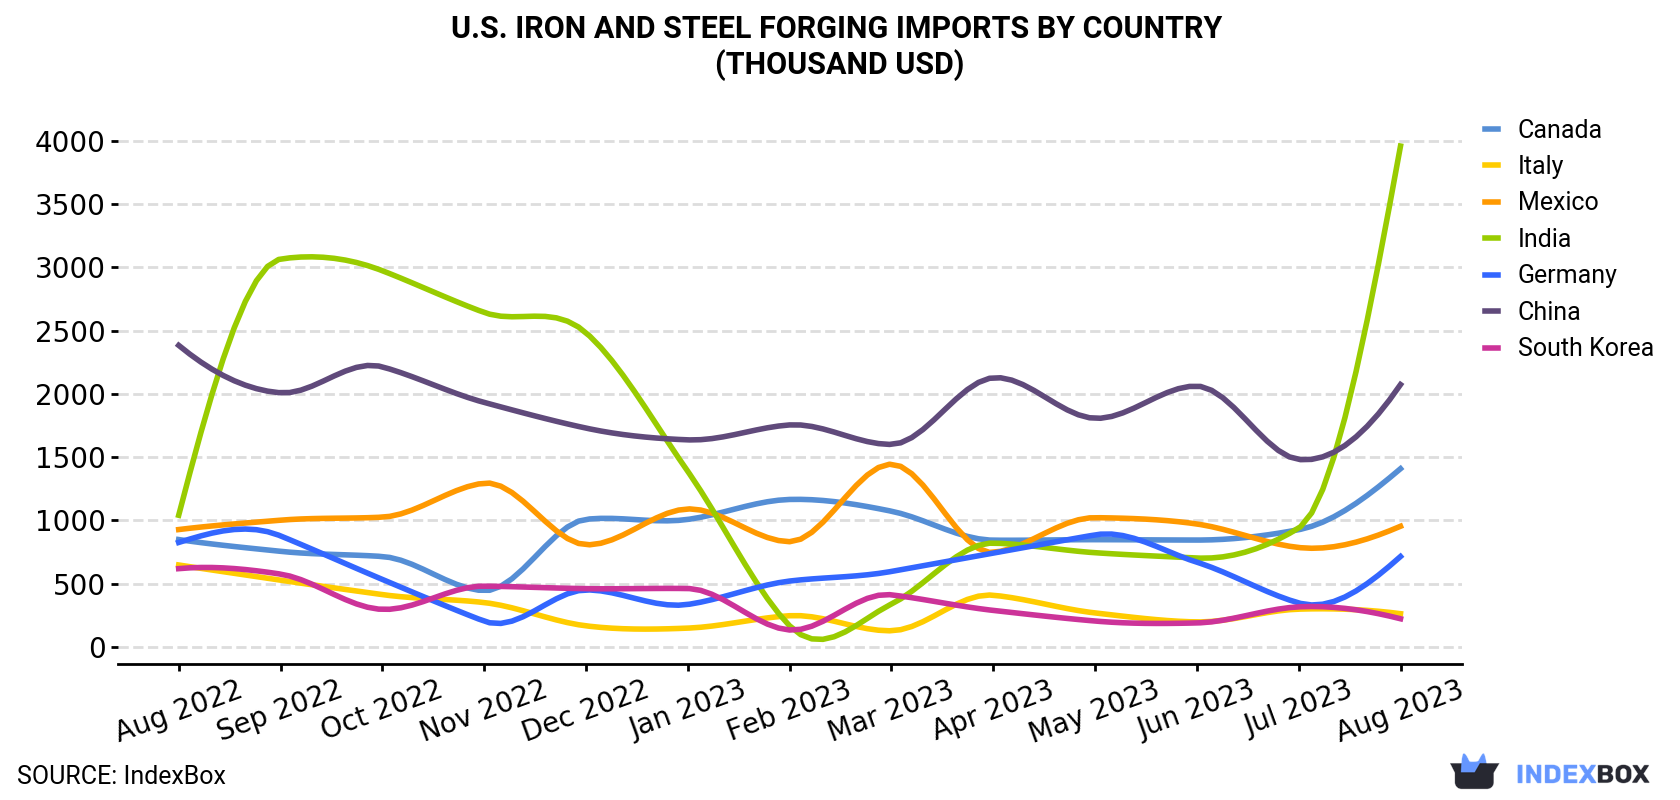
| COUNTRY | Import Value of Iron And Steel Forging in U.S. (thousand USD) | ||||||||||||
|---|---|---|---|---|---|---|---|---|---|---|---|---|---|
| Aug 2022 | Sep 2022 | Oct 2022 | Nov 2022 | Dec 2022 | Jan 2023 | Feb 2023 | Mar 2023 | Apr 2023 | May 2023 | Jun 2023 | Jul 2023 | Aug 2023 | |
| India | 1,040 | 3,065 | 2,973 | 2,643 | 2,483 | 1,387 | 166 | 338 | 820 | 744 | 702 | 939 | 3,958 |
| China | 2,383 | 2,008 | 2,213 | 1,932 | 1,729 | 1,636 | 1,754 | 1,600 | 2,127 | 1,806 | 2,061 | 1,481 | 2,073 |
| Canada | 848 | 755 | 714 | 444 | 1,008 | 1,007 | 1,165 | 1,072 | 843 | 847 | 844 | 926 | 1,408 |
| Mexico | 927 | 1,001 | 1,025 | 1,294 | 807 | 1,090 | 831 | 1,444 | 746 | 1,021 | 971 | 785 | 953 |
| Germany | 825 | 877 | 533 | 203 | 450 | 335 | 520 | 596 | 741 | 885 | 669 | 347 | 714 |
| Italy | 647 | 527 | 413 | 350 | 166 | 148 | 246 | 127 | 408 | 268 | 197 | 298 | 262 |
| South Korea | 618 | 575 | 296 | 480 | 460 | 461 | 133 | 411 | 288 | 204 | 189 | 316 | 222 |
| Others | 454 | 1,084 | 613 | 760 | 692 | 681 | 627 | 420 | 636 | 926 | 1,072 | 924 | 373 |
| Total | 7,743 | 9,890 | 8,780 | 8,106 | 7,794 | 6,745 | 5,444 | 6,009 | 6,609 | 6,701 | 6,705 | 6,015 | 9,963 |
Imports by Country
India (804K units), China (410K units) and Canada (269K units) were the main suppliers of iron and steel forging imports to the United States, with a combined 75% share of total imports.
From August 2022 to August 2023, the biggest increases were in India (with a CAGR of +11.8%), while purchases for the other leaders experienced more modest paces of growth.
In value terms, the largest iron and steel forging suppliers to the United States were India ($4M), China ($2.1M) and Canada ($1.4M), with a combined 75% share of total imports.
India, with a CAGR of +11.8%, saw the highest growth rate of the value of imports, in terms of the main suppliers over the period under review, while purchases for the other leaders experienced more modest paces of growth.
Import Prices by Country
In August 2023, the iron and steel forging price stood at $5.0 per unit (CIF, US), dropping by -2.5% against the previous month. Over the period under review, the import price recorded a relatively flat trend pattern. The pace of growth was the most pronounced in October 2022 an increase of 13% m-o-m. Over the period under review, average import prices reached the maximum at $5.4 per unit in December 2022; however, from January 2023 to August 2023, import prices failed to regain momentum.
Average prices varied noticeably amongst the major supplying countries. In August 2023, the countries with the highest prices were Italy ($5.6 per unit) and Canada ($5.2 per unit), while the price for Mexico ($4.9 per unit) and India ($4.9 per unit) were amongst the lowest.
From August 2022 to August 2023, the most notable rate of growth in terms of prices was attained by Italy (+0.8%), while the prices for the other major suppliers experienced more modest paces of growth.
This report provides an in-depth analysis of the market for iron and steel forging in the U.S.. Within it, you will discover the latest data on market trends and opportunities by country, consumption, production and price developments, as well as the global trade (imports and exports). The forecast exhibits the market prospects through 2030.
Product coverage:
- NAICS 332111 - Iron and steel forging
Companies mentioned:
- Fairfield Manufacturing Company
- Scot Forge Company
- Joy Global Surface Mining Inc.
- Ameriforge Group
- Wyman-Gordon Forgings
- Rockford Products
- Impact Forge Group
- Canton Drop Forge
- Sypris Technologies
- GKN Driveline Newton
- Park-Ohio Holdings Corp.
- Ellwood Texas Forge Navasota
- The Crosby Group
- Ameriforge Corporation
- ATI Ladish, Colfor Manufacturing
- Form Hhi Tech
- Park-Ohio Industries
- A T I Funding Corporation
- Geneve Holdings
- North American Hoganas Holdings
- Cordier Group Holdings
- Tdy Holdings
- PSEG Nuclear
- Hephaestus Holdings
- Ieh FM Holdings
- ATI Titanium
- M P I International
- Handy & Harman Group
- ATI Operating Holdings
- Federal-Mogul Holdings Corporation
Country coverage:
- United States
Data coverage:
- Market volume and value
- Per Capita consumption
- Forecast of the market dynamics in the medium term
- Trade (exports and imports) in the U.S.
- Export and import prices
- Market trends, drivers and restraints
- Key market players and their profiles
Reasons to buy this report:
- Take advantage of the latest data
- Find deeper insights into current market developments
- Discover vital success factors affecting the market
This report is designed for manufacturers, distributors, importers, and wholesalers, as well as for investors, consultants and advisors.
In this report, you can find information that helps you to make informed decisions on the following issues:
- How to diversify your business and benefit from new market opportunities
- How to load your idle production capacity
- How to boost your sales on overseas markets
- How to increase your profit margins
- How to make your supply chain more sustainable
- How to reduce your production and supply chain costs
- How to outsource production to other countries
- How to prepare your business for global expansion
While doing this research, we combine the accumulated expertise of our analysts and the capabilities of artificial intelligence. The AI-based platform, developed by our data scientists, constitutes the key working tool for business analysts, empowering them to discover deep insights and ideas from the marketing data.
-
1. INTRODUCTION
Making Data-Driven Decisions to Grow Your Business
- REPORT DESCRIPTION
- RESEARCH METHODOLOGY AND AI PLATFORM
- DATA-DRIVEN DECISIONS FOR YOUR BUSINESS
- GLOSSARY AND SPECIFIC TERMS
-
2. EXECUTIVE SUMMARY
A Quick Overview of Market Performance
- KEY FINDINGS
- MARKET TRENDS This Chapter is Available Only for the Professional Edition PRO
-
3. MARKET OVERVIEW
Understanding the Current State of The Market and Its Prospects
- MARKET SIZE
- MARKET STRUCTURE
- TRADE BALANCE
- PER CAPITA CONSUMPTION
- MARKET FORECAST TO 2030
-
4. MOST PROMISING PRODUCT
Finding New Products to Diversify Your Business
This Chapter is Available Only for the Professional Edition PRO- TOP PRODUCTS TO DIVERSIFY YOUR BUSINESS
- BEST-SELLING PRODUCTS
- MOST CONSUMED PRODUCT
- MOST TRADED PRODUCT
- MOST PROFITABLE PRODUCT FOR EXPORT
-
5. MOST PROMISING SUPPLYING COUNTRIES
Choosing the Best Countries to Establish Your Sustainable Supply Chain
This Chapter is Available Only for the Professional Edition PRO- TOP COUNTRIES TO SOURCE YOUR PRODUCT
- TOP PRODUCING COUNTRIES
- TOP EXPORTING COUNTRIES
- LOW-COST EXPORTING COUNTRIES
-
6. MOST PROMISING OVERSEAS MARKETS
Choosing the Best Countries to Boost Your Exports
This Chapter is Available Only for the Professional Edition PRO- TOP OVERSEAS MARKETS FOR EXPORTING YOUR PRODUCT
- TOP CONSUMING MARKETS
- UNSATURATED MARKETS
- TOP IMPORTING MARKETS
- MOST PROFITABLE MARKETS
7. PRODUCTION
The Latest Trends and Insights into The Industry
- PRODUCTION VOLUME AND VALUE
8. IMPORTS
The Largest Import Supplying Countries
- IMPORTS FROM 2012–2023
- IMPORTS BY COUNTRY
- IMPORT PRICES BY COUNTRY
9. EXPORTS
The Largest Destinations for Exports
- EXPORTS FROM 2012–2023
- EXPORTS BY COUNTRY
- EXPORT PRICES BY COUNTRY
-
10. PROFILES OF MAJOR PRODUCERS
The Largest Producers on The Market and Their Profiles
This Chapter is Available Only for the Professional Edition PRO -
LIST OF TABLES
- Key Findings In 2023
- Market Volume, In Physical Terms, 2012–2023
- Market Value, 2012–2023
- Per Capita Consumption In 2012-2023
- Imports, In Physical Terms, By Country, 2012–2023
- Imports, In Value Terms, By Country, 2012–2023
- Import Prices, By Country Of Origin, 2012–2023
- Exports, In Physical Terms, By Country, 2012–2023
- Exports, In Value Terms, By Country, 2012–2023
- Export Prices, By Country Of Destination, 2012–2023
-
LIST OF FIGURES
- Market Volume, In Physical Terms, 2012–2023
- Market Value, 2012–2023
- Market Structure – Domestic Supply vs. Imports, In Physical Terms, 2012-2023
- Market Structure – Domestic Supply vs. Imports, In Value Terms, 2012-2023
- Trade Balance, In Physical Terms, 2012-2023
- Trade Balance, In Value Terms, 2012-2023
- Per Capita Consumption, 2012-2023
- Market Volume Forecast to 2030
- Market Value Forecast to 2030
- Products: Market Size And Growth, By Type
- Products: Average Per Capita Consumption, By Type
- Products: Exports And Growth, By Type
- Products: Export Prices And Growth, By Type
- Production Volume And Growth
- Exports And Growth
- Export Prices And Growth
- Market Size And Growth
- Per Capita Consumption
- Imports And Growth
- Import Prices
- Production, In Physical Terms, 2012–2023
- Production, In Value Terms, 2012–2023
- Imports, In Physical Terms, 2012–2023
- Imports, In Value Terms, 2012–2023
- Imports, In Physical Terms, By Country, 2023
- Imports, In Physical Terms, By Country, 2012–2023
- Imports, In Value Terms, By Country, 2012–2023
- Import Prices, By Country Of Origin, 2012–2023
- Exports, In Physical Terms, 2012–2023
- Exports, In Value Terms, 2012–2023
- Exports, In Physical Terms, By Country, 2023
- Exports, In Physical Terms, By Country, 2012–2023
- Exports, In Value Terms, By Country, 2012–2023
- Export Prices, By Country Of Destination, 2012–2023


