
U.S. Electromedical And Electrotherapeutic Apparatus Market. Analysis And Forecast to 2030
Get instant access to more than 2 million reports, dashboards, and datasets on the IndexBox Platform.
View PricingAugust 2023 Sees a Small Decrease in U.S. Imports of Electromedical and Electrotherapeutic Apparatus to $1.6B
U.S. Electromedical And Electrotherapeutic Apparatus Imports
In August 2023, approximately 32M units of electromedical and electrotherapeutic apparatus were imported into the United States; increasing by 2.9% compared with the previous month. In general, imports continue to indicate a relatively flat trend pattern. The pace of growth appeared the most rapid in February 2023 with an increase of 16% m-o-m. Imports peaked at 33M units in March 2023; however, from April 2023 to August 2023, imports failed to regain momentum.
In value terms, electromedical and electrotherapeutic apparatus imports fell slightly to $1.6B (IndexBox estimates) in August 2023. Over the period under review, imports continue to indicate a relatively flat trend pattern. The growth pace was the most rapid in March 2023 with an increase of 17% m-o-m. Over the period under review, imports hit record highs at 1.7B units in June 2023; however, from July 2023 to August 2023, imports remained at a lower figure.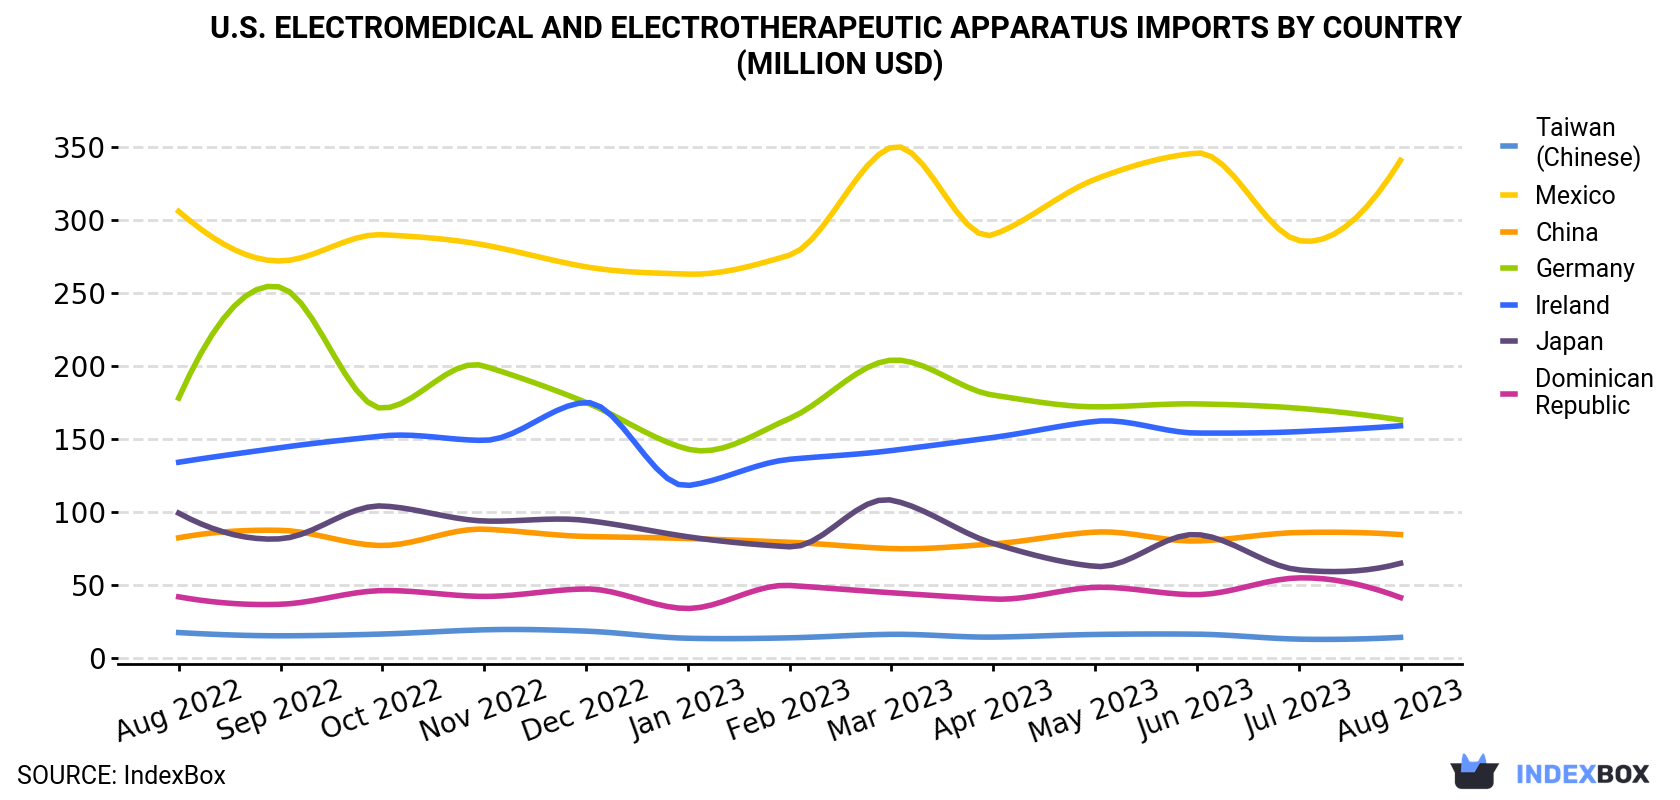
| COUNTRY | Import Value of Electromedical And Electrotherapeutic Apparatus in U.S. (million USD) | ||||||||||||
|---|---|---|---|---|---|---|---|---|---|---|---|---|---|
| Aug 2022 | Sep 2022 | Oct 2022 | Nov 2022 | Dec 2022 | Jan 2023 | Feb 2023 | Mar 2023 | Apr 2023 | May 2023 | Jun 2023 | Jul 2023 | Aug 2023 | |
| Mexico | 306 | 272 | 290 | 283 | 268 | 263 | 276 | 350 | 290 | 328 | 346 | 286 | 341 |
| Germany | 178 | 254 | 171 | 200 | 175 | 143 | 164 | 204 | 180 | 172 | 174 | 171 | 163 |
| Ireland | 134 | 144 | 152 | 149 | 175 | 118 | 136 | 142 | 151 | 162 | 154 | 155 | 159 |
| China | 82.2 | 87.3 | 76.9 | 88.1 | 83.1 | 81.7 | 79.1 | 74.8 | 78.0 | 86.1 | 80.0 | 85.8 | 84.4 |
| Japan | 99.1 | 81.5 | 104 | 93.7 | 94.1 | 82.9 | 76.0 | 108 | 78.3 | 62.6 | 84.4 | 60.2 | 64.7 |
| Dominican Republic | 41.7 | 36.6 | 46.0 | 42.0 | 47.1 | 33.7 | 49.5 | 44.5 | 40.2 | 48.2 | 43.2 | 54.7 | 41.2 |
| Taiwan (Chinese) | 17.2 | 15.0 | 16.2 | 19.1 | 18.2 | 13.3 | 13.6 | 16.0 | 14.1 | 15.9 | 16.1 | 12.7 | 13.9 |
| Others | 575 | 677 | 657 | 686 | 696 | 624 | 625 | 721 | 681 | 702 | 772 | 745 | 689 |
| Total | 1,433 | 1,568 | 1,513 | 1,561 | 1,556 | 1,359 | 1,419 | 1,660 | 1,513 | 1,576 | 1,670 | 1,570 | 1,556 |
Imports by Country
In August 2023, Mexico (14M units) constituted the largest electromedical and electrotherapeutic apparatus supplier to the United States, accounting for a 43% share of total imports. Moreover, electromedical and electrotherapeutic apparatus imports from Mexico exceeded the figures recorded by the second-largest supplier, the Dominican Republic (3.9M units), fourfold. China (2.8M units) ranked third in terms of total imports with an 8.8% share.
From August 2022 to August 2023, the average monthly rate of growth in terms of volume from Mexico stood at +1.2%. The remaining supplying countries recorded the following average monthly rates of imports growth: the Dominican Republic (+0.0% per month) and China (-0.7% per month).
In value terms, Mexico ($341M) constituted the largest supplier of electromedical and electrotherapeutic apparatus to the United States, comprising 22% of total imports. The second position in the ranking was taken by Germany ($163M), with a 10% share of total imports. It was followed by Ireland, with a 10% share.
From August 2022 to August 2023, the average monthly rate of growth in terms of value from Mexico was relatively modest. The remaining supplying countries recorded the following average monthly rates of imports growth: Germany (-0.8% per month) and Ireland (+1.4% per month).
Import Prices by Country
In August 2023, the electromedical and electrotherapeutic apparatus price stood at $48.2 per unit (CIF, US), shrinking by -3.7% against the previous month. Over the period under review, the import price, however, saw a relatively flat trend pattern. The growth pace was the most rapid in September 2022 when the average import price increased by 19% m-o-m. As a result, import price attained the peak level of $53,888 per thousand units. From October 2022 to August 2023, the average import prices failed to regain momentum.
There were significant differences in the average prices amongst the major supplying countries. In August 2023, the country with the highest price was Costa Rica ($122 per unit), while the price for the Philippines ($8.5 per unit) was amongst the lowest.
From August 2022 to August 2023, the most notable rate of growth in terms of prices was attained by Ireland (+5.7%), while the prices for the other major suppliers experienced more modest paces of growth.
This report provides an in-depth analysis of the market for electromedical and electrotherapeutic apparatus in the U.S.. Within it, you will discover the latest data on market trends and opportunities by country, consumption, production and price developments, as well as the global trade (imports and exports). The forecast exhibits the market prospects through 2030.
Product coverage:
- NAICS 334510 - Electromedical and electrotherapeutic apparatus manufacturing
Companies mentioned:
- St. Jude Medical
- Zimmer Biomet Holdings
- Varian Medical Systems
- Medtronic
- Hologic, Abbott Vascular
- Zoll Medical Corporation
- Cyberonics
- Fujifilm Sonosite
- Biomerieux
- Masimo Corporation
- Starkey Laboratories
- Volcano Corporation
- Philips Ultrasound
- Thoratec Corporation
- Nxstage Medical
- Danaher Corporation
- Abiomed
- GE Medical Systems Information Technologies
- Natus Medical Incorporated
- Conmed Corporation
- Pacesetter
- Amplifon (usa)
- Zimmer
- Cynosure
- Mindray Ds Usa
- Orchid Orthopedic Solutions
- Zoll Services
- Datex-Ohmeda
- Medtronic Minimed
- Terumo Cardiovascular Systems Corporation
- Nellcor Puritan Bennett Incorporated
- Cardiac Pacemakers
- Halyard Sales
Country coverage:
- United States
Data coverage:
- Market volume and value
- Per Capita consumption
- Forecast of the market dynamics in the medium term
- Trade (exports and imports) in the U.S.
- Export and import prices
- Market trends, drivers and restraints
- Key market players and their profiles
Reasons to buy this report:
- Take advantage of the latest data
- Find deeper insights into current market developments
- Discover vital success factors affecting the market
This report is designed for manufacturers, distributors, importers, and wholesalers, as well as for investors, consultants and advisors.
In this report, you can find information that helps you to make informed decisions on the following issues:
- How to diversify your business and benefit from new market opportunities
- How to load your idle production capacity
- How to boost your sales on overseas markets
- How to increase your profit margins
- How to make your supply chain more sustainable
- How to reduce your production and supply chain costs
- How to outsource production to other countries
- How to prepare your business for global expansion
While doing this research, we combine the accumulated expertise of our analysts and the capabilities of artificial intelligence. The AI-based platform, developed by our data scientists, constitutes the key working tool for business analysts, empowering them to discover deep insights and ideas from the marketing data.
-
1. INTRODUCTION
Making Data-Driven Decisions to Grow Your Business
- REPORT DESCRIPTION
- RESEARCH METHODOLOGY AND AI PLATFORM
- DATA-DRIVEN DECISIONS FOR YOUR BUSINESS
- GLOSSARY AND SPECIFIC TERMS
-
2. EXECUTIVE SUMMARY
A Quick Overview of Market Performance
- KEY FINDINGS
- MARKET TRENDS This Chapter is Available Only for the Professional Edition PRO
-
3. MARKET OVERVIEW
Understanding the Current State of The Market and Its Prospects
- MARKET SIZE
- MARKET STRUCTURE
- TRADE BALANCE
- PER CAPITA CONSUMPTION
- MARKET FORECAST TO 2030
-
4. MOST PROMISING PRODUCT
Finding New Products to Diversify Your Business
This Chapter is Available Only for the Professional Edition PRO- TOP PRODUCTS TO DIVERSIFY YOUR BUSINESS
- BEST-SELLING PRODUCTS
- MOST CONSUMED PRODUCT
- MOST TRADED PRODUCT
- MOST PROFITABLE PRODUCT FOR EXPORT
-
5. MOST PROMISING SUPPLYING COUNTRIES
Choosing the Best Countries to Establish Your Sustainable Supply Chain
This Chapter is Available Only for the Professional Edition PRO- TOP COUNTRIES TO SOURCE YOUR PRODUCT
- TOP PRODUCING COUNTRIES
- TOP EXPORTING COUNTRIES
- LOW-COST EXPORTING COUNTRIES
-
6. MOST PROMISING OVERSEAS MARKETS
Choosing the Best Countries to Boost Your Exports
This Chapter is Available Only for the Professional Edition PRO- TOP OVERSEAS MARKETS FOR EXPORTING YOUR PRODUCT
- TOP CONSUMING MARKETS
- UNSATURATED MARKETS
- TOP IMPORTING MARKETS
- MOST PROFITABLE MARKETS
7. PRODUCTION
The Latest Trends and Insights into The Industry
- PRODUCTION VOLUME AND VALUE
8. IMPORTS
The Largest Import Supplying Countries
- IMPORTS FROM 2012–2023
- IMPORTS BY COUNTRY
- IMPORT PRICES BY COUNTRY
9. EXPORTS
The Largest Destinations for Exports
- EXPORTS FROM 2012–2023
- EXPORTS BY COUNTRY
- EXPORT PRICES BY COUNTRY
-
10. PROFILES OF MAJOR PRODUCERS
The Largest Producers on The Market and Their Profiles
This Chapter is Available Only for the Professional Edition PRO -
LIST OF TABLES
- Key Findings In 2023
- Market Volume, In Physical Terms, 2012–2023
- Market Value, 2012–2023
- Per Capita Consumption In 2012-2023
- Imports, In Physical Terms, By Country, 2012–2023
- Imports, In Value Terms, By Country, 2012–2023
- Import Prices, By Country Of Origin, 2012–2023
- Exports, In Physical Terms, By Country, 2012–2023
- Exports, In Value Terms, By Country, 2012–2023
- Export Prices, By Country Of Destination, 2012–2023
-
LIST OF FIGURES
- Market Volume, In Physical Terms, 2012–2023
- Market Value, 2012–2023
- Market Structure – Domestic Supply vs. Imports, In Physical Terms, 2012-2023
- Market Structure – Domestic Supply vs. Imports, In Value Terms, 2012-2023
- Trade Balance, In Physical Terms, 2012-2023
- Trade Balance, In Value Terms, 2012-2023
- Per Capita Consumption, 2012-2023
- Market Volume Forecast to 2030
- Market Value Forecast to 2030
- Products: Market Size And Growth, By Type
- Products: Average Per Capita Consumption, By Type
- Products: Exports And Growth, By Type
- Products: Export Prices And Growth, By Type
- Production Volume And Growth
- Exports And Growth
- Export Prices And Growth
- Market Size And Growth
- Per Capita Consumption
- Imports And Growth
- Import Prices
- Production, In Physical Terms, 2012–2023
- Production, In Value Terms, 2012–2023
- Imports, In Physical Terms, 2012–2023
- Imports, In Value Terms, 2012–2023
- Imports, In Physical Terms, By Country, 2023
- Imports, In Physical Terms, By Country, 2012–2023
- Imports, In Value Terms, By Country, 2012–2023
- Import Prices, By Country Of Origin, 2012–2023
- Exports, In Physical Terms, 2012–2023
- Exports, In Value Terms, 2012–2023
- Exports, In Physical Terms, By Country, 2023
- Exports, In Physical Terms, By Country, 2012–2023
- Exports, In Value Terms, By Country, 2012–2023
- Export Prices, By Country Of Destination, 2012–2023


