
U.S. Carpet And Rug Market. Analysis And Forecast to 2030
Get instant access to more than 2 million reports, dashboards, and datasets on the IndexBox Platform.
View PricingPrice of Carpets and Rugs Surges by 6% in the United States, Reaching An Average of $8.7 per Square Meter
U.S. Carpet And Rug Import Price in August 2023
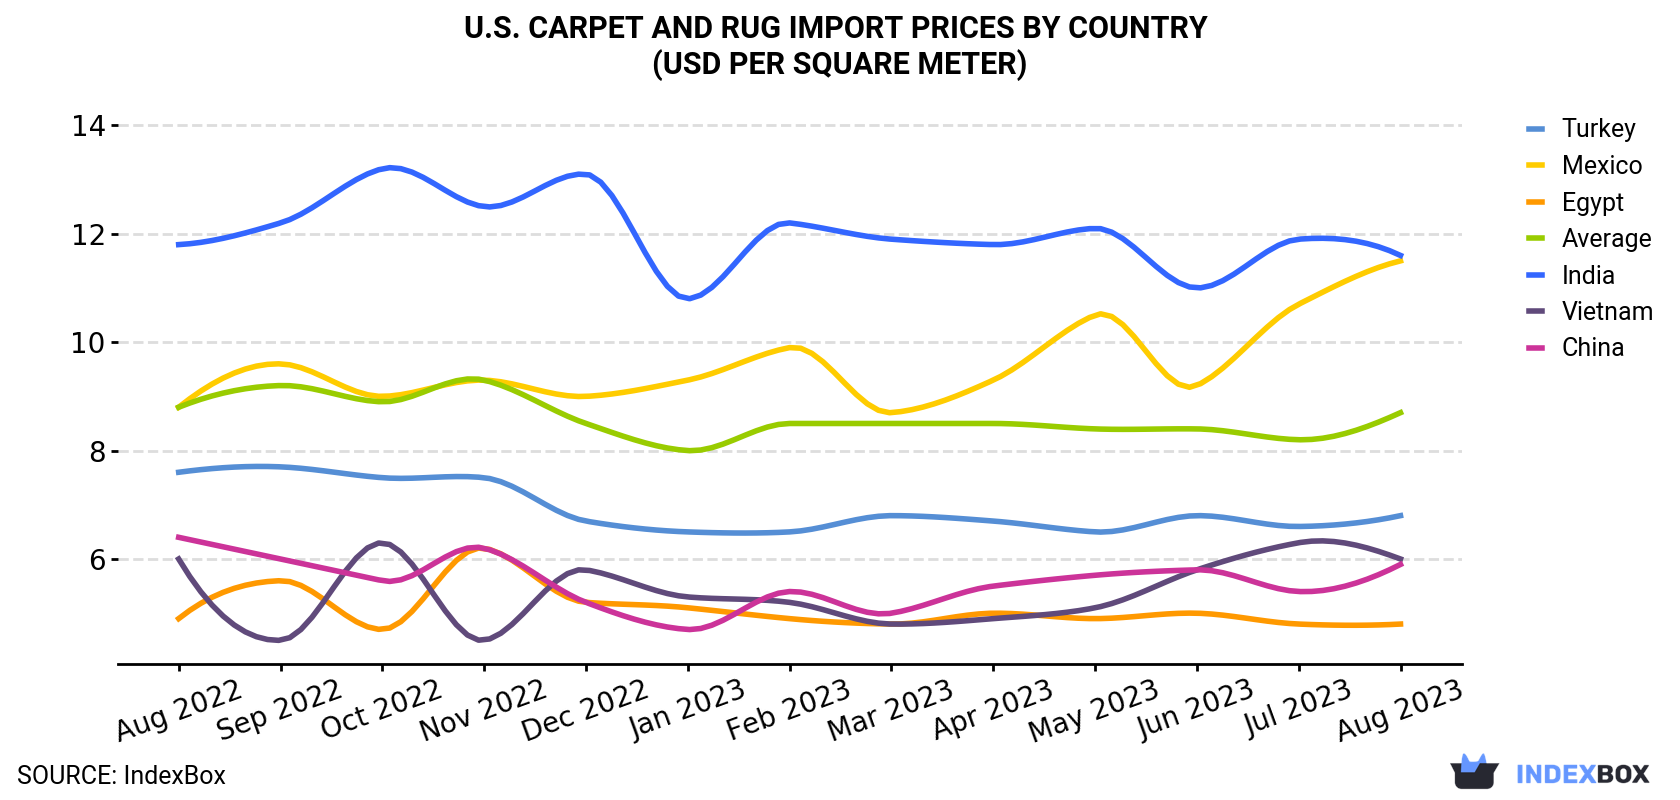
In August 2023, the carpet and rug price stood at $8.7 per square meter (CIF, US), surging by 5.5% against the previous month. Overall, the import price, however, saw a relatively flat trend pattern. The import price peaked at $9.3 per square meter in November 2022; however, from December 2022 to August 2023, import prices remained at a lower figure.
There were significant differences in the average prices amongst the major supplying countries. In August 2023, the country with the highest price was India ($11.6 per square meter), while the price for Egypt ($4.8 per square meter) was amongst the lowest.
From August 2022 to August 2023, the most notable rate of growth in terms of prices was attained by Mexico (+2.2%), while the prices for the other major suppliers experienced a decline.
| COUNTRY | Import Price of Carpet And Rug in U.S. (USD per square meter) | ||||||||||||
|---|---|---|---|---|---|---|---|---|---|---|---|---|---|
| Aug 2022 | Sep 2022 | Oct 2022 | Nov 2022 | Dec 2022 | Jan 2023 | Feb 2023 | Mar 2023 | Apr 2023 | May 2023 | Jun 2023 | Jul 2023 | Aug 2023 | |
| India | 11.8 | 12.2 | 13.2 | 12.5 | 13.1 | 10.8 | 12.2 | 11.9 | 11.8 | 12.1 | 11.0 | 11.9 | 11.6 |
| Mexico | 8.8 | 9.6 | 9.0 | 9.3 | 9.0 | 9.3 | 9.9 | 8.7 | 9.3 | 10.5 | 9.2 | 10.7 | 11.5 |
| Turkey | 7.6 | 7.7 | 7.5 | 7.5 | 6.7 | 6.5 | 6.5 | 6.8 | 6.7 | 6.5 | 6.8 | 6.6 | 6.8 |
| Vietnam | 6.0 | 4.5 | 6.3 | 4.5 | 5.8 | 5.3 | 5.2 | 4.8 | 4.9 | 5.1 | 5.8 | 6.3 | 6.0 |
| China | 6.4 | 6.0 | 5.6 | 6.2 | 5.2 | 4.7 | 5.4 | 5.0 | 5.5 | 5.7 | 5.8 | 5.4 | 5.9 |
| Egypt | 4.9 | 5.6 | 4.7 | 6.2 | 5.2 | 5.1 | 4.9 | 4.8 | 5.0 | 4.9 | 5.0 | 4.8 | 4.8 |
| Average | 8.8 | 9.2 | 8.9 | 9.3 | 8.5 | 8.0 | 8.5 | 8.5 | 8.5 | 8.4 | 8.4 | 8.2 | 8.7 |
U.S. Carpet And Rug Imports
In August 2023, the amount of carpets and rugs imported into the United States fell to 30M square meters, declining by -14.5% compared with the previous month. In general, imports continue to indicate a relatively flat trend pattern. The most prominent rate of growth was recorded in May 2023 when imports increased by 17% m-o-m. Over the period under review, imports attained the peak figure at 36M square meters in January 2023; however, from February 2023 to August 2023, imports remained at a lower figure.
In value terms, carpet and rug imports shrank to $262M (IndexBox estimates) in August 2023. Overall, imports showed a relatively flat trend pattern. The growth pace was the most rapid in May 2023 with an increase of 16% against the previous month. Imports peaked at 291M square meters in November 2022; however, from December 2022 to August 2023, imports stood at a somewhat lower figure.
U.S. Carpet And Rug Imports by Country
Turkey (8M square meters), India (7.5M square meters) and China (6M square meters) were the main suppliers of carpet and rug imports to the United States, together accounting for 71% of total imports. Vietnam, Egypt, Mexico and the Netherlands lagged somewhat behind, together accounting for a further 20%.
From August 2022 to August 2023, the biggest increases were in the Netherlands (with a CAGR of +4.5%), while purchases for the other leaders experienced more modest paces of growth.
In value terms, India ($87M), Turkey ($54M) and China ($36M) appeared to be the largest carpet and rug suppliers to the United States, with a combined 67% share of total imports. Mexico, Vietnam, Egypt and the Netherlands lagged somewhat behind, together accounting for a further 16%.
Among the main suppliers, the Netherlands, with a CAGR of +5.2%, recorded the highest rates of growth with regard to the value of imports, over the period under review, while purchases for the other leaders experienced more modest paces of growth.
This report provides an in-depth analysis of the carpet and rug market in the U.S.. Within it, you will discover the latest data on market trends and opportunities by country, consumption, production and price developments, as well as the global trade (imports and exports). The forecast exhibits the market prospects through 2030.
Product coverage:
- NAICS 314110 - Carpet and rug mills
Companies mentioned:
- Shaw Industries
- Mohawk Industries
- Bentley Mills
- J & J Industries
- Tandus Centiva
- Interface
- Tdg Operations
- Mountville Mills
- Royalty Carpet Mills
- Syntec Industries
- The Dixie Group
- Oriental Weavers U.S.A.
- Lexmark Carpet Mills
- Garland Sales
- Apache Mills
- Rieter Automotive North America
- Engineered Floors
- Interfaceflor
- Mohawk Carpet
- Beaulieu of America
- Maples Industries
- Aladdin Manufacturing Corporation
- Tandus Group
- Beaulieu Group
- Mohawk Carpet Distribution
- General Felt Industries
- Interface Americas
- Bari Home Corporation
Country coverage:
- United States
Data coverage:
- Market volume and value
- Per Capita consumption
- Forecast of the market dynamics in the medium term
- Trade (exports and imports) in the U.S.
- Export and import prices
- Market trends, drivers and restraints
- Key market players and their profiles
Reasons to buy this report:
- Take advantage of the latest data
- Find deeper insights into current market developments
- Discover vital success factors affecting the market
This report is designed for manufacturers, distributors, importers, and wholesalers, as well as for investors, consultants and advisors.
In this report, you can find information that helps you to make informed decisions on the following issues:
- How to diversify your business and benefit from new market opportunities
- How to load your idle production capacity
- How to boost your sales on overseas markets
- How to increase your profit margins
- How to make your supply chain more sustainable
- How to reduce your production and supply chain costs
- How to outsource production to other countries
- How to prepare your business for global expansion
While doing this research, we combine the accumulated expertise of our analysts and the capabilities of artificial intelligence. The AI-based platform, developed by our data scientists, constitutes the key working tool for business analysts, empowering them to discover deep insights and ideas from the marketing data.
-
1. INTRODUCTION
Making Data-Driven Decisions to Grow Your Business
- REPORT DESCRIPTION
- RESEARCH METHODOLOGY AND AI PLATFORM
- DATA-DRIVEN DECISIONS FOR YOUR BUSINESS
- GLOSSARY AND SPECIFIC TERMS
-
2. EXECUTIVE SUMMARY
A Quick Overview of Market Performance
- KEY FINDINGS
- MARKET TRENDS This Chapter is Available Only for the Professional Edition PRO
-
3. MARKET OVERVIEW
Understanding the Current State of The Market and Its Prospects
- MARKET SIZE
- MARKET STRUCTURE
- TRADE BALANCE
- PER CAPITA CONSUMPTION
- MARKET FORECAST TO 2030
-
4. MOST PROMISING PRODUCT
Finding New Products to Diversify Your Business
This Chapter is Available Only for the Professional Edition PRO- TOP PRODUCTS TO DIVERSIFY YOUR BUSINESS
- BEST-SELLING PRODUCTS
- MOST CONSUMED PRODUCT
- MOST TRADED PRODUCT
- MOST PROFITABLE PRODUCT FOR EXPORT
-
5. MOST PROMISING SUPPLYING COUNTRIES
Choosing the Best Countries to Establish Your Sustainable Supply Chain
This Chapter is Available Only for the Professional Edition PRO- TOP COUNTRIES TO SOURCE YOUR PRODUCT
- TOP PRODUCING COUNTRIES
- TOP EXPORTING COUNTRIES
- LOW-COST EXPORTING COUNTRIES
-
6. MOST PROMISING OVERSEAS MARKETS
Choosing the Best Countries to Boost Your Exports
This Chapter is Available Only for the Professional Edition PRO- TOP OVERSEAS MARKETS FOR EXPORTING YOUR PRODUCT
- TOP CONSUMING MARKETS
- UNSATURATED MARKETS
- TOP IMPORTING MARKETS
- MOST PROFITABLE MARKETS
7. PRODUCTION
The Latest Trends and Insights into The Industry
- PRODUCTION VOLUME AND VALUE
8. IMPORTS
The Largest Import Supplying Countries
- IMPORTS FROM 2012–2023
- IMPORTS BY COUNTRY
- IMPORT PRICES BY COUNTRY
9. EXPORTS
The Largest Destinations for Exports
- EXPORTS FROM 2012–2023
- EXPORTS BY COUNTRY
- EXPORT PRICES BY COUNTRY
-
10. PROFILES OF MAJOR PRODUCERS
The Largest Producers on The Market and Their Profiles
This Chapter is Available Only for the Professional Edition PRO -
LIST OF TABLES
- Key Findings In 2023
- Market Volume, In Physical Terms, 2012–2023
- Market Value, 2012–2023
- Per Capita Consumption In 2012-2023
- Imports, In Physical Terms, By Country, 2012–2023
- Imports, In Value Terms, By Country, 2012–2023
- Import Prices, By Country Of Origin, 2012–2023
- Exports, In Physical Terms, By Country, 2012–2023
- Exports, In Value Terms, By Country, 2012–2023
- Export Prices, By Country Of Destination, 2012–2023
-
LIST OF FIGURES
- Market Volume, In Physical Terms, 2012–2023
- Market Value, 2012–2023
- Market Structure – Domestic Supply vs. Imports, In Physical Terms, 2012-2023
- Market Structure – Domestic Supply vs. Imports, In Value Terms, 2012-2023
- Trade Balance, In Physical Terms, 2012-2023
- Trade Balance, In Value Terms, 2012-2023
- Per Capita Consumption, 2012-2023
- Market Volume Forecast to 2030
- Market Value Forecast to 2030
- Products: Market Size And Growth, By Type
- Products: Average Per Capita Consumption, By Type
- Products: Exports And Growth, By Type
- Products: Export Prices And Growth, By Type
- Production Volume And Growth
- Exports And Growth
- Export Prices And Growth
- Market Size And Growth
- Per Capita Consumption
- Imports And Growth
- Import Prices
- Production, In Physical Terms, 2012–2023
- Production, In Value Terms, 2012–2023
- Imports, In Physical Terms, 2012–2023
- Imports, In Value Terms, 2012–2023
- Imports, In Physical Terms, By Country, 2023
- Imports, In Physical Terms, By Country, 2012–2023
- Imports, In Value Terms, By Country, 2012–2023
- Import Prices, By Country Of Origin, 2012–2023
- Exports, In Physical Terms, 2012–2023
- Exports, In Value Terms, 2012–2023
- Exports, In Physical Terms, By Country, 2023
- Exports, In Physical Terms, By Country, 2012–2023
- Exports, In Value Terms, By Country, 2012–2023
- Export Prices, By Country Of Destination, 2012–2023


