
U.S. - Air Conditioning Machines - Market Analysis, Forecast, Size, Trends and Insights
Get instant access to more than 2 million reports, dashboards, and datasets on the IndexBox Platform.
View PricingImport of Air Conditioning Machines in June 2023 Declines to $392M in the United States
U.S. Air Conditioning Machine Imports
In June 2023, supplies from abroad of air conditioning machines decreased by -56.3% to 845K units, falling for the third month in a row after four months of growth. Overall, imports continue to indicate a noticeable contraction. The most prominent rate of growth was recorded in January 2023 with an increase of 134% m-o-m. Imports peaked at 2.3M units in March 2023; however, from April 2023 to June 2023, imports remained at a lower figure.
In value terms, air conditioning machine imports declined significantly to $392M (IndexBox estimates) in June 2023. In general, imports continue to indicate a slight reduction. The growth pace was the most rapid in February 2023 with an increase of 28% m-o-m. Over the period under review, imports reached the maximum at 574M units in March 2023; however, from April 2023 to June 2023, imports stood at a somewhat lower figure. 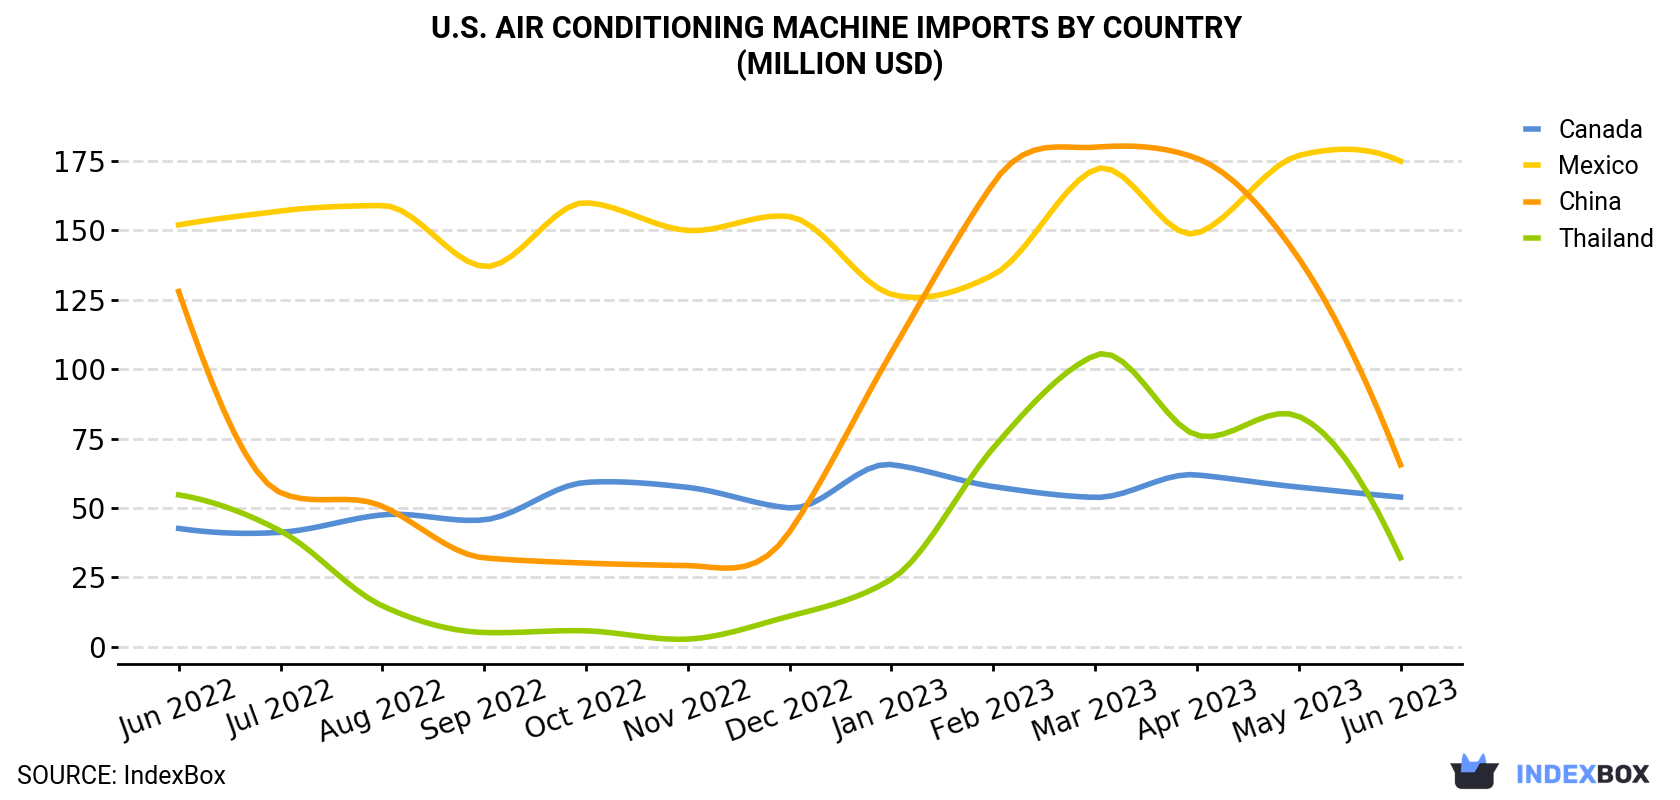
| COUNTRY | Import Value of Air Conditioning Machine in U.S. (million USD) | ||||||||||||
|---|---|---|---|---|---|---|---|---|---|---|---|---|---|
| Jun 2022 | Jul 2022 | Aug 2022 | Sep 2022 | Oct 2022 | Nov 2022 | Dec 2022 | Jan 2023 | Feb 2023 | Mar 2023 | Apr 2023 | May 2023 | Jun 2023 | |
| Mexico | 152 | 157 | 159 | 137 | 160 | 150 | 155 | 127 | 134 | 172 | 149 | 177 | 175 |
| China | 128 | 55.5 | 50.6 | 32.0 | 30.1 | 29.2 | 41.4 | 106 | 167 | 180 | 176 | 140 | 65.5 |
| Canada | 42.6 | 41.2 | 47.5 | 45.7 | 59.2 | 57.4 | 50.0 | 65.6 | 57.7 | 53.8 | 61.9 | 57.5 | 53.9 |
| Thailand | 54.7 | 41.7 | 14.7 | 5.1 | 5.7 | 2.7 | 11.0 | 24.3 | 71.6 | 105 | 76.2 | 83.0 | 32.0 |
| Others | 64.4 | 52.6 | 51.2 | 44.8 | 39.0 | 43.6 | 42.1 | 51.3 | 47.5 | 62.3 | 57.8 | 56.7 | 65.1 |
| Total | 442 | 348 | 323 | 265 | 294 | 283 | 300 | 375 | 478 | 574 | 520 | 515 | 392 |
Imports by Country
China (350K units), Thailand (207K units) and Mexico (174K units) were the main suppliers of air conditioning machine imports to the United States, with a combined 86% share of total imports. These countries were followed by Canada, which accounted for a further 4.1%.
From June 2022 to June 2023, the most notable rate of growth in terms of purchases, amongst the main suppliers, was attained by Canada (with a CAGR of +2.3%), while imports for the other leaders experienced a decline.
In value terms, Mexico ($175M) constituted the largest supplier of air conditioning machine to the United States, comprising 45% of total imports. The second position in the ranking was taken by China ($66M), with a 17% share of total imports. It was followed by Canada, with a 14% share.
From June 2022 to June 2023, the average monthly growth rate of value from Mexico stood at +1.2%. The remaining supplying countries recorded the following average monthly rates of imports growth: China (-5.4% per month) and Canada (+2.0% per month).
Imports by Type
Window or wall air conditioning systems, self-contained or split-systems (420K units), air conditioning machines with refrigeration unit (250K units) and air conditioning machines for motor vehicles (125K units) were the main products of air conditioning machine imports to the United States, together accounting for 94% of total imports. These products were followed by air conditioning machines without refrigeration unit , which accounted for a further 5.8%.
From June 2022 to June 2023, the most notable rate of growth in terms of purchases, amongst the major product types, was attained by air conditioning machins without refrigeration unit (with a CAGR of +0.6%), while imports for the other products experienced a decline.
In value terms, air conditioning machines with refrigeration unit ($236M) constituted the largest type of air conditioning machine supplied to the United States, comprising 60% of total imports. The second position in the ranking was taken by window or wall air conditioning systems, self-contained or split-systems ($80M), with a 20% share of total imports. It was followed by air conditioning machines without refrigeration unit , with a 14% share.
Import Prices by Country
In June 2023, the air conditioning machine price stood at $464 per unit (CIF, US), jumping by 74% against the previous month. Over the period under review, the import price enjoyed pronounced growth. Over the period under review, average import prices reached the peak figure at $896 per unit in November 2022; however, from December 2022 to June 2023, import prices remained at a lower figure.
Prices varied noticeably by the country of origin: the country with the highest price was Canada ($1,549 per unit), while the price for Thailand ($155 per unit) was amongst the lowest.
From June 2022 to June 2023, the most notable rate of growth in terms of prices was attained by Mexico (+2.4%), while the prices for the other major suppliers experienced more modest paces of growth.
This report provides an in-depth analysis of the air conditioning machine market in the U.S.. Within it, you will discover the latest data on market trends and opportunities by country, consumption, production and price developments, as well as the global trade (imports and exports). The forecast exhibits the market prospects through 2030.
Product coverage:
- Prodcom 28251220 - Window or wall air conditioning systems, self-contained or split-systems
- Prodcom 28251240 - Air conditioning machines of a kind used in motor vehicles
- Prodcom 28251250 - Air conditioning machines with refrigeration unit (excluding those used in motor vehicles, self-contained or split-systems machines)
- Prodcom 28251270 - Air conditioning machines not containing a refrigeration unit, c entral station air handling units, vav boxes and terminals, c onstant volume units and fan coil units
Country coverage:
- United States
Data coverage:
- Market volume and value
- Per Capita consumption
- Forecast of the market dynamics in the medium term
- Trade (exports and imports) in the U.S.
- Export and import prices
- Market trends, drivers and restraints
- Key market players and their profiles
Reasons to buy this report:
- Take advantage of the latest data
- Find deeper insights into current market developments
- Discover vital success factors affecting the market
This report is designed for manufacturers, distributors, importers, and wholesalers, as well as for investors, consultants and advisors.
In this report, you can find information that helps you to make informed decisions on the following issues:
- How to diversify your business and benefit from new market opportunities
- How to load your idle production capacity
- How to boost your sales on overseas markets
- How to increase your profit margins
- How to make your supply chain more sustainable
- How to reduce your production and supply chain costs
- How to outsource production to other countries
- How to prepare your business for global expansion
While doing this research, we combine the accumulated expertise of our analysts and the capabilities of artificial intelligence. The AI-based platform, developed by our data scientists, constitutes the key working tool for business analysts, empowering them to discover deep insights and ideas from the marketing data.
-
1. INTRODUCTION
Making Data-Driven Decisions to Grow Your Business
- REPORT DESCRIPTION
- RESEARCH METHODOLOGY AND AI PLATFORM
- DATA-DRIVEN DECISIONS FOR YOUR BUSINESS
- GLOSSARY AND SPECIFIC TERMS
-
2. EXECUTIVE SUMMARY
A Quick Overview of Market Performance
- KEY FINDINGS
- MARKET TRENDS This Chapter is Available Only for the Professional Edition PRO
-
3. MARKET OVERVIEW
Understanding the Current State of The Market and Its Prospects
- MARKET SIZE
- MARKET STRUCTURE
- TRADE BALANCE
- PER CAPITA CONSUMPTION
- MARKET FORECAST TO 2030
-
4. MOST PROMISING PRODUCT
Finding New Products to Diversify Your Business
This Chapter is Available Only for the Professional Edition PRO- TOP PRODUCTS TO DIVERSIFY YOUR BUSINESS
- BEST-SELLING PRODUCTS
- MOST CONSUMED PRODUCT
- MOST TRADED PRODUCT
- MOST PROFITABLE PRODUCT FOR EXPORT
-
5. MOST PROMISING SUPPLYING COUNTRIES
Choosing the Best Countries to Establish Your Sustainable Supply Chain
This Chapter is Available Only for the Professional Edition PRO- TOP COUNTRIES TO SOURCE YOUR PRODUCT
- TOP PRODUCING COUNTRIES
- TOP EXPORTING COUNTRIES
- LOW-COST EXPORTING COUNTRIES
-
6. MOST PROMISING OVERSEAS MARKETS
Choosing the Best Countries to Boost Your Exports
This Chapter is Available Only for the Professional Edition PRO- TOP OVERSEAS MARKETS FOR EXPORTING YOUR PRODUCT
- TOP CONSUMING MARKETS
- UNSATURATED MARKETS
- TOP IMPORTING MARKETS
- MOST PROFITABLE MARKETS
7. PRODUCTION
The Latest Trends and Insights into The Industry
- PRODUCTION VOLUME AND VALUE
8. IMPORTS
The Largest Import Supplying Countries
- IMPORTS FROM 2012–2023
- IMPORTS BY COUNTRY
- IMPORT PRICES BY COUNTRY
9. EXPORTS
The Largest Destinations for Exports
- EXPORTS FROM 2012–2023
- EXPORTS BY COUNTRY
- EXPORT PRICES BY COUNTRY
-
10. PROFILES OF MAJOR PRODUCERS
The Largest Producers on The Market and Their Profiles
This Chapter is Available Only for the Professional Edition PRO -
LIST OF TABLES
- Key Findings In 2023
- Market Volume, In Physical Terms, 2012–2023
- Market Value, 2012–2023
- Per Capita Consumption In 2012-2023
- Imports, In Physical Terms, By Country, 2012–2023
- Imports, In Value Terms, By Country, 2012–2023
- Import Prices, By Country Of Origin, 2012–2023
- Exports, In Physical Terms, By Country, 2012–2023
- Exports, In Value Terms, By Country, 2012–2023
- Export Prices, By Country Of Destination, 2012–2023
-
LIST OF FIGURES
- Market Volume, In Physical Terms, 2012–2023
- Market Value, 2012–2023
- Market Structure – Domestic Supply vs. Imports, In Physical Terms, 2012-2023
- Market Structure – Domestic Supply vs. Imports, In Value Terms, 2012-2023
- Trade Balance, In Physical Terms, 2012-2023
- Trade Balance, In Value Terms, 2012-2023
- Per Capita Consumption, 2012-2023
- Market Volume Forecast to 2030
- Market Value Forecast to 2030
- Products: Market Size And Growth, By Type
- Products: Average Per Capita Consumption, By Type
- Products: Exports And Growth, By Type
- Products: Export Prices And Growth, By Type
- Production Volume And Growth
- Exports And Growth
- Export Prices And Growth
- Market Size And Growth
- Per Capita Consumption
- Imports And Growth
- Import Prices
- Production, In Physical Terms, 2012–2023
- Production, In Value Terms, 2012–2023
- Imports, In Physical Terms, 2012–2023
- Imports, In Value Terms, 2012–2023
- Imports, In Physical Terms, By Country, 2023
- Imports, In Physical Terms, By Country, 2012–2023
- Imports, In Value Terms, By Country, 2012–2023
- Import Prices, By Country Of Origin, 2012–2023
- Exports, In Physical Terms, 2012–2023
- Exports, In Value Terms, 2012–2023
- Exports, In Physical Terms, By Country, 2023
- Exports, In Physical Terms, By Country, 2012–2023
- Exports, In Value Terms, By Country, 2012–2023
- Export Prices, By Country Of Destination, 2012–2023


