
Thailand - Air Conditioning Machines - Market Analysis, Forecast, Size, Trends and Insights
Get instant access to more than 2 million reports, dashboards, and datasets on the IndexBox Platform.
View PricingThailand's Air Conditioning Machine Drops in Price to $259, Available per Unit
Thailand Air Conditioning Machine Export Price in July 2023
In July 2023, the air conditioning machine price stood at $259 per unit (FOB, Thailand), falling by -3.2% against the previous month. Overall, the export price, however, showed a relatively flat trend pattern. The growth pace was the most rapid in June 2023 an increase of 10% against the previous month. Over the period under review, the average export prices hit record highs at $272 per unit in December 2022; however, from January 2023 to July 2023, the export prices stood at a somewhat lower figure.
There were significant differences in the average prices for the major foreign markets. In July 2023, the country with the highest price was the United States ($546 per unit), while the average price for exports to Vietnam ($79.6 per unit) was amongst the lowest.
From July 2022 to July 2023, the most notable rate of growth in terms of prices was recorded for supplies to Italy (+6.5%), while the prices for the other major destinations experienced more modest paces of growth.
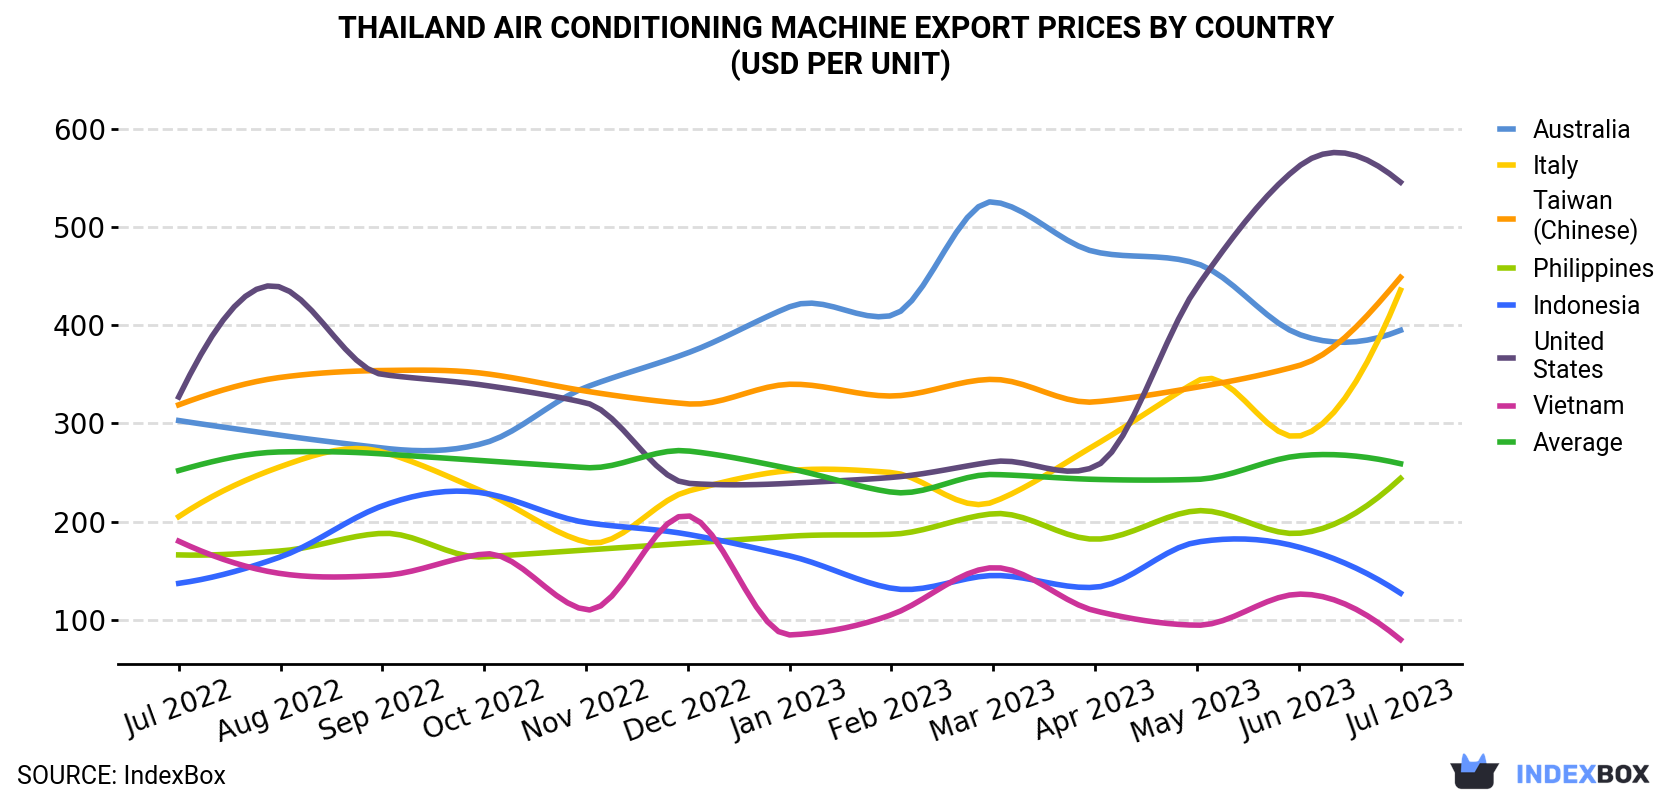
| COUNTRY | Export Price of Air Conditioning Machine in Thailand (USD per unit) | ||||||||||||
|---|---|---|---|---|---|---|---|---|---|---|---|---|---|
| Jul 2022 | Aug 2022 | Sep 2022 | Oct 2022 | Nov 2022 | Dec 2022 | Jan 2023 | Feb 2023 | Mar 2023 | Apr 2023 | May 2023 | Jun 2023 | Jul 2023 | |
| United States | 327 | 439 | 350 | 339 | 321 | 239 | 239 | 245 | 261 | 256 | 439 | 562 | 546 |
| Taiwan (Chinese) | 319 | 347 | 354 | 351 | 333 | 320 | 340 | 328 | 345 | 322 | 337 | 359 | 449 |
| Italy | 205 | 256 | 271 | 230 | 179 | 231 | 252 | 250 | 220 | 278 | 343 | 287 | 436 |
| Australia | 303 | 288 | 275 | 280 | 337 | 372 | 419 | 410 | 526 | 475 | 463 | 391 | 395 |
| Philippines | 166 | 170 | 188 | 164 | 171 | 178 | 185 | 187 | 208 | 182 | 211 | 188 | 244 |
| Indonesia | 137 | 164 | 216 | 229 | 199 | 187 | 165 | 132 | 145 | 133 | 179 | 174 | 127 |
| Vietnam | 180 | 147 | 145 | 167 | 110 | 206 | 84.4 | 105 | 153 | 109 | 94.3 | 126 | 79.6 |
| Average | 252 | 271 | 269 | 262 | 255 | 272 | 254 | 230 | 248 | 243 | 243 | 267 | 259 |
Thailand Air Conditioning Machine Export Prices by Type
Prices varied noticeably by the product type; the product with the highest price was air conditioning machines without refrigeration unit ($1,390 per unit), while the average price for exports of air conditioning machines for motor vehicles ($5.4 per unit) was amongst the lowest.
From July 2022 to July 2023, the most notable rate of growth in terms of prices was recorded for the following types: air conditioner (+3.2%), while the prices for the other products experienced more modest paces of growth.
Thailand Air Conditioning Machine Exports
Air conditioning machine exports from Thailand dropped rapidly to 1.3M units in July 2023, shrinking by -23.1% on June 2023 figures. In general, exports continue to indicate a pronounced contraction. The most prominent rate of growth was recorded in January 2023 when exports increased by 45% month-to-month. Over the period under review, the exports hit record highs at 3.1M units in March 2023; however, from April 2023 to July 2023, the exports failed to regain momentum.
In value terms, air conditioning machine exports shrank dramatically to $329M (IndexBox estimates) in July 2023. Over the period under review, exports continue to indicate a noticeable descent. The pace of growth appeared the most rapid in January 2023 when exports increased by 35% against the previous month. The exports peaked at 760M units in March 2023; however, from April 2023 to July 2023, the exports remained at a lower figure.
Thailand Air Conditioning Machine Exports by Type
Window or wall air conditioning systems, self-contained or split-systems (862K units) was the largest type of air conditioning machine exported from Thailand, accounting for a 68% share of total exports. Moreover, window or wall air conditioning systems, self-contained or split-systems exceeded the volume of the second product type, air conditioning machines for motor vehicles (231K units), fourfold. Air conditioning machines with refrigeration unit (178K units) ranked third in terms of total exports with a 14% share.
From July 2022 to July 2023, the average monthly rate of growth in terms of the volume of export of window or wall air conditioning systems, self-contained or split-systems stood at -4.5%. With regard to the other exported products, the following average monthly rates of growth were recorded: air conditioning machines for motor vehicles (+12.9% per month) and air conditioning machines with refrigeration unit (-4.4% per month).
In value terms, window or wall air conditioning systems, self-contained or split-systems ($246M) remains the largest type of air conditioning machine exported from Thailand, comprising 75% of total exports. The second position in the ranking was taken by air conditioning machines with refrigeration unit ($81M), with a 25% share of total exports. It was followed by air conditioning machines for motor vehicles, with a 0.4% share.
From July 2022 to July 2023, the average monthly rate of growth in terms of the export volume of window or wall air conditioning systems, self-contained or split-systems stood at -3.4%. With regard to the other exported products, the following average monthly rates of growth were recorded: air conditioning machines with refrigeration unit (-1.4% per month) and air conditioning machines for motor vehicles (+2.9% per month).
Thailand Air Conditioning Machine Exports by Country
Vietnam (336K units) was the main destination for air conditioning machine exports from Thailand, accounting for a 26% share of total exports. Moreover, air conditioning machine exports to Vietnam exceeded the volume sent to the second major destination, Australia (129K units), threefold. The third position in this ranking was held by the United States (100K units), with a 7.9% share.
From July 2022 to July 2023, the average monthly rate of growth in terms of volume to Vietnam totaled +8.8%. Exports to the other major destinations recorded the following average monthly rates of exports growth: Australia (-2.8% per month) and the United States (-5.2% per month).
In value terms, the United States ($55M), Australia ($51M) and Vietnam ($27M) appeared to be the largest markets for air conditioning machine exported from Thailand worldwide, together accounting for 40% of total exports.
Vietnam, with a CAGR of +1.7%, recorded the highest rates of growth with regard to the value of exports, among the main countries of destination over the period under review, while shipments for the other leaders experienced mixed trend patterns.
This report provides an in-depth analysis of the air conditioning machine market in Thailand. Within it, you will discover the latest data on market trends and opportunities by country, consumption, production and price developments, as well as the global trade (imports and exports). The forecast exhibits the market prospects through 2030.
Product coverage:
- Prodcom 28251220 - Window or wall air conditioning systems, self-contained or split-systems
- Prodcom 28251240 - Air conditioning machines of a kind used in motor vehicles
- Prodcom 28251250 - Air conditioning machines with refrigeration unit (excluding those used in motor vehicles, self-contained or split-systems machines)
- Prodcom 28251270 - Air conditioning machines not containing a refrigeration unit, c entral station air handling units, vav boxes and terminals, c onstant volume units and fan coil units
Country coverage:
- Thailand
Data coverage:
- Market volume and value
- Per Capita consumption
- Forecast of the market dynamics in the medium term
- Trade (exports and imports) in Thailand
- Export and import prices
- Market trends, drivers and restraints
- Key market players and their profiles
Reasons to buy this report:
- Take advantage of the latest data
- Find deeper insights into current market developments
- Discover vital success factors affecting the market
This report is designed for manufacturers, distributors, importers, and wholesalers, as well as for investors, consultants and advisors.
In this report, you can find information that helps you to make informed decisions on the following issues:
- How to diversify your business and benefit from new market opportunities
- How to load your idle production capacity
- How to boost your sales on overseas markets
- How to increase your profit margins
- How to make your supply chain more sustainable
- How to reduce your production and supply chain costs
- How to outsource production to other countries
- How to prepare your business for global expansion
While doing this research, we combine the accumulated expertise of our analysts and the capabilities of artificial intelligence. The AI-based platform, developed by our data scientists, constitutes the key working tool for business analysts, empowering them to discover deep insights and ideas from the marketing data.
-
1. INTRODUCTION
Making Data-Driven Decisions to Grow Your Business
- REPORT DESCRIPTION
- RESEARCH METHODOLOGY AND AI PLATFORM
- DATA-DRIVEN DECISIONS FOR YOUR BUSINESS
- GLOSSARY AND SPECIFIC TERMS
-
2. EXECUTIVE SUMMARY
A Quick Overview of Market Performance
- KEY FINDINGS
- MARKET TRENDS This Chapter is Available Only for the Professional Edition PRO
-
3. MARKET OVERVIEW
Understanding the Current State of The Market and Its Prospects
- MARKET SIZE
- MARKET STRUCTURE
- TRADE BALANCE
- PER CAPITA CONSUMPTION
- MARKET FORECAST TO 2030
-
4. MOST PROMISING PRODUCT
Finding New Products to Diversify Your Business
This Chapter is Available Only for the Professional Edition PRO- TOP PRODUCTS TO DIVERSIFY YOUR BUSINESS
- BEST-SELLING PRODUCTS
- MOST CONSUMED PRODUCT
- MOST TRADED PRODUCT
- MOST PROFITABLE PRODUCT FOR EXPORT
-
5. MOST PROMISING SUPPLYING COUNTRIES
Choosing the Best Countries to Establish Your Sustainable Supply Chain
This Chapter is Available Only for the Professional Edition PRO- TOP COUNTRIES TO SOURCE YOUR PRODUCT
- TOP PRODUCING COUNTRIES
- TOP EXPORTING COUNTRIES
- LOW-COST EXPORTING COUNTRIES
-
6. MOST PROMISING OVERSEAS MARKETS
Choosing the Best Countries to Boost Your Exports
This Chapter is Available Only for the Professional Edition PRO- TOP OVERSEAS MARKETS FOR EXPORTING YOUR PRODUCT
- TOP CONSUMING MARKETS
- UNSATURATED MARKETS
- TOP IMPORTING MARKETS
- MOST PROFITABLE MARKETS
7. PRODUCTION
The Latest Trends and Insights into The Industry
- PRODUCTION VOLUME AND VALUE
8. IMPORTS
The Largest Import Supplying Countries
- IMPORTS FROM 2012–2023
- IMPORTS BY COUNTRY
- IMPORT PRICES BY COUNTRY
9. EXPORTS
The Largest Destinations for Exports
- EXPORTS FROM 2012–2023
- EXPORTS BY COUNTRY
- EXPORT PRICES BY COUNTRY
-
10. PROFILES OF MAJOR PRODUCERS
The Largest Producers on The Market and Their Profiles
This Chapter is Available Only for the Professional Edition PRO -
LIST OF TABLES
- Key Findings In 2023
- Market Volume, In Physical Terms, 2012–2023
- Market Value, 2012–2023
- Per Capita Consumption In 2012-2023
- Imports, In Physical Terms, By Country, 2012–2023
- Imports, In Value Terms, By Country, 2012–2023
- Import Prices, By Country Of Origin, 2012–2023
- Exports, In Physical Terms, By Country, 2012–2023
- Exports, In Value Terms, By Country, 2012–2023
- Export Prices, By Country Of Destination, 2012–2023
-
LIST OF FIGURES
- Market Volume, In Physical Terms, 2012–2023
- Market Value, 2012–2023
- Market Structure – Domestic Supply vs. Imports, In Physical Terms, 2012-2023
- Market Structure – Domestic Supply vs. Imports, In Value Terms, 2012-2023
- Trade Balance, In Physical Terms, 2012-2023
- Trade Balance, In Value Terms, 2012-2023
- Per Capita Consumption, 2012-2023
- Market Volume Forecast to 2030
- Market Value Forecast to 2030
- Products: Market Size And Growth, By Type
- Products: Average Per Capita Consumption, By Type
- Products: Exports And Growth, By Type
- Products: Export Prices And Growth, By Type
- Production Volume And Growth
- Exports And Growth
- Export Prices And Growth
- Market Size And Growth
- Per Capita Consumption
- Imports And Growth
- Import Prices
- Production, In Physical Terms, 2012–2023
- Production, In Value Terms, 2012–2023
- Imports, In Physical Terms, 2012–2023
- Imports, In Value Terms, 2012–2023
- Imports, In Physical Terms, By Country, 2023
- Imports, In Physical Terms, By Country, 2012–2023
- Imports, In Value Terms, By Country, 2012–2023
- Import Prices, By Country Of Origin, 2012–2023
- Exports, In Physical Terms, 2012–2023
- Exports, In Value Terms, 2012–2023
- Exports, In Physical Terms, By Country, 2023
- Exports, In Physical Terms, By Country, 2012–2023
- Exports, In Value Terms, By Country, 2012–2023
- Export Prices, By Country Of Destination, 2012–2023


