
United Kingdom - Household Washing and Drying Machines - Market Analysis, Forecast, Size, Trends and Insights
Get instant access to more than 2 million reports, dashboards, and datasets on the IndexBox Platform.
View PricingImport of Washing and Drying Machines to UK Surges by 3% to $77M in August 2023
United Kingdom Washing and Drying Machine Imports
Washing and drying machine imports into the UK amounted to 307K units in August 2023, picking up by 2% against the previous month's figure. In general, total imports indicated mild growth from August 2022 to August 2023: its volume increased at an average monthly rate of +1.5% over the last twelve months. The trend pattern, however, indicated some noticeable fluctuations being recorded throughout the analyzed period. Based on August 2023 figures, imports decreased by -3.9% against May 2023 indices. The pace of growth was the most pronounced in October 2022 with an increase of 42% against the previous month. Over the period under review, imports attained the peak figure at 405K units in November 2022; however, from December 2022 to August 2023, imports remained at a lower figure.
In value terms, washing and drying machine imports rose to $77M (IndexBox estimates) in August 2023. Over the period under review, total imports indicated slight growth from August 2022 to August 2023: its value increased at an average monthly rate of +1.4% over the last twelve months. The trend pattern, however, indicated some noticeable fluctuations being recorded throughout the analyzed period. Based on August 2023 figures, imports increased by +20.0% against April 2023 indices. The pace of growth was the most pronounced in October 2022 when imports increased by 42% against the previous month. Imports peaked at 99M units in November 2022; however, from December 2022 to August 2023, imports remained at a lower figure.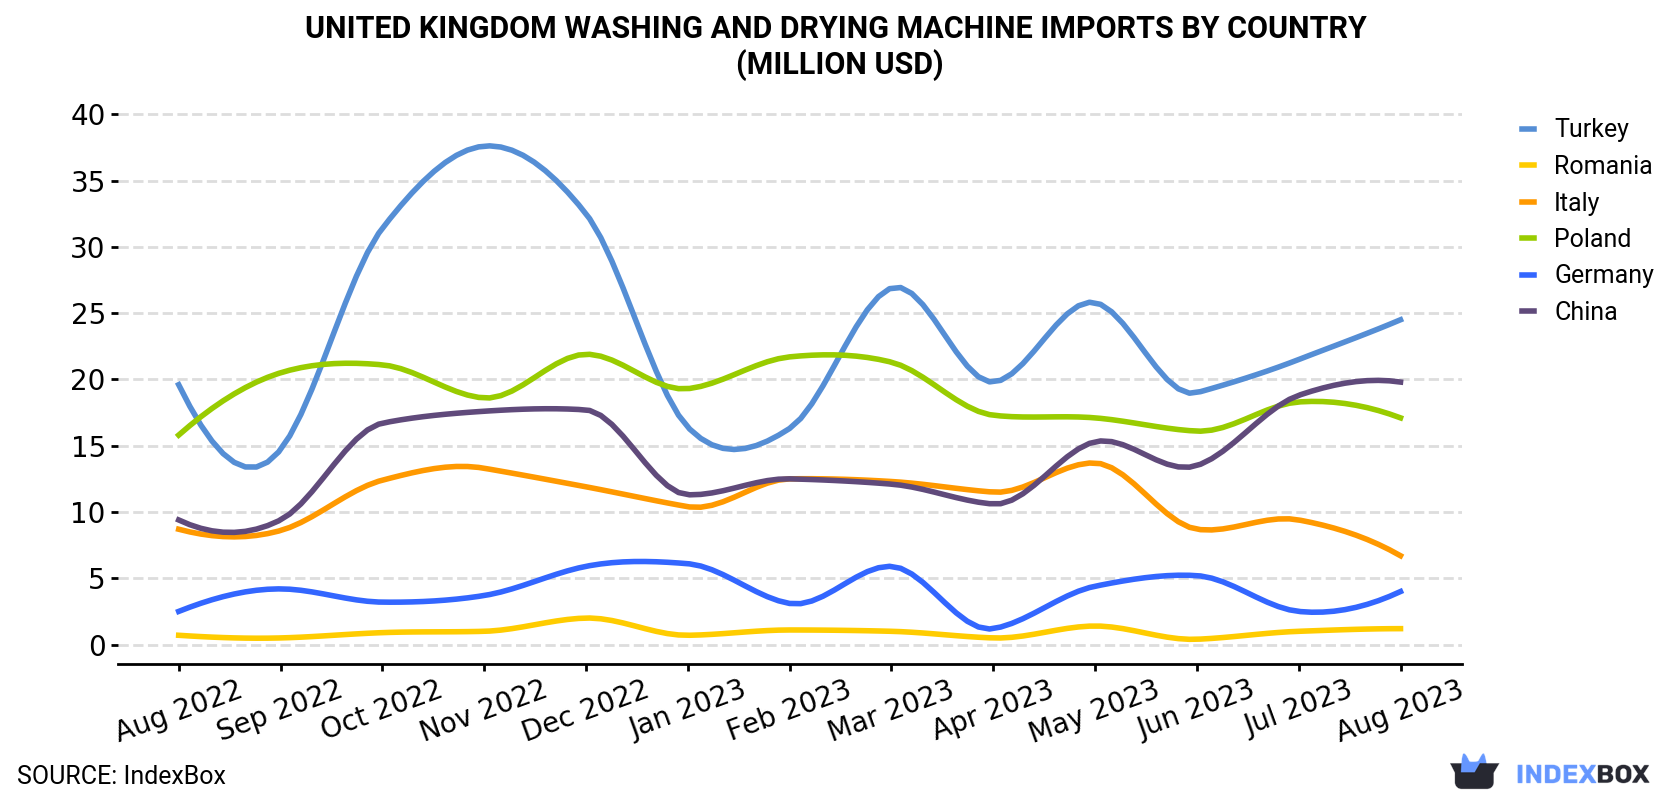
| COUNTRY | Import Value of Washing and Drying Machine in United Kingdom (million USD) | ||||||||||||
|---|---|---|---|---|---|---|---|---|---|---|---|---|---|
| Aug 2022 | Sep 2022 | Oct 2022 | Nov 2022 | Dec 2022 | Jan 2023 | Feb 2023 | Mar 2023 | Apr 2023 | May 2023 | Jun 2023 | Jul 2023 | Aug 2023 | |
| Turkey | 19.6 | 14.7 | 31.4 | 37.6 | 32.5 | 16.4 | 16.3 | 26.9 | 19.8 | 25.8 | 19.0 | 21.5 | 24.5 |
| China | 9.4 | 9.4 | 16.7 | 17.6 | 17.7 | 11.3 | 12.5 | 12.1 | 10.6 | 15.3 | 13.5 | 18.8 | 19.8 |
| Poland | 15.8 | 20.5 | 21.1 | 18.6 | 21.9 | 19.3 | 21.7 | 21.3 | 17.3 | 17.1 | 16.1 | 18.3 | 17.1 |
| Italy | 8.7 | 8.6 | 12.4 | 13.3 | 11.9 | 10.4 | 12.5 | 12.3 | 11.5 | 13.7 | 8.7 | 9.4 | 6.7 |
| Germany | 2.5 | 4.2 | 3.2 | 3.7 | 5.9 | 6.1 | 3.1 | 5.9 | 1.2 | 4.4 | 5.2 | 2.5 | 4.0 |
| Romania | 0.7 | 0.5 | 0.9 | 1.0 | 2.0 | 0.7 | 1.1 | 1.0 | 0.5 | 1.4 | 0.4 | 1.0 | 1.2 |
| Others | 8.7 | 6.4 | 5.6 | 6.9 | 4.0 | 3.5 | 3.9 | 4.1 | 3.3 | 5.2 | 5.2 | 3.2 | 3.8 |
| Total | 65.3 | 64.4 | 91.2 | 98.7 | 95.9 | 67.8 | 71.2 | 83.5 | 64.3 | 82.9 | 68.1 | 74.8 | 77.1 |
Imports by Country
Turkey (106K units), China (101K units) and Poland (58K units) were the main suppliers of washing and drying machine imports to the UK, together accounting for 86% of total imports.
From August 2022 to August 2023, the biggest increases were in China (with a CAGR of +9.0%), while purchases for the other leaders experienced more modest paces of growth.
In value terms, the largest washing and drying machine suppliers to the UK were Turkey ($24M), China ($20M) and Poland ($17M), with a combined 79% share of total imports.
In terms of the main suppliers, China, with a CAGR of +6.4%, recorded the highest rates of growth with regard to the value of imports, over the period under review, while purchases for the other leaders experienced more modest paces of growth.
Imports by Type
In August 2023, washing machines; household or laundry-type, fully-automatic, (of a dry linen capacity not exceeding 10kg) (258K units) constituted the largest type of washing and drying machine supplied to the UK, accounting for a 84% share of total imports. Moreover, washing machines; household or laundry-type, fully-automatic, (of a dry linen capacity not exceeding 10kg) exceeded the figures recorded for the second-largest type, drying machines; of a dry linen capacity not exceeding 10kg (31K units), eightfold. The third position in this ranking was taken by washing machines; household or laundry-type, with built-in centrifugal drier, (not fully-automatic), of a dry linen capacity not exceeding 10kg (13K units), with a 4.1% share.
From August 2022 to August 2023, the average monthly growth rate of the volume of import of washing machines; household or laundry-type, fully-automatic, (of a dry linen capacity not exceeding 10kg) amounted to +1.2%. With regard to the other supplied products, the following average monthly rates of growth were recorded: drying machines; of a dry linen capacity not exceeding 10kg (+1.4% per month) and washing machines; household or laundry-type, with built-in centrifugal drier, (not fully-automatic), of a dry linen capacity not exceeding 10kg (+9.4% per month).
In value terms, washing machines; household or laundry-type, fully-automatic, (of a dry linen capacity not exceeding 10kg) ($61M) constituted the largest type of washing and drying machine supplied to the UK, comprising 79% of total imports. The second position in the ranking was taken by drying machines; of a dry linen capacity not exceeding 10kg ($14M), with an 18% share of total imports. It was followed by washing machines; household or laundry-type, with built-in centrifugal drier, (not fully-automatic), of a dry linen capacity not exceeding 10kg, with a 2.1% share.
Import Prices by Country
In August 2023, the washing and drying machine price amounted to $251 per unit (CIF, United Kingdom), almost unchanged from the previous month. Over the period under review, the import price, however, showed a relatively flat trend pattern. The growth pace was the most rapid in March 2023 when the average import price increased by 17% month-to-month. Over the period under review, average import prices attained the maximum at $263 per unit in June 2023; however, from July 2023 to August 2023, import prices failed to regain momentum.
There were significant differences in the average prices amongst the major supplying countries. In August 2023, the country with the highest price was Germany ($675 per unit), while the price for China ($195 per unit) was amongst the lowest.
From August 2022 to August 2023, the most notable rate of growth in terms of prices was attained by Germany (+7.5%), while the prices for the other major suppliers experienced more modest paces of growth.
This report provides an in-depth analysis of the market for washing and drying machine in the UK. Within it, you will discover the latest data on market trends and opportunities by country, consumption, production and price developments, as well as the global trade (imports and exports). The forecast exhibits the market prospects through 2030.
Product coverage:
- Prodcom 27511300 - Cloth washing and drying machines, of the household type
Country coverage:
- United Kingdom
Data coverage:
- Market volume and value
- Per Capita consumption
- Forecast of the market dynamics in the medium term
- Trade (exports and imports) in the UK
- Export and import prices
- Market trends, drivers and restraints
- Key market players and their profiles
Reasons to buy this report:
- Take advantage of the latest data
- Find deeper insights into current market developments
- Discover vital success factors affecting the market
This report is designed for manufacturers, distributors, importers, and wholesalers, as well as for investors, consultants and advisors.
In this report, you can find information that helps you to make informed decisions on the following issues:
- How to diversify your business and benefit from new market opportunities
- How to load your idle production capacity
- How to boost your sales on overseas markets
- How to increase your profit margins
- How to make your supply chain more sustainable
- How to reduce your production and supply chain costs
- How to outsource production to other countries
- How to prepare your business for global expansion
While doing this research, we combine the accumulated expertise of our analysts and the capabilities of artificial intelligence. The AI-based platform, developed by our data scientists, constitutes the key working tool for business analysts, empowering them to discover deep insights and ideas from the marketing data.
-
1. INTRODUCTION
Making Data-Driven Decisions to Grow Your Business
- REPORT DESCRIPTION
- RESEARCH METHODOLOGY AND AI PLATFORM
- DATA-DRIVEN DECISIONS FOR YOUR BUSINESS
- GLOSSARY AND SPECIFIC TERMS
-
2. EXECUTIVE SUMMARY
A Quick Overview of Market Performance
- KEY FINDINGS
- MARKET TRENDS This Chapter is Available Only for the Professional Edition PRO
-
3. MARKET OVERVIEW
Understanding the Current State of The Market and Its Prospects
- MARKET SIZE
- MARKET STRUCTURE
- TRADE BALANCE
- PER CAPITA CONSUMPTION
- MARKET FORECAST TO 2030
-
4. MOST PROMISING PRODUCT
Finding New Products to Diversify Your Business
This Chapter is Available Only for the Professional Edition PRO- TOP PRODUCTS TO DIVERSIFY YOUR BUSINESS
- BEST-SELLING PRODUCTS
- MOST CONSUMED PRODUCT
- MOST TRADED PRODUCT
- MOST PROFITABLE PRODUCT FOR EXPORT
-
5. MOST PROMISING SUPPLYING COUNTRIES
Choosing the Best Countries to Establish Your Sustainable Supply Chain
This Chapter is Available Only for the Professional Edition PRO- TOP COUNTRIES TO SOURCE YOUR PRODUCT
- TOP PRODUCING COUNTRIES
- TOP EXPORTING COUNTRIES
- LOW-COST EXPORTING COUNTRIES
-
6. MOST PROMISING OVERSEAS MARKETS
Choosing the Best Countries to Boost Your Exports
This Chapter is Available Only for the Professional Edition PRO- TOP OVERSEAS MARKETS FOR EXPORTING YOUR PRODUCT
- TOP CONSUMING MARKETS
- UNSATURATED MARKETS
- TOP IMPORTING MARKETS
- MOST PROFITABLE MARKETS
7. PRODUCTION
The Latest Trends and Insights into The Industry
- PRODUCTION VOLUME AND VALUE
8. IMPORTS
The Largest Import Supplying Countries
- IMPORTS FROM 2012–2023
- IMPORTS BY COUNTRY
- IMPORT PRICES BY COUNTRY
9. EXPORTS
The Largest Destinations for Exports
- EXPORTS FROM 2012–2023
- EXPORTS BY COUNTRY
- EXPORT PRICES BY COUNTRY
-
10. PROFILES OF MAJOR PRODUCERS
The Largest Producers on The Market and Their Profiles
This Chapter is Available Only for the Professional Edition PRO -
LIST OF TABLES
- Key Findings In 2023
- Market Volume, In Physical Terms, 2012–2023
- Market Value, 2012–2023
- Per Capita Consumption In 2012-2023
- Imports, In Physical Terms, By Country, 2012–2023
- Imports, In Value Terms, By Country, 2012–2023
- Import Prices, By Country Of Origin, 2012–2023
- Exports, In Physical Terms, By Country, 2012–2023
- Exports, In Value Terms, By Country, 2012–2023
- Export Prices, By Country Of Destination, 2012–2023
-
LIST OF FIGURES
- Market Volume, In Physical Terms, 2012–2023
- Market Value, 2012–2023
- Market Structure – Domestic Supply vs. Imports, In Physical Terms, 2012-2023
- Market Structure – Domestic Supply vs. Imports, In Value Terms, 2012-2023
- Trade Balance, In Physical Terms, 2012-2023
- Trade Balance, In Value Terms, 2012-2023
- Per Capita Consumption, 2012-2023
- Market Volume Forecast to 2030
- Market Value Forecast to 2030
- Products: Market Size And Growth, By Type
- Products: Average Per Capita Consumption, By Type
- Products: Exports And Growth, By Type
- Products: Export Prices And Growth, By Type
- Production Volume And Growth
- Exports And Growth
- Export Prices And Growth
- Market Size And Growth
- Per Capita Consumption
- Imports And Growth
- Import Prices
- Production, In Physical Terms, 2012–2023
- Production, In Value Terms, 2012–2023
- Imports, In Physical Terms, 2012–2023
- Imports, In Value Terms, 2012–2023
- Imports, In Physical Terms, By Country, 2023
- Imports, In Physical Terms, By Country, 2012–2023
- Imports, In Value Terms, By Country, 2012–2023
- Import Prices, By Country Of Origin, 2012–2023
- Exports, In Physical Terms, 2012–2023
- Exports, In Value Terms, 2012–2023
- Exports, In Physical Terms, By Country, 2023
- Exports, In Physical Terms, By Country, 2012–2023
- Exports, In Value Terms, By Country, 2012–2023
- Export Prices, By Country Of Destination, 2012–2023


