
United Kingdom - Derricks, Cranes, Mobile Lifting Frames, Straddle Carriers And Work Trucks Fitted With A Crane - Market Analysis, Forecast, Size, Trends and Insights
Get instant access to more than 2 million reports, dashboards, and datasets on the IndexBox Platform.
View PricingImport of Cranes Soars by 56% to $54M in June 2023 in UK
United Kingdom Crane Imports
In June 2023, the amount of derricks, cranes, mobile lifting frames, straddle carriers and work trucks fitted with a crane imported into the UK expanded modestly to 208 units, with an increase of 4% on the previous month. Overall, imports, however, recorded a slight slump. The most prominent rate of growth was recorded in November 2022 with an increase of 128% against the previous month. As a result, imports attained the peak of 397 units. From December 2022 to June 2023, the growth of imports remained at a lower figure.
In value terms, crane imports skyrocketed to $54M (IndexBox estimates) in June 2023. Over the period under review, imports continue to indicate a measured increase. The most prominent rate of growth was recorded in November 2022 when imports increased by 110% month-to-month. As a result, imports attained the peak of $81M. From December 2022 to June 2023, the growth of imports remained at a somewhat lower figure.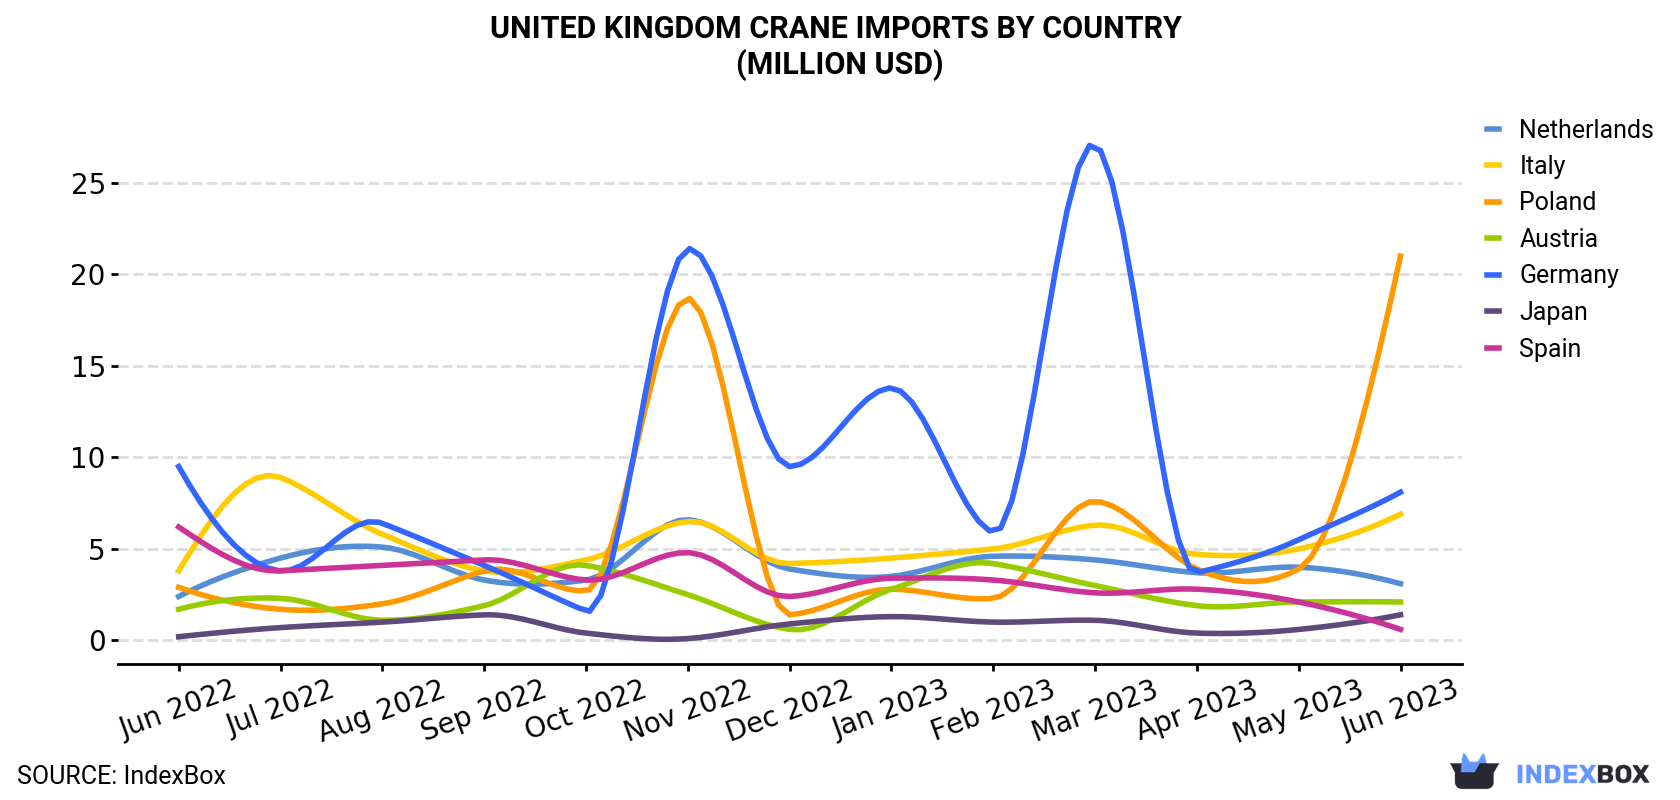
| COUNTRY | Import Value of Crane in United Kingdom (million USD) | ||||||||||||
|---|---|---|---|---|---|---|---|---|---|---|---|---|---|
| Jun 2022 | Jul 2022 | Aug 2022 | Sep 2022 | Oct 2022 | Nov 2022 | Dec 2022 | Jan 2023 | Feb 2023 | Mar 2023 | Apr 2023 | May 2023 | Jun 2023 | |
| Poland | 2.9 | 1.7 | 2.0 | 3.8 | 2.7 | 18.7 | 1.4 | 2.8 | 2.3 | 7.6 | 3.9 | 3.9 | 21.0 |
| Germany | 9.5 | 3.8 | 6.4 | 4.1 | 1.6 | 21.4 | 9.5 | 13.8 | 5.9 | 27.1 | 3.7 | 5.5 | 8.1 |
| Italy | 3.8 | 8.9 | 5.8 | 3.8 | 4.4 | 6.5 | 4.2 | 4.5 | 5.0 | 6.3 | 4.7 | 5.0 | 6.9 |
| Netherlands | 2.4 | 4.5 | 5.1 | 3.3 | 3.3 | 6.6 | 3.9 | 3.5 | 4.6 | 4.4 | 3.7 | 4.0 | 3.1 |
| Austria | 1.7 | 2.3 | 1.1 | 1.9 | 4.1 | 2.5 | 0.6 | 2.8 | 4.2 | 3.0 | 1.9 | 2.1 | 2.1 |
| Japan | 0.2 | 0.7 | 1.0 | 1.4 | 0.4 | 0.1 | 0.9 | 1.3 | 1.0 | 1.1 | 0.4 | 0.6 | 1.4 |
| Spain | 6.2 | 3.8 | 4.1 | 4.4 | 3.3 | 4.8 | 2.4 | 3.4 | 3.3 | 2.6 | 2.8 | 2.1 | 0.6 |
| Others | 12.2 | 11.2 | 15.4 | 18.8 | 18.6 | 20.0 | 10.5 | 6.4 | 9.4 | 11.7 | 20.2 | 11.6 | 11.3 |
| Total | 38.9 | 36.9 | 41.0 | 41.6 | 38.5 | 80.7 | 33.4 | 38.6 | 35.6 | 63.9 | 41.4 | 34.8 | 54.4 |
Imports by Country
Poland (61 units), Germany (40 units) and Italy (25 units) were the main suppliers of crane imports to the UK, together comprising 61% of total imports. Spain, Austria, the Netherlands and Japan lagged somewhat behind, together comprising a further 13%.
From June 2022 to June 2023, the biggest increases were in Japan (with a CAGR of +14.4%), while purchases for the other leaders experienced more modest paces of growth.
In value terms, Poland ($21M) constituted the largest supplier of crane to the UK, comprising 39% of total imports. The second position in the ranking was taken by Germany ($8.1M), with a 15% share of total imports. It was followed by Italy, with a 13% share.
From June 2022 to June 2023, the average monthly rate of growth in terms of value from Poland totaled +18.0%. The remaining supplying countries recorded the following average monthly rates of imports growth: Germany (-1.4% per month) and Italy (+5.1% per month).
Import Prices by Country
In June 2023, the crane price amounted to $262K per unit (CIF, United Kingdom), growing by 50% against the previous month. Overall, import price indicated a noticeable expansion from June 2022 to June 2023: its price increased at an average monthly rate of +4.4% over the last twelve-month period. The trend pattern, however, indicated some noticeable fluctuations being recorded throughout the analyzed period. Based on June 2023 figures, crane import price decreased by -4.5% against April 2023 indices. The pace of growth appeared the most rapid in April 2023 when the average import price increased by 59% against the previous month. As a result, import price reached the peak level of $274M per thousand units; afterwards, it flattened through to June 2023.
There were significant differences in the average prices amongst the major supplying countries. In June 2023, the country with the highest price was the Netherlands ($507K per unit), while the price for Spain ($58,918 per unit) was amongst the lowest.
From June 2022 to June 2023, the most notable rate of growth in terms of prices was attained by France (+6.0%), while the prices for the other major suppliers experienced more modest paces of growth.
This report provides an in-depth analysis of the crane market in the UK. Within it, you will discover the latest data on market trends and opportunities by country, consumption, production and price developments, as well as the global trade (imports and exports). The forecast exhibits the market prospects through 2030.
Product coverage:
- Prodcom 28221420 - Overhead travelling cranes on fixed support
- Prodcom 28221433 - Mobile lifting frames on tyres and straddle carriers
- Prodcom 28221435 - Transporter cranes, gantry cranes and bridge cranes
- Prodcom 28221440 - Tower cranes and portal or pedestal jib cranes
- Prodcom 28221450 - Self-propelled lifting equipment, of a kind mounted to run on rails in servicing building sites, quarries and the like
- Prodcom 28221460 - Lifting equipment designed for mounting on road vehicles
- Prodcom 28221470 - Lifting equipment (excluding overhead travelling cranes, t ower, transporter, gantry, portal, bridge or pedestal jib cranes, mobile lifting frames or straddle carriers, selfpropelled machinery)
Country coverage:
- United Kingdom
Data coverage:
- Market volume and value
- Per Capita consumption
- Forecast of the market dynamics in the medium term
- Trade (exports and imports) in the UK
- Export and import prices
- Market trends, drivers and restraints
- Key market players and their profiles
Reasons to buy this report:
- Take advantage of the latest data
- Find deeper insights into current market developments
- Discover vital success factors affecting the market
This report is designed for manufacturers, distributors, importers, and wholesalers, as well as for investors, consultants and advisors.
In this report, you can find information that helps you to make informed decisions on the following issues:
- How to diversify your business and benefit from new market opportunities
- How to load your idle production capacity
- How to boost your sales on overseas markets
- How to increase your profit margins
- How to make your supply chain more sustainable
- How to reduce your production and supply chain costs
- How to outsource production to other countries
- How to prepare your business for global expansion
While doing this research, we combine the accumulated expertise of our analysts and the capabilities of artificial intelligence. The AI-based platform, developed by our data scientists, constitutes the key working tool for business analysts, empowering them to discover deep insights and ideas from the marketing data.
-
1. INTRODUCTION
Making Data-Driven Decisions to Grow Your Business
- REPORT DESCRIPTION
- RESEARCH METHODOLOGY AND AI PLATFORM
- DATA-DRIVEN DECISIONS FOR YOUR BUSINESS
- GLOSSARY AND SPECIFIC TERMS
-
2. EXECUTIVE SUMMARY
A Quick Overview of Market Performance
- KEY FINDINGS
- MARKET TRENDS This Chapter is Available Only for the Professional Edition PRO
-
3. MARKET OVERVIEW
Understanding the Current State of The Market and Its Prospects
- MARKET SIZE
- MARKET STRUCTURE
- TRADE BALANCE
- PER CAPITA CONSUMPTION
- MARKET FORECAST TO 2030
-
4. MOST PROMISING PRODUCT
Finding New Products to Diversify Your Business
This Chapter is Available Only for the Professional Edition PRO- TOP PRODUCTS TO DIVERSIFY YOUR BUSINESS
- BEST-SELLING PRODUCTS
- MOST CONSUMED PRODUCT
- MOST TRADED PRODUCT
- MOST PROFITABLE PRODUCT FOR EXPORT
-
5. MOST PROMISING SUPPLYING COUNTRIES
Choosing the Best Countries to Establish Your Sustainable Supply Chain
This Chapter is Available Only for the Professional Edition PRO- TOP COUNTRIES TO SOURCE YOUR PRODUCT
- TOP PRODUCING COUNTRIES
- TOP EXPORTING COUNTRIES
- LOW-COST EXPORTING COUNTRIES
-
6. MOST PROMISING OVERSEAS MARKETS
Choosing the Best Countries to Boost Your Exports
This Chapter is Available Only for the Professional Edition PRO- TOP OVERSEAS MARKETS FOR EXPORTING YOUR PRODUCT
- TOP CONSUMING MARKETS
- UNSATURATED MARKETS
- TOP IMPORTING MARKETS
- MOST PROFITABLE MARKETS
7. PRODUCTION
The Latest Trends and Insights into The Industry
- PRODUCTION VOLUME AND VALUE
8. IMPORTS
The Largest Import Supplying Countries
- IMPORTS FROM 2012–2023
- IMPORTS BY COUNTRY
- IMPORT PRICES BY COUNTRY
9. EXPORTS
The Largest Destinations for Exports
- EXPORTS FROM 2012–2023
- EXPORTS BY COUNTRY
- EXPORT PRICES BY COUNTRY
-
10. PROFILES OF MAJOR PRODUCERS
The Largest Producers on The Market and Their Profiles
This Chapter is Available Only for the Professional Edition PRO -
LIST OF TABLES
- Key Findings In 2023
- Market Volume, In Physical Terms, 2012–2023
- Market Value, 2012–2023
- Per Capita Consumption In 2012-2023
- Imports, In Physical Terms, By Country, 2012–2023
- Imports, In Value Terms, By Country, 2012–2023
- Import Prices, By Country Of Origin, 2012–2023
- Exports, In Physical Terms, By Country, 2012–2023
- Exports, In Value Terms, By Country, 2012–2023
- Export Prices, By Country Of Destination, 2012–2023
-
LIST OF FIGURES
- Market Volume, In Physical Terms, 2012–2023
- Market Value, 2012–2023
- Market Structure – Domestic Supply vs. Imports, In Physical Terms, 2012-2023
- Market Structure – Domestic Supply vs. Imports, In Value Terms, 2012-2023
- Trade Balance, In Physical Terms, 2012-2023
- Trade Balance, In Value Terms, 2012-2023
- Per Capita Consumption, 2012-2023
- Market Volume Forecast to 2030
- Market Value Forecast to 2030
- Products: Market Size And Growth, By Type
- Products: Average Per Capita Consumption, By Type
- Products: Exports And Growth, By Type
- Products: Export Prices And Growth, By Type
- Production Volume And Growth
- Exports And Growth
- Export Prices And Growth
- Market Size And Growth
- Per Capita Consumption
- Imports And Growth
- Import Prices
- Production, In Physical Terms, 2012–2023
- Production, In Value Terms, 2012–2023
- Imports, In Physical Terms, 2012–2023
- Imports, In Value Terms, 2012–2023
- Imports, In Physical Terms, By Country, 2023
- Imports, In Physical Terms, By Country, 2012–2023
- Imports, In Value Terms, By Country, 2012–2023
- Import Prices, By Country Of Origin, 2012–2023
- Exports, In Physical Terms, 2012–2023
- Exports, In Value Terms, 2012–2023
- Exports, In Physical Terms, By Country, 2023
- Exports, In Physical Terms, By Country, 2012–2023
- Exports, In Value Terms, By Country, 2012–2023
- Export Prices, By Country Of Destination, 2012–2023


