
Turkey - Copper Tubes, Pipes And Fittings - Market Analysis, Forecast, Size, Trends And Insights
Get instant access to more than 2 million reports, dashboards, and datasets on the IndexBox Platform.
View PricingTurkey's Copper Pipe and Fitting Export Plummets to $25M in July 2023
Turkey Copper Pipe And Fitting Exports
In July 2023, overseas shipments of copper tubes, pipes and fitting decreased by -13.3% to 2K tons for the first time since April 2023, thus ending a two-month rising trend. Over the period under review, exports saw a relatively flat trend pattern. The most prominent rate of growth was recorded in March 2023 with an increase of 17% month-to-month.
In value terms, copper pipe and fitting exports declined to $25M (IndexBox estimates) in July 2023. In general, exports, however, recorded a relatively flat trend pattern. The most prominent rate of growth was recorded in March 2023 when exports increased by 16% month-to-month. As a result, the exports attained the peak of $30M. From April 2023 to July 2023, the growth of the exports remained at a somewhat lower figure.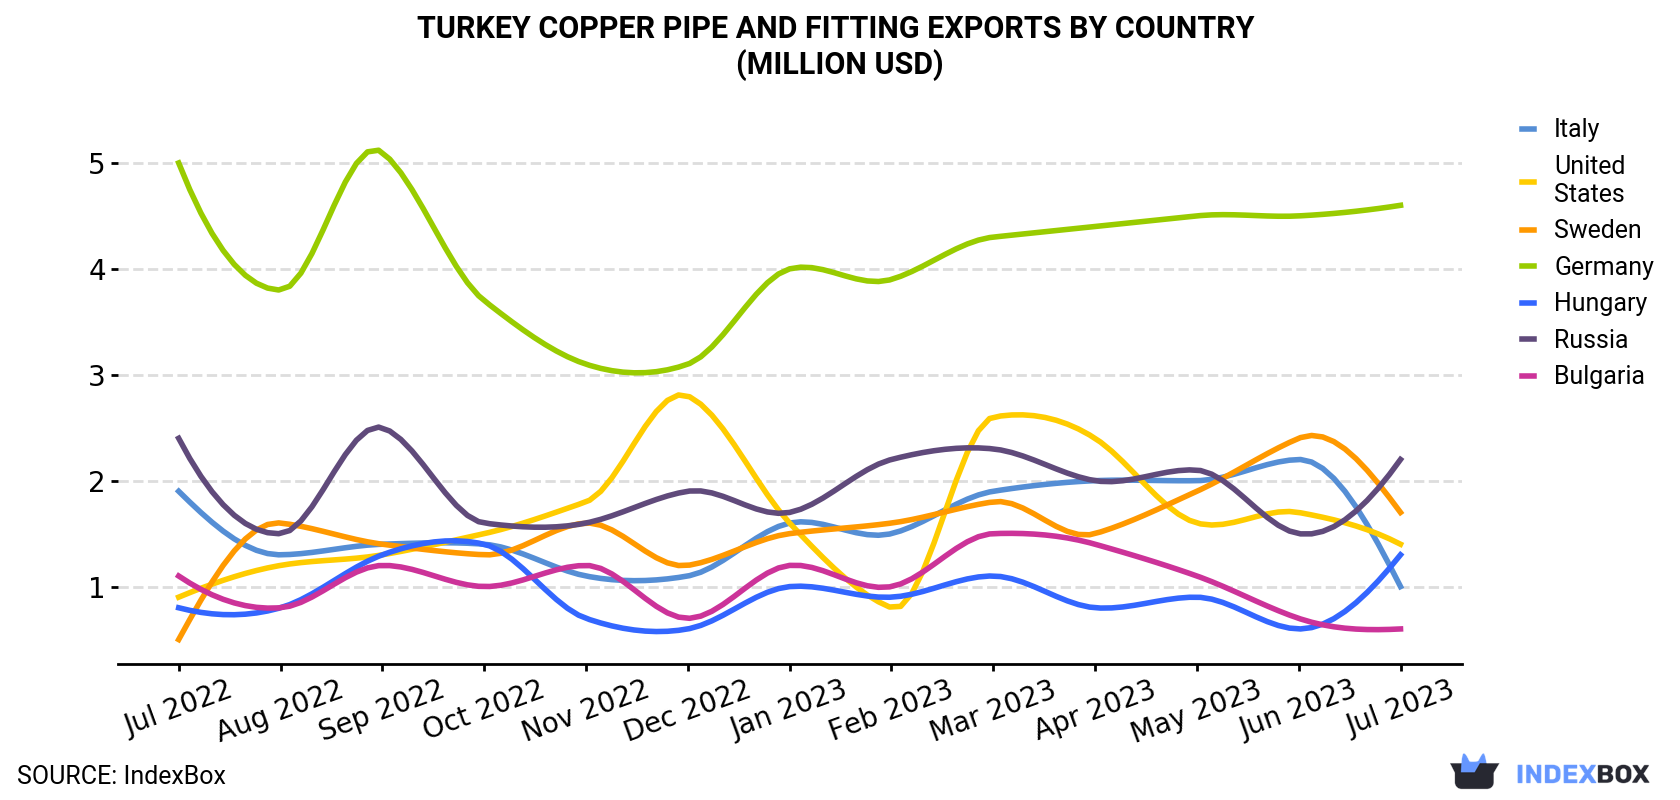
| COUNTRY | Export Value of Copper Pipe And Fitting in Turkey (million USD) | ||||||||||||
|---|---|---|---|---|---|---|---|---|---|---|---|---|---|
| Jul 2022 | Aug 2022 | Sep 2022 | Oct 2022 | Nov 2022 | Dec 2022 | Jan 2023 | Feb 2023 | Mar 2023 | Apr 2023 | May 2023 | Jun 2023 | Jul 2023 | |
| Germany | 5.0 | 3.8 | 5.1 | 3.7 | 3.1 | 3.1 | 4.0 | 3.9 | 4.3 | 4.4 | 4.5 | 4.5 | 4.6 |
| Russia | 2.4 | 1.5 | 2.5 | 1.6 | 1.6 | 1.9 | 1.7 | 2.2 | 2.3 | 2.0 | 2.1 | 1.5 | 2.2 |
| Sweden | 0.5 | 1.6 | 1.4 | 1.3 | 1.6 | 1.2 | 1.5 | 1.6 | 1.8 | 1.5 | 1.9 | 2.4 | 1.7 |
| United States | 0.9 | 1.2 | 1.3 | 1.5 | 1.8 | 2.8 | 1.6 | 0.8 | 2.6 | 2.4 | 1.6 | 1.7 | 1.4 |
| Hungary | 0.8 | 0.8 | 1.3 | 1.4 | 0.7 | 0.6 | 1.0 | 0.9 | 1.1 | 0.8 | 0.9 | 0.6 | 1.3 |
| Italy | 1.9 | 1.3 | 1.4 | 1.4 | 1.1 | 1.1 | 1.6 | 1.5 | 1.9 | 2.0 | 2.0 | 2.2 | 1.0 |
| Bulgaria | 1.1 | 0.8 | 1.2 | 1.0 | 1.2 | 0.7 | 1.2 | 1.0 | 1.5 | 1.4 | 1.1 | 0.7 | 0.6 |
| Others | 12.3 | 13.3 | 13.2 | 11.1 | 11.4 | 12.0 | 10.6 | 14.0 | 14.5 | 13.8 | 14.3 | 15.1 | 12.4 |
| Total | 24.9 | 24.3 | 27.3 | 23.0 | 22.5 | 23.5 | 23.3 | 25.9 | 30.1 | 28.3 | 28.5 | 28.6 | 25.3 |
Exports by Country
Germany (264 tons), Russia (181 tons) and Hungary (109 tons) were the main destinations of copper pipe and fitting exports from Turkey, together accounting for 28% of total exports. These countries were followed by Italy, Sweden, the United States and Bulgaria, which together accounted for a further 16%.
From July 2022 to July 2023, the biggest increases were in Sweden (with a CAGR of +9.5%), while shipments for the other leaders experienced more modest paces of growth.
In value terms, Germany ($4.6M) remains the key foreign market for copper pipe and fitting exports from Turkey, comprising 18% of total exports. The second position in the ranking was held by Russia ($2.2M), with an 8.9% share of total exports. It was followed by Sweden, with a 6.6% share.
From July 2022 to July 2023, the average monthly growth rate of value to Germany was relatively modest. Exports to the other major destinations recorded the following average monthly rates of exports growth: Russia (-0.5% per month) and Sweden (+10.6% per month).
Exports by Type
Tube or pipe fittings, couplings, elbows, sleeves of copper alloys (1.1K tons), tubes and pipes of refined copper (649 tons) and tube or pipe fittings, couplings, elbows, sleeves of refined copper (136 tons) were the main products of copper pipe and fitting exports from Turkey, with a combined 96% share of total exports. These products were followed by tubes and pipes of copper alloys other than copper-zinc, cupro-nickel or nickel-silver, tubes and pipes of copper-zinc base alloys (brass) and tubes and pipes of copper-nickel base alloys (cupro-nickel) or copper-nickel-zinc base alloys (nickel silver), which together accounted for a further 4.3%.
From July 2022 to July 2023, the most notable rate of growth in terms of shipments, amongst the major product types, was attained by copper tube or pipe fitting (with a CAGR of +7.4%), while the other products experienced mixed trend patterns.
In value terms, tube or pipe fittings, couplings, elbows, sleeves of copper alloys ($16M) remains the largest type of copper pipe and fitting exported from Turkey, comprising 61% of total exports. The second position in the ranking was taken by tubes and pipes of refined copper ($6M), with a 24% share of total exports. It was followed by tube or pipe fittings, couplings, elbows, sleeves of refined copper, with a 10% share.
From July 2022 to July 2023, the average monthly growth rate of the export volume of tube or pipe fittings, couplings, elbows, sleeves of copper alloys was relatively modest. With regard to the other exported products, the following average monthly rates of growth were recorded: tubes and pipes of refined copper (-2.2% per month) and tube or pipe fittings, couplings, elbows, sleeves of refined copper (+8.2% per month).
Export Prices by Country
In July 2023, the copper pipe and fitting price stood at $12,756 per ton (FOB, Turkey), growing by 2.1% against the previous month. Over the period under review, the export price showed a relatively flat trend pattern. The most prominent rate of growth was recorded in December 2022 when the average export price increased by 4.7% m-o-m. The export price peaked at $13,778 per ton in April 2023; however, from May 2023 to July 2023, the export prices stood at a somewhat lower figure.
There were significant differences in the average prices for the major foreign markets. In July 2023, the country with the highest price was Sweden ($18,437 per ton), while the average price for exports to Greece ($1,949 per ton) was amongst the lowest.
From July 2022 to July 2023, the most notable rate of growth in terms of prices was recorded for supplies to Germany (+2.3%), while the prices for the other major destinations experienced more modest paces of growth.
This report provides an in-depth analysis of the market for copper pipe and fitting in Turkey. Within it, you will discover the latest data on market trends and opportunities by country, consumption, production and price developments, as well as the global trade (imports and exports). The forecast exhibits the market prospects through 2030.
Product coverage:
- Prodcom 24442630 - Copper tubes and pipes
- Prodcom 24442650 - Copper and copper alloy tube/pipe fittings including couplings, elbows, sleeves, tees and joints excluding bolts and nuts used for assembling/fixing pipes/tubes, fittings with taps, cocks, valves
Country coverage:
- Turkey
Data coverage:
- Market volume and value
- Per Capita consumption
- Forecast of the market dynamics in the medium term
- Trade (exports and imports) in Turkey
- Export and import prices
- Market trends, drivers and restraints
- Key market players and their profiles
Reasons to buy this report:
- Take advantage of the latest data
- Find deeper insights into current market developments
- Discover vital success factors affecting the market
This report is designed for manufacturers, distributors, importers, and wholesalers, as well as for investors, consultants and advisors.
In this report, you can find information that helps you to make informed decisions on the following issues:
- How to diversify your business and benefit from new market opportunities
- How to load your idle production capacity
- How to boost your sales on overseas markets
- How to increase your profit margins
- How to make your supply chain more sustainable
- How to reduce your production and supply chain costs
- How to outsource production to other countries
- How to prepare your business for global expansion
While doing this research, we combine the accumulated expertise of our analysts and the capabilities of artificial intelligence. The AI-based platform, developed by our data scientists, constitutes the key working tool for business analysts, empowering them to discover deep insights and ideas from the marketing data.
-
1. INTRODUCTION
Making Data-Driven Decisions to Grow Your Business
- REPORT DESCRIPTION
- RESEARCH METHODOLOGY AND AI PLATFORM
- DATA-DRIVEN DECISIONS FOR YOUR BUSINESS
- GLOSSARY AND SPECIFIC TERMS
-
2. EXECUTIVE SUMMARY
A Quick Overview of Market Performance
- KEY FINDINGS
- MARKET TRENDS This Chapter is Available Only for the Professional Edition PRO
-
3. MARKET OVERVIEW
Understanding the Current State of The Market and Its Prospects
- MARKET SIZE
- MARKET STRUCTURE
- TRADE BALANCE
- PER CAPITA CONSUMPTION
- MARKET FORECAST TO 2030
-
4. MOST PROMISING PRODUCT
Finding New Products to Diversify Your Business
This Chapter is Available Only for the Professional Edition PRO- TOP PRODUCTS TO DIVERSIFY YOUR BUSINESS
- BEST-SELLING PRODUCTS
- MOST CONSUMED PRODUCT
- MOST TRADED PRODUCT
- MOST PROFITABLE PRODUCT FOR EXPORT
-
5. MOST PROMISING SUPPLYING COUNTRIES
Choosing the Best Countries to Establish Your Sustainable Supply Chain
This Chapter is Available Only for the Professional Edition PRO- TOP COUNTRIES TO SOURCE YOUR PRODUCT
- TOP PRODUCING COUNTRIES
- TOP EXPORTING COUNTRIES
- LOW-COST EXPORTING COUNTRIES
-
6. MOST PROMISING OVERSEAS MARKETS
Choosing the Best Countries to Boost Your Exports
This Chapter is Available Only for the Professional Edition PRO- TOP OVERSEAS MARKETS FOR EXPORTING YOUR PRODUCT
- TOP CONSUMING MARKETS
- UNSATURATED MARKETS
- TOP IMPORTING MARKETS
- MOST PROFITABLE MARKETS
7. PRODUCTION
The Latest Trends and Insights into The Industry
- PRODUCTION VOLUME AND VALUE
8. IMPORTS
The Largest Import Supplying Countries
- IMPORTS FROM 2012–2023
- IMPORTS BY COUNTRY
- IMPORT PRICES BY COUNTRY
9. EXPORTS
The Largest Destinations for Exports
- EXPORTS FROM 2012–2023
- EXPORTS BY COUNTRY
- EXPORT PRICES BY COUNTRY
-
10. PROFILES OF MAJOR PRODUCERS
The Largest Producers on The Market and Their Profiles
This Chapter is Available Only for the Professional Edition PRO -
LIST OF TABLES
- Key Findings In 2023
- Market Volume, In Physical Terms, 2012–2023
- Market Value, 2012–2023
- Per Capita Consumption In 2012-2023
- Imports, In Physical Terms, By Country, 2012–2023
- Imports, In Value Terms, By Country, 2012–2023
- Import Prices, By Country Of Origin, 2012–2023
- Exports, In Physical Terms, By Country, 2012–2023
- Exports, In Value Terms, By Country, 2012–2023
- Export Prices, By Country Of Destination, 2012–2023
-
LIST OF FIGURES
- Market Volume, In Physical Terms, 2012–2023
- Market Value, 2012–2023
- Market Structure – Domestic Supply vs. Imports, In Physical Terms, 2012-2023
- Market Structure – Domestic Supply vs. Imports, In Value Terms, 2012-2023
- Trade Balance, In Physical Terms, 2012-2023
- Trade Balance, In Value Terms, 2012-2023
- Per Capita Consumption, 2012-2023
- Market Volume Forecast to 2030
- Market Value Forecast to 2030
- Products: Market Size And Growth, By Type
- Products: Average Per Capita Consumption, By Type
- Products: Exports And Growth, By Type
- Products: Export Prices And Growth, By Type
- Production Volume And Growth
- Exports And Growth
- Export Prices And Growth
- Market Size And Growth
- Per Capita Consumption
- Imports And Growth
- Import Prices
- Production, In Physical Terms, 2012–2023
- Production, In Value Terms, 2012–2023
- Imports, In Physical Terms, 2012–2023
- Imports, In Value Terms, 2012–2023
- Imports, In Physical Terms, By Country, 2023
- Imports, In Physical Terms, By Country, 2012–2023
- Imports, In Value Terms, By Country, 2012–2023
- Import Prices, By Country Of Origin, 2012–2023
- Exports, In Physical Terms, 2012–2023
- Exports, In Value Terms, 2012–2023
- Exports, In Physical Terms, By Country, 2023
- Exports, In Physical Terms, By Country, 2012–2023
- Exports, In Value Terms, By Country, 2012–2023
- Export Prices, By Country Of Destination, 2012–2023


