
Thailand - Soap - Market Analysis, Forecast, Size, Trends And Insights
Get instant access to more than 2 million reports, dashboards, and datasets on the IndexBox Platform.
View PricingThailand Sees Modest Increase in Soap Price, Reaching $2,496 per Ton
Thailand Soap Export Price in June 2023
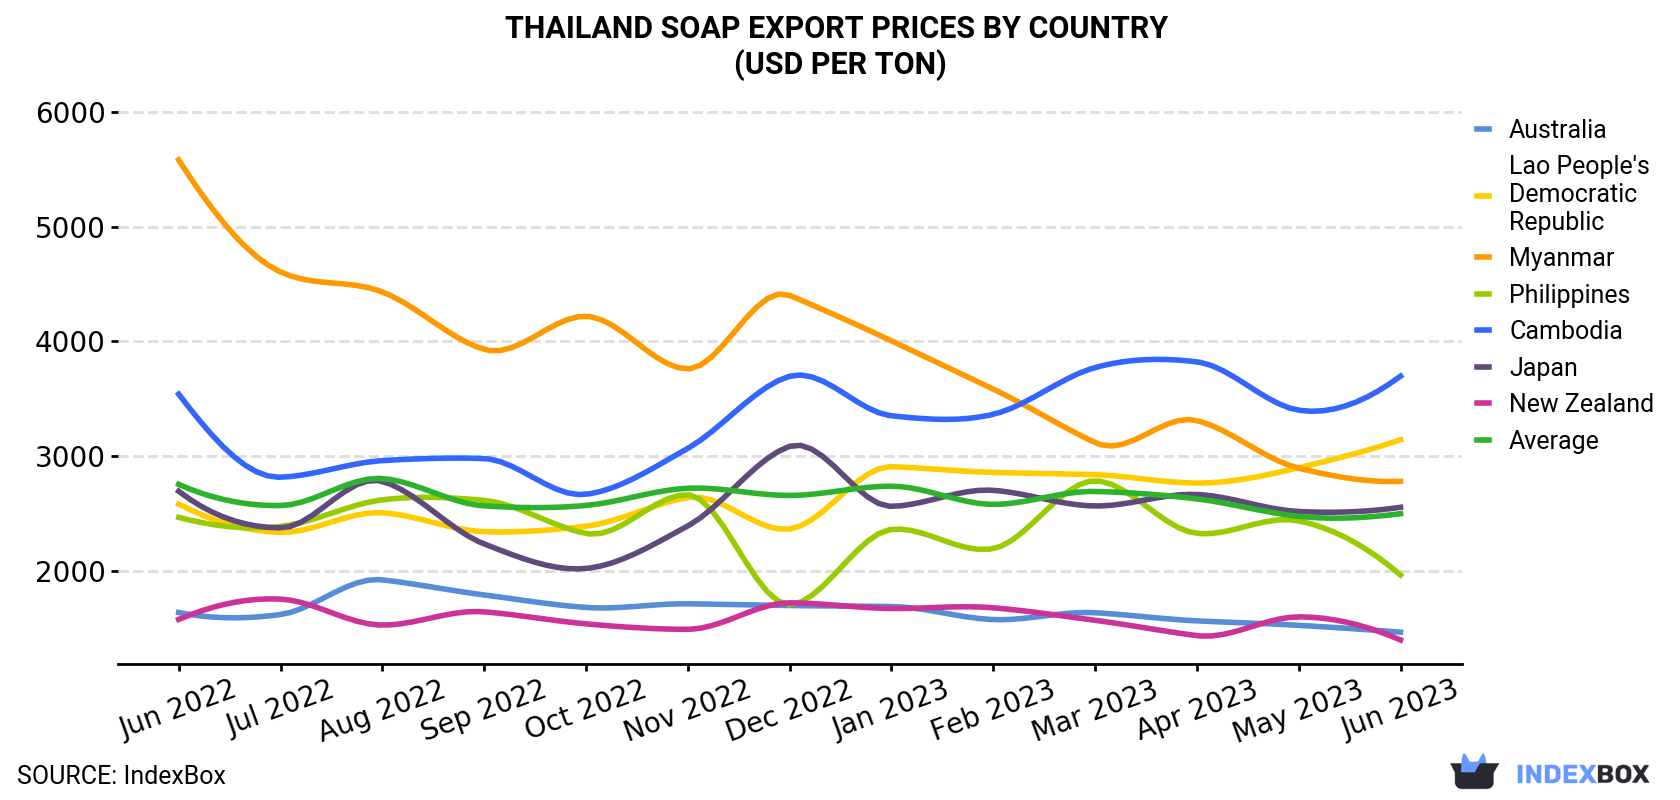
In June 2023, the soap price amounted to $2,496 per ton (FOB, Thailand), approximately equating the previous month. In general, the export price, however, saw a relatively flat trend pattern. The pace of growth was the most pronounced in August 2022 when the average export price increased by 9.2% month-to-month. As a result, the export price reached the peak level of $2,803 per ton. From September 2022 to June 2023, the the average export prices failed to regain momentum.
There were significant differences in the average prices for the major external markets. In June 2023, the country with the highest price was Cambodia ($3,696 per ton), while the average price for exports to New Zealand ($1,394 per ton) was amongst the lowest.
From June 2022 to June 2023, the most notable rate of growth in terms of prices was recorded for supplies to Lao People's Democratic Republic (+1.7%), while the prices for the other major destinations experienced mixed trend patterns.
| COUNTRY | Export Price of Soap in Thailand (USD per ton) | ||||||||||||
|---|---|---|---|---|---|---|---|---|---|---|---|---|---|
| Jun 2022 | Jul 2022 | Aug 2022 | Sep 2022 | Oct 2022 | Nov 2022 | Dec 2022 | Jan 2023 | Feb 2023 | Mar 2023 | Apr 2023 | May 2023 | Jun 2023 | |
| Cambodia | 3,539 | 2,814 | 2,959 | 2,977 | 2,665 | 3,066 | 3,695 | 3,350 | 3,363 | 3,771 | 3,821 | 3,399 | 3,696 |
| Lao People's Democratic Republic | 2,580 | 2,333 | 2,504 | 2,339 | 2,387 | 2,637 | 2,362 | 2,906 | 2,856 | 2,836 | 2,763 | 2,897 | 3,141 |
| Myanmar | 5,582 | 4,605 | 4,431 | 3,929 | 4,219 | 3,759 | 4,401 | 4,004 | 3,583 | 3,116 | 3,309 | 2,893 | 2,778 |
| Japan | 2,692 | 2,372 | 2,778 | 2,232 | 2,018 | 2,389 | 3,084 | 2,560 | 2,700 | 2,563 | 2,664 | 2,515 | 2,552 |
| Philippines | 2,464 | 2,385 | 2,617 | 2,612 | 2,323 | 2,662 | 1,702 | 2,359 | 2,191 | 2,783 | 2,324 | 2,433 | 1,961 |
| Australia | 1,634 | 1,616 | 1,919 | 1,787 | 1,678 | 1,710 | 1,695 | 1,686 | 1,572 | 1,632 | 1,561 | 1,522 | 1,462 |
| New Zealand | 1,573 | 1,751 | 1,524 | 1,640 | 1,535 | 1,487 | 1,718 | 1,669 | 1,675 | 1,566 | 1,432 | 1,596 | 1,394 |
| Average | 2,752 | 2,567 | 2,803 | 2,564 | 2,568 | 2,718 | 2,655 | 2,736 | 2,577 | 2,690 | 2,625 | 2,473 | 2,496 |
Thailand Soap Export Prices by Type
There were significant differences in the average prices for the major types of exported product. In June 2023, the product with the highest price was soap and organic surface-active products in bars other than for toilet use ($5,734 per ton), while the average price for exports of soap in different forms ($1,646 per ton) was amongst the lowest.
From June 2022 to June 2023, the most notable rate of growth in terms of prices was recorded for the following types: skin organic surface-active products (+0.1%), while the prices for the other products experienced a decline.
Thailand Soap Exports
In June 2023, exports of soap from Thailand reduced to 12K tons, which is down by -7.7% against May 2023 figures. In general, exports, however, continue to indicate a relatively flat trend pattern. The pace of growth appeared the most rapid in May 2023 when exports increased by 35% against the previous month. As a result, the exports attained the peak of 13K tons, and then fell in the following month.
In value terms, soap exports contracted to $29M (IndexBox estimates) in June 2023. Overall, exports recorded a relatively flat trend pattern. The pace of growth was the most pronounced in May 2023 with an increase of 27% m-o-m.
Thailand Soap Exports by Type
Soap in different forms (4.7K tons), organic surface-active products for washing the skin (3.6K tons) and soap and organic surface-active products in bars for toilet use (3.3K tons) were the main products of soap exports from Thailand, together comprising 99% of total exports. These products were followed by soap and organic surface-active products in bars other than for toilet use, which accounted for a further 1.2%.
From June 2022 to June 2023, the most notable rate of growth in terms of shipments, amongst the major product types, was attained by soap in bars other than for toilet use (with a CAGR of +0.6%), while the other products experienced more modest paces of growth.
In value terms, organic surface-active products for washing the skin ($11M), soap and organic surface-active products in bars for toilet use ($9.3M) and soap in different forms ($7.8M) were the most exported types of soap from Thailand worldwide, with a combined 97% share of total exports. Soap and organic surface-active products in bars other than for toilet use lagged somewhat behind, accounting for a further 2.7%.
In terms of the main product categories, skin organic surface-active products, with a CAGR of +0.3%, saw the highest growth rate of the value of exports, over the period under review, while shipments for the other products experienced a decline.
Thailand Soap Exports by Country
Australia (2.8K tons), Myanmar (1.4K tons) and the Philippines (1.2K tons) were the main destinations of soap exports from Thailand, together accounting for 47% of total exports.
From June 2022 to June 2023, the biggest increases were in the Philippines (with a CAGR of +4.4%), while shipments for the other leaders experienced more modest paces of growth.
In value terms, the largest markets for soap exported from Thailand were Australia ($4.1M), Myanmar ($3.9M) and Japan ($3M), with a combined 38% share of total exports. These countries were followed by the Philippines, Cambodia, Lao People's Democratic Republic, the UK, Tanzania, Indonesia, Malaysia, Nigeria, New Zealand and Singapore, which together accounted for a further 44%.
In terms of the main countries of destination, the Philippines, with a CAGR of +2.4%, recorded the highest growth rate of the value of exports, over the period under review, while shipments for the other leaders experienced more modest paces of growth.
This report provides an in-depth analysis of the soap market in Thailand. Within it, you will discover the latest data on market trends and opportunities by country, consumption, production and price developments, as well as the global trade (imports and exports). The forecast exhibits the market prospects through 2030.
Product coverage:
- Prodcom 20413120 - Soap and organic surface-active products in bars, etc., n.e.c.
- Prodcom 20413150 - Soap in the form of flakes, wafers, granules or powders
- Prodcom 20413180 - Soap in forms excluding bars, cakes or moulded shapes, p aper, wadding, felt and non-wovens impregnated or coated with soap/detergent, flakes, granules or powders
- Prodcom 20421915 - Soap and organic surface-active products in bars, etc., for toilet use
- Prodcom 20421930 - Organic surface-active products and preparations for washing the skin, whether or not containing soap, p.r.s.
Country coverage:
- Thailand
Data coverage:
- Market volume and value
- Per Capita consumption
- Forecast of the market dynamics in the medium term
- Trade (exports and imports) in Thailand
- Export and import prices
- Market trends, drivers and restraints
- Key market players and their profiles
Reasons to buy this report:
- Take advantage of the latest data
- Find deeper insights into current market developments
- Discover vital success factors affecting the market
This report is designed for manufacturers, distributors, importers, and wholesalers, as well as for investors, consultants and advisors.
In this report, you can find information that helps you to make informed decisions on the following issues:
- How to diversify your business and benefit from new market opportunities
- How to load your idle production capacity
- How to boost your sales on overseas markets
- How to increase your profit margins
- How to make your supply chain more sustainable
- How to reduce your production and supply chain costs
- How to outsource production to other countries
- How to prepare your business for global expansion
While doing this research, we combine the accumulated expertise of our analysts and the capabilities of artificial intelligence. The AI-based platform, developed by our data scientists, constitutes the key working tool for business analysts, empowering them to discover deep insights and ideas from the marketing data.
-
1. INTRODUCTION
Making Data-Driven Decisions to Grow Your Business
- REPORT DESCRIPTION
- RESEARCH METHODOLOGY AND AI PLATFORM
- DATA-DRIVEN DECISIONS FOR YOUR BUSINESS
- GLOSSARY AND SPECIFIC TERMS
-
2. EXECUTIVE SUMMARY
A Quick Overview of Market Performance
- KEY FINDINGS
- MARKET TRENDS This Chapter is Available Only for the Professional Edition PRO
-
3. MARKET OVERVIEW
Understanding the Current State of The Market and Its Prospects
- MARKET SIZE
- MARKET STRUCTURE
- TRADE BALANCE
- PER CAPITA CONSUMPTION
- MARKET FORECAST TO 2030
-
4. MOST PROMISING PRODUCT
Finding New Products to Diversify Your Business
This Chapter is Available Only for the Professional Edition PRO- TOP PRODUCTS TO DIVERSIFY YOUR BUSINESS
- BEST-SELLING PRODUCTS
- MOST CONSUMED PRODUCT
- MOST TRADED PRODUCT
- MOST PROFITABLE PRODUCT FOR EXPORT
-
5. MOST PROMISING SUPPLYING COUNTRIES
Choosing the Best Countries to Establish Your Sustainable Supply Chain
This Chapter is Available Only for the Professional Edition PRO- TOP COUNTRIES TO SOURCE YOUR PRODUCT
- TOP PRODUCING COUNTRIES
- TOP EXPORTING COUNTRIES
- LOW-COST EXPORTING COUNTRIES
-
6. MOST PROMISING OVERSEAS MARKETS
Choosing the Best Countries to Boost Your Exports
This Chapter is Available Only for the Professional Edition PRO- TOP OVERSEAS MARKETS FOR EXPORTING YOUR PRODUCT
- TOP CONSUMING MARKETS
- UNSATURATED MARKETS
- TOP IMPORTING MARKETS
- MOST PROFITABLE MARKETS
7. PRODUCTION
The Latest Trends and Insights into The Industry
- PRODUCTION VOLUME AND VALUE
8. IMPORTS
The Largest Import Supplying Countries
- IMPORTS FROM 2012–2023
- IMPORTS BY COUNTRY
- IMPORT PRICES BY COUNTRY
9. EXPORTS
The Largest Destinations for Exports
- EXPORTS FROM 2012–2023
- EXPORTS BY COUNTRY
- EXPORT PRICES BY COUNTRY
-
10. PROFILES OF MAJOR PRODUCERS
The Largest Producers on The Market and Their Profiles
This Chapter is Available Only for the Professional Edition PRO -
LIST OF TABLES
- Key Findings In 2023
- Market Volume, In Physical Terms, 2012–2023
- Market Value, 2012–2023
- Per Capita Consumption In 2012-2023
- Imports, In Physical Terms, By Country, 2012–2023
- Imports, In Value Terms, By Country, 2012–2023
- Import Prices, By Country Of Origin, 2012–2023
- Exports, In Physical Terms, By Country, 2012–2023
- Exports, In Value Terms, By Country, 2012–2023
- Export Prices, By Country Of Destination, 2012–2023
-
LIST OF FIGURES
- Market Volume, In Physical Terms, 2012–2023
- Market Value, 2012–2023
- Market Structure – Domestic Supply vs. Imports, In Physical Terms, 2012-2023
- Market Structure – Domestic Supply vs. Imports, In Value Terms, 2012-2023
- Trade Balance, In Physical Terms, 2012-2023
- Trade Balance, In Value Terms, 2012-2023
- Per Capita Consumption, 2012-2023
- Market Volume Forecast to 2030
- Market Value Forecast to 2030
- Products: Market Size And Growth, By Type
- Products: Average Per Capita Consumption, By Type
- Products: Exports And Growth, By Type
- Products: Export Prices And Growth, By Type
- Production Volume And Growth
- Exports And Growth
- Export Prices And Growth
- Market Size And Growth
- Per Capita Consumption
- Imports And Growth
- Import Prices
- Production, In Physical Terms, 2012–2023
- Production, In Value Terms, 2012–2023
- Imports, In Physical Terms, 2012–2023
- Imports, In Value Terms, 2012–2023
- Imports, In Physical Terms, By Country, 2023
- Imports, In Physical Terms, By Country, 2012–2023
- Imports, In Value Terms, By Country, 2012–2023
- Import Prices, By Country Of Origin, 2012–2023
- Exports, In Physical Terms, 2012–2023
- Exports, In Value Terms, 2012–2023
- Exports, In Physical Terms, By Country, 2023
- Exports, In Physical Terms, By Country, 2012–2023
- Exports, In Value Terms, By Country, 2012–2023
- Export Prices, By Country Of Destination, 2012–2023


