
Thailand - Passenger Cars - Market Analysis, Forecast, Size, Trends And Insights
Get instant access to more than 2 million reports, dashboards, and datasets on the IndexBox Platform.
View PricingThailand's September 2023 Export of Passenger Cars Hits $1B
Thailand Passenger Car Exports
In September 2023, the amount of passenger cars exported from Thailand skyrocketed to 69K units, rising by 47% against the month before. Over the period under review, total exports indicated a slight expansion from September 2022 to September 2023: its volume increased at an average monthly rate of +1.8% over the last twelve-month period. The trend pattern, however, indicated some noticeable fluctuations being recorded throughout the analyzed period. Based on September 2023 figures, exports decreased by -14.1% against July 2023 indices. The pace of growth appeared the most rapid in May 2023 when exports increased by 62% m-o-m. Over the period under review, the exports attained the maximum at 80K units in July 2023; however, from August 2023 to September 2023, the exports stood at a somewhat lower figure.
In value terms, passenger car exports skyrocketed to $1B (IndexBox estimates) in September 2023. The total export value increased at an average monthly rate of +1.0% over the period from September 2022 to September 2023; however, the trend pattern indicated some noticeable fluctuations being recorded throughout the analyzed period. The pace of growth appeared the most rapid in May 2023 with an increase of 32% m-o-m. The exports peaked at 1.2B units in November 2022; however, from December 2022 to September 2023, the exports failed to regain momentum.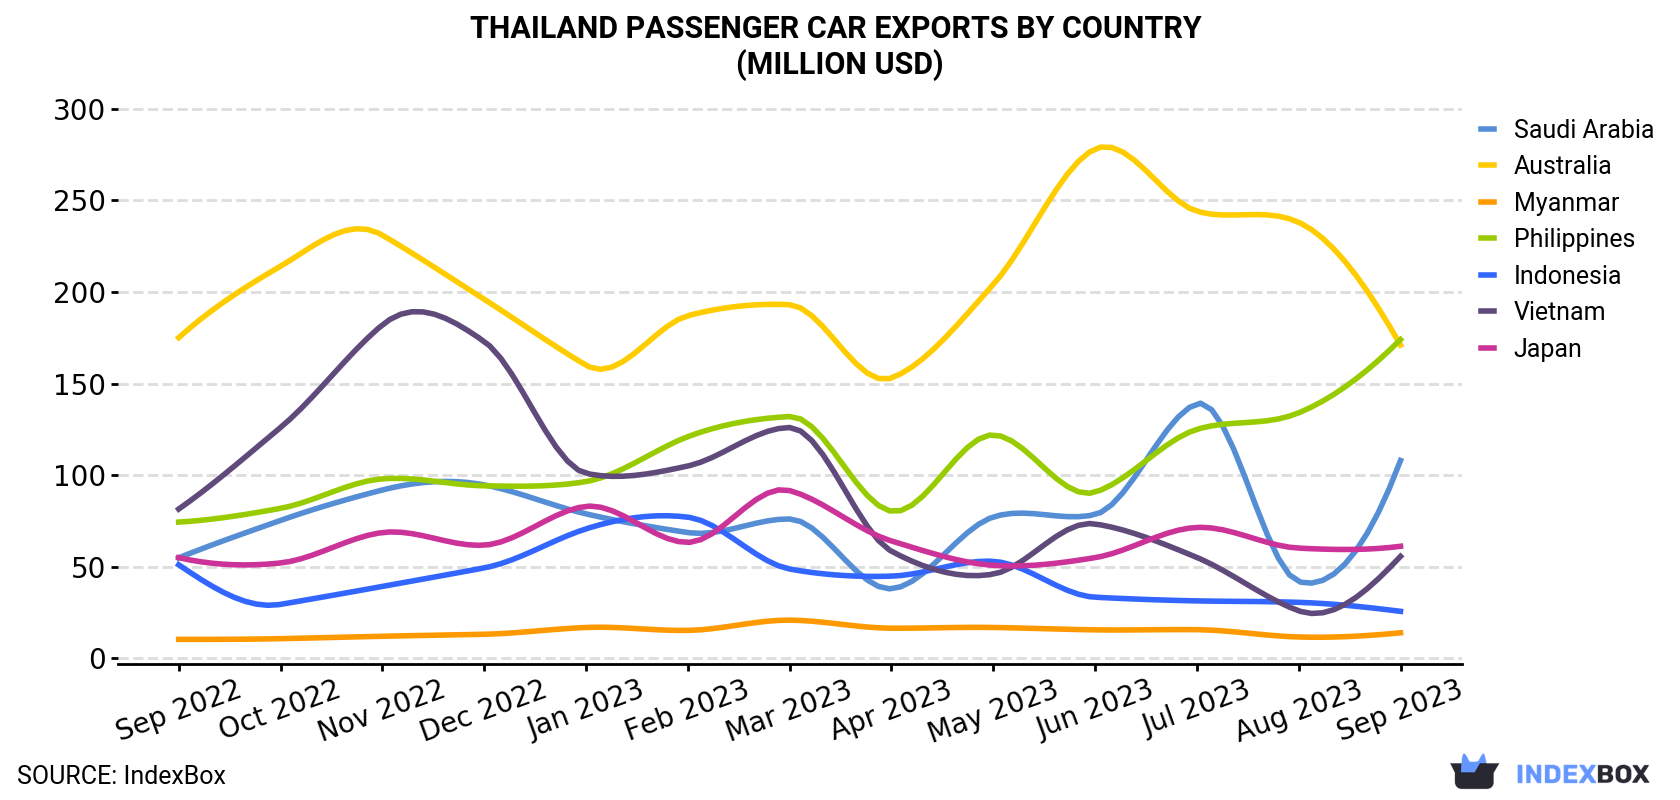
| COUNTRY | Export Value of Passenger Car in Thailand (million USD) | ||||||||||||
|---|---|---|---|---|---|---|---|---|---|---|---|---|---|
| Sep 2022 | Oct 2022 | Nov 2022 | Dec 2022 | Jan 2023 | Feb 2023 | Mar 2023 | Apr 2023 | May 2023 | Jun 2023 | Jul 2023 | Aug 2023 | Sep 2023 | |
| Philippines | 74.4 | 81.9 | 98.0 | 94.2 | 96.5 | 121 | 132 | 80.3 | 122 | 90.7 | 125 | 134 | 174 |
| Australia | 175 | 214 | 231 | 196 | 160 | 187 | 193 | 153 | 204 | 278 | 244 | 238 | 171 |
| Saudi Arabia | 54.9 | 75.3 | 91.9 | 94.7 | 78.9 | 68.7 | 76.1 | 38.0 | 77.2 | 78.5 | 139 | 41.9 | 108 |
| Japan | 55.0 | 52.1 | 68.7 | 61.8 | 83.0 | 63.3 | 91.6 | 64.1 | 50.8 | 55.0 | 71.5 | 60.2 | 61.2 |
| Vietnam | 81.5 | 126 | 182 | 173 | 101 | 105 | 126 | 58.5 | 46.0 | 73.4 | 55.1 | 26.0 | 55.7 |
| Indonesia | 51.1 | 29.5 | 39.3 | 49.4 | 70.7 | 77.1 | 48.8 | 44.9 | 53.0 | 33.4 | 31.4 | 30.6 | 25.7 |
| Myanmar | 10.4 | 10.8 | 12.1 | 13.2 | 16.9 | 15.3 | 20.9 | 16.5 | 16.9 | 15.6 | 15.7 | 11.7 | 14.0 |
| Others | 417 | 429 | 463 | 447 | 338 | 351 | 421 | 268 | 385 | 305 | 454 | 305 | 430 |
| Total | 920 | 1,018 | 1,186 | 1,130 | 945 | 990 | 1,109 | 723 | 955 | 929 | 1,135 | 847 | 1,039 |
Exports by Country
Vietnam (12K units), the Philippines (8.5K units) and Australia (7.5K units) were the main destinations of passenger car exports from Thailand, together comprising 41% of total exports.
From September 2022 to September 2023, the most notable rate of growth in terms of shipments, amongst the main countries of destination, was attained by Vietnam (with a CAGR of +8.5%), while the other leaders experienced more modest paces of growth.
In value terms, the largest markets for passenger car exported from Thailand were the Philippines ($174M), Australia ($171M) and Saudi Arabia ($108M), together accounting for 44% of total exports.
the Philippines, with a CAGR of +7.3%, recorded the highest rates of growth with regard to the value of exports, in terms of the main countries of destination over the period under review, while shipments for the other leaders experienced more modest paces of growth.
Export Prices by Country
In September 2023, the passenger car price amounted to $15,137 per unit (FOB, Thailand), waning by -16.4% against the previous month. In general, the export price showed a relatively flat trend pattern. The growth pace was the most rapid in August 2023 when the average export price increased by 27% against the previous month. As a result, the export price attained the peak level of $18.1M per thousand units, and then shrank significantly in the following month.
There were significant differences in the average prices for the major foreign markets. In September 2023, the country with the highest price was Turkey ($24,006 per unit), while the average price for exports to Myanmar ($3,666 per unit) was amongst the lowest.
From September 2022 to September 2023, the most notable rate of growth in terms of prices was recorded for supplies to the Philippines (+2.6%), while the prices for the other major destinations experienced more modest paces of growth.
This report provides an in-depth analysis of the passenger car market in Thailand. Within it, you will discover the latest data on market trends and opportunities by country, consumption, production and price developments, as well as the global trade (imports and exports). The forecast exhibits the market prospects through 2030.
Product coverage:
- Prodcom 29102100 - Vehicles with spark-ignition engine of a cylinder capacity. 1 .500 cm., new
- Prodcom 29102230 - Motor vehicles with a petrol engine > 1 .500 cm. (including motor caravans of a capacity > 3 .000 cm.) (excluding vehicles for transporting . .10 persons, snowmobiles, golf cars and similar vehicles)
- Prodcom 29102250 - Motor caravans with a spark-ignition internal combustion reciprocating piston engine of a cylinder capacity > 1 .500 cm. but . 3 .000 cm.
- Prodcom 29102310 - Motor vehicles with a diesel or semi-diesel engine . 1 .500 cm. (excluding vehicles for transporting . .10 persons, s nowmobiles, golf cars and similar vehicles)
- Prodcom 29102330 - Motor vehicles with a diesel or semi-diesel engine > 1 .500 cm. but . 2 .500 cm. (excluding vehicles for transporting . .10 persons, motor caravans, snowmobiles, golf cars and similar vehicles)
- Prodcom 29102340 - Motor vehicles with a diesel or semi-diesel engine > 2 .500 cm. (excluding vehicles for transporting . .10 persons, motor caravans, snowmobiles, golf cars and similar vehicles)
- Prodcom 29102353 - Motor caravans with a compression-ignition internal combustion piston engine (diesel or semi-diesel) of a cylinder capacity > 1 .500 cm. but . 2 .500 cm.
- Prodcom 29102355 - Motor caravans with a compression-ignition internal combustion piston engine (diesel or semi-diesel) of a cylinder capacity > 2 .500 cm.
- Prodcom 29102400 - Other motor vehicles for the transport of persons (excluding vehicles for transporting . .10 persons, snowmobiles, golf cars and similar vehicles)
- Prodcom 29102410 -
- Prodcom 29102430 -
- Prodcom 29102450 -
- Prodcom 29102490 -
Country coverage:
- Thailand
Data coverage:
- Market volume and value
- Per Capita consumption
- Forecast of the market dynamics in the medium term
- Trade (exports and imports) in Thailand
- Export and import prices
- Market trends, drivers and restraints
- Key market players and their profiles
Reasons to buy this report:
- Take advantage of the latest data
- Find deeper insights into current market developments
- Discover vital success factors affecting the market
This report is designed for manufacturers, distributors, importers, and wholesalers, as well as for investors, consultants and advisors.
In this report, you can find information that helps you to make informed decisions on the following issues:
- How to diversify your business and benefit from new market opportunities
- How to load your idle production capacity
- How to boost your sales on overseas markets
- How to increase your profit margins
- How to make your supply chain more sustainable
- How to reduce your production and supply chain costs
- How to outsource production to other countries
- How to prepare your business for global expansion
While doing this research, we combine the accumulated expertise of our analysts and the capabilities of artificial intelligence. The AI-based platform, developed by our data scientists, constitutes the key working tool for business analysts, empowering them to discover deep insights and ideas from the marketing data.
-
1. INTRODUCTION
Making Data-Driven Decisions to Grow Your Business
- REPORT DESCRIPTION
- RESEARCH METHODOLOGY AND AI PLATFORM
- DATA-DRIVEN DECISIONS FOR YOUR BUSINESS
- GLOSSARY AND SPECIFIC TERMS
-
2. EXECUTIVE SUMMARY
A Quick Overview of Market Performance
- KEY FINDINGS
- MARKET TRENDS This Chapter is Available Only for the Professional Edition PRO
-
3. MARKET OVERVIEW
Understanding the Current State of The Market and Its Prospects
- MARKET SIZE
- MARKET STRUCTURE
- TRADE BALANCE
- PER CAPITA CONSUMPTION
- MARKET FORECAST TO 2030
-
4. MOST PROMISING PRODUCT
Finding New Products to Diversify Your Business
This Chapter is Available Only for the Professional Edition PRO- TOP PRODUCTS TO DIVERSIFY YOUR BUSINESS
- BEST-SELLING PRODUCTS
- MOST CONSUMED PRODUCT
- MOST TRADED PRODUCT
- MOST PROFITABLE PRODUCT FOR EXPORT
-
5. MOST PROMISING SUPPLYING COUNTRIES
Choosing the Best Countries to Establish Your Sustainable Supply Chain
This Chapter is Available Only for the Professional Edition PRO- TOP COUNTRIES TO SOURCE YOUR PRODUCT
- TOP PRODUCING COUNTRIES
- TOP EXPORTING COUNTRIES
- LOW-COST EXPORTING COUNTRIES
-
6. MOST PROMISING OVERSEAS MARKETS
Choosing the Best Countries to Boost Your Exports
This Chapter is Available Only for the Professional Edition PRO- TOP OVERSEAS MARKETS FOR EXPORTING YOUR PRODUCT
- TOP CONSUMING MARKETS
- UNSATURATED MARKETS
- TOP IMPORTING MARKETS
- MOST PROFITABLE MARKETS
7. PRODUCTION
The Latest Trends and Insights into The Industry
- PRODUCTION VOLUME AND VALUE
8. IMPORTS
The Largest Import Supplying Countries
- IMPORTS FROM 2012–2023
- IMPORTS BY COUNTRY
- IMPORT PRICES BY COUNTRY
9. EXPORTS
The Largest Destinations for Exports
- EXPORTS FROM 2012–2023
- EXPORTS BY COUNTRY
- EXPORT PRICES BY COUNTRY
-
10. PROFILES OF MAJOR PRODUCERS
The Largest Producers on The Market and Their Profiles
This Chapter is Available Only for the Professional Edition PRO -
LIST OF TABLES
- Key Findings In 2023
- Market Volume, In Physical Terms, 2012–2023
- Market Value, 2012–2023
- Per Capita Consumption In 2012-2023
- Imports, In Physical Terms, By Country, 2012–2023
- Imports, In Value Terms, By Country, 2012–2023
- Import Prices, By Country Of Origin, 2012–2023
- Exports, In Physical Terms, By Country, 2012–2023
- Exports, In Value Terms, By Country, 2012–2023
- Export Prices, By Country Of Destination, 2012–2023
-
LIST OF FIGURES
- Market Volume, In Physical Terms, 2012–2023
- Market Value, 2012–2023
- Market Structure – Domestic Supply vs. Imports, In Physical Terms, 2012-2023
- Market Structure – Domestic Supply vs. Imports, In Value Terms, 2012-2023
- Trade Balance, In Physical Terms, 2012-2023
- Trade Balance, In Value Terms, 2012-2023
- Per Capita Consumption, 2012-2023
- Market Volume Forecast to 2030
- Market Value Forecast to 2030
- Products: Market Size And Growth, By Type
- Products: Average Per Capita Consumption, By Type
- Products: Exports And Growth, By Type
- Products: Export Prices And Growth, By Type
- Production Volume And Growth
- Exports And Growth
- Export Prices And Growth
- Market Size And Growth
- Per Capita Consumption
- Imports And Growth
- Import Prices
- Production, In Physical Terms, 2012–2023
- Production, In Value Terms, 2012–2023
- Imports, In Physical Terms, 2012–2023
- Imports, In Value Terms, 2012–2023
- Imports, In Physical Terms, By Country, 2023
- Imports, In Physical Terms, By Country, 2012–2023
- Imports, In Value Terms, By Country, 2012–2023
- Import Prices, By Country Of Origin, 2012–2023
- Exports, In Physical Terms, 2012–2023
- Exports, In Value Terms, 2012–2023
- Exports, In Physical Terms, By Country, 2023
- Exports, In Physical Terms, By Country, 2012–2023
- Exports, In Value Terms, By Country, 2012–2023
- Export Prices, By Country Of Destination, 2012–2023


