
Japan - Passenger Cars - Market Analysis, Forecast, Size, Trends And Insights
Get instant access to more than 2 million reports, dashboards, and datasets on the IndexBox Platform.
View PricingJapan's Export of Cars Increases Marginally to $10.1B in November 2023
Japan Passenger Car Exports
In November 2023, overseas shipments of passenger cars increased by 0.6% to 481K units, rising for the third consecutive month after two months of decline. Over the period under review, exports saw a relatively flat trend pattern. The most prominent rate of growth was recorded in June 2023 with an increase of 28% m-o-m. As a result, the exports attained the peak of 490K units; afterwards, it flattened through to November 2023.
In value terms, passenger car exports totaled $10.1B (IndexBox estimates) in November 2023. The total export value increased at an average monthly rate of +1.0% over the period from November 2022 to November 2023; however, the trend pattern indicated some noticeable fluctuations being recorded in certain months. The growth pace was the most rapid in June 2023 with an increase of 33% month-to-month. The exports peaked at 10B units in July 2023; however, from August 2023 to November 2023, the exports failed to regain momentum.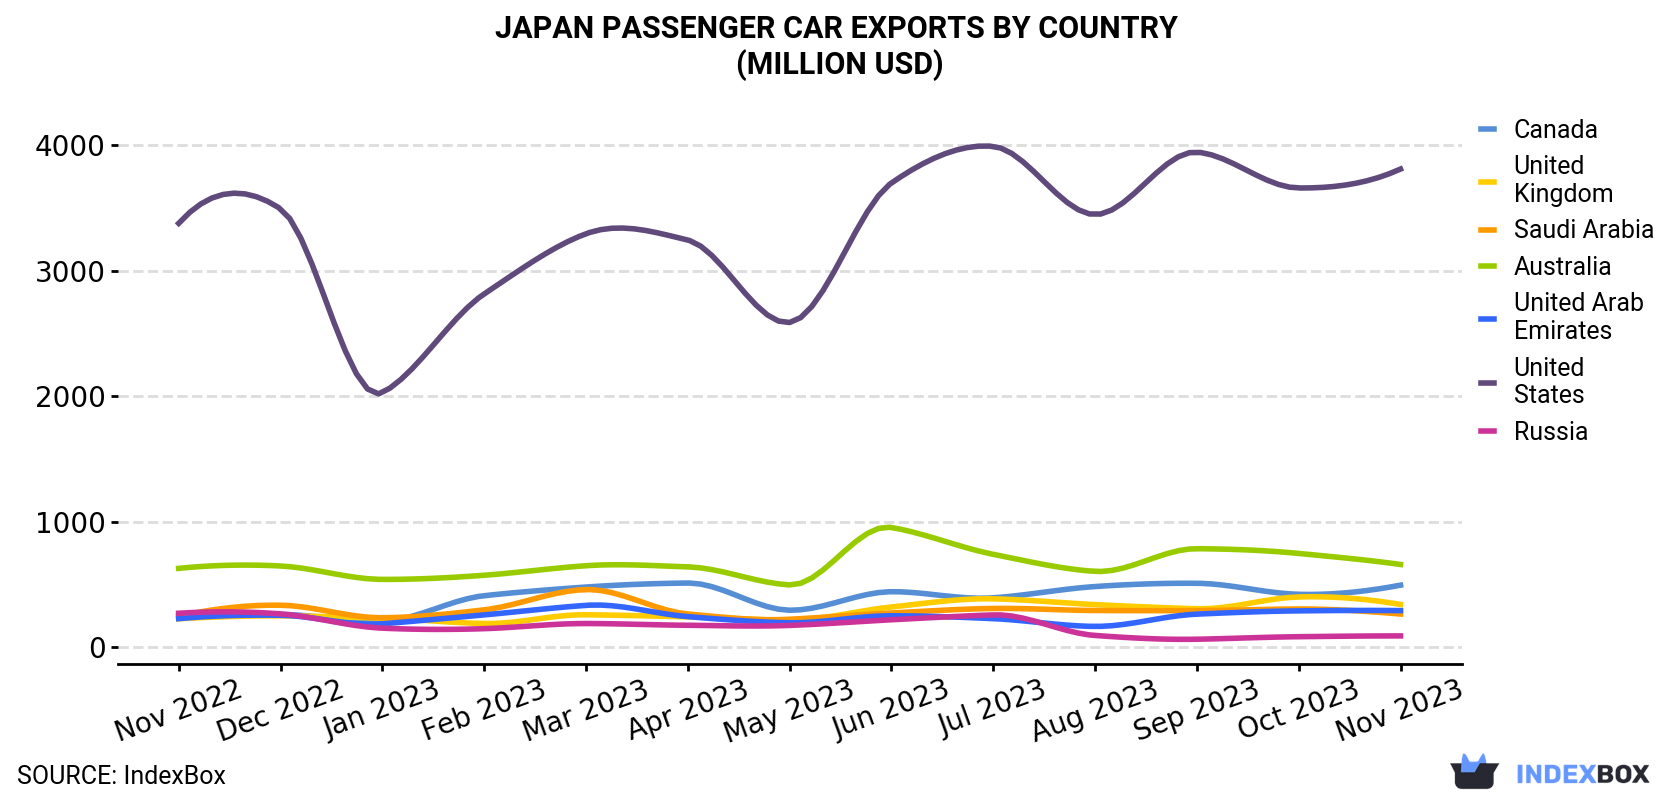
| COUNTRY | Export Value of Passenger Car in Japan (million USD) | ||||||||||||
|---|---|---|---|---|---|---|---|---|---|---|---|---|---|
| Nov 2022 | Dec 2022 | Jan 2023 | Feb 2023 | Mar 2023 | Apr 2023 | May 2023 | Jun 2023 | Jul 2023 | Aug 2023 | Sep 2023 | Oct 2023 | Nov 2023 | |
| United States | 3,379 | 3,495 | 2,028 | 2,816 | 3,296 | 3,246 | 2,588 | 3,701 | 3,993 | 3,449 | 3,947 | 3,661 | 3,812 |
| Australia | 627 | 646 | 539 | 572 | 648 | 639 | 495 | 953 | 739 | 603 | 784 | 746 | 658 |
| Canada | 262 | 260 | 206 | 409 | 478 | 510 | 293 | 441 | 392 | 482 | 508 | 420 | 493 |
| United Kingdom | 225 | 248 | 229 | 187 | 257 | 240 | 214 | 319 | 384 | 338 | 305 | 399 | 339 |
| United Arab Emirates | 226 | 253 | 185 | 256 | 332 | 242 | 193 | 249 | 226 | 164 | 262 | 288 | 290 |
| Saudi Arabia | 245 | 333 | 233 | 296 | 458 | 263 | 221 | 271 | 307 | 291 | 290 | 303 | 263 |
| Russia | 269 | 264 | 150 | 146 | 187 | 173 | 172 | 217 | 256 | 91.7 | 61.7 | 81.9 | 88.2 |
| Others | 3,678 | 3,025 | 2,396 | 3,083 | 3,672 | 3,757 | 3,350 | 3,861 | 3,966 | 3,514 | 3,943 | 4,055 | 4,157 |
| Total | 8,913 | 8,524 | 5,967 | 7,765 | 9,326 | 9,069 | 7,525 | 10,011 | 10,262 | 8,933 | 10,102 | 9,954 | 10,099 |
Exports by Country
The United States (136K units) was the main destination for passenger car exports from Japan, with a 28% share of total exports. Moreover, passenger car exports to the United States exceeded the volume sent to the second major destination, Australia (31K units), fourfold. The United Arab Emirates (28K units) ranked third in terms of total exports with a 5.9% share.
From November 2022 to November 2023, the average monthly growth rate of volume to the United States was relatively modest. Exports to the other major destinations recorded the following average monthly rates of exports growth: Australia (-0.2% per month) and the United Arab Emirates (+2.6% per month).
In value terms, the United States ($3.8B) remains the key foreign market for passenger car exports from Japan, comprising 38% of total exports. The second position in the ranking was taken by Australia ($658M), with a 6.5% share of total exports. It was followed by Canada, with a 4.9% share.
From November 2022 to November 2023, the average monthly growth rate of value to the United States stood at +1.0%. Exports to the other major destinations recorded the following average monthly rates of exports growth: Australia (+0.4% per month) and Canada (+5.4% per month).
Export Prices by Country
In November 2023, the passenger car price stood at $21,009 per unit (FOB, Japan), leveling off at the previous month. Overall, the export price continues to indicate a relatively flat trend pattern. The pace of growth was the most pronounced in July 2023 when the average export price increased by 4.3% month-to-month. As a result, the export price attained the peak level of $21.3M per thousand units. From August 2023 to November 2023, the the average export prices failed to regain momentum.
Prices varied noticeably by the country of destination: the country with the highest price was China ($32,390 per unit), while the average price for exports to Mongolia ($6,157 per unit) was amongst the lowest.
From November 2022 to November 2023, the most notable rate of growth in terms of prices was recorded for supplies to the UK (+1.7%), while the prices for the other major destinations experienced more modest paces of growth.
This report provides an in-depth analysis of the passenger car market in Japan. Within it, you will discover the latest data on market trends and opportunities by country, consumption, production and price developments, as well as the global trade (imports and exports). The forecast exhibits the market prospects through 2030.
Product coverage:
- Prodcom 29102100 - Vehicles with spark-ignition engine of a cylinder capacity. 1 .500 cm., new
- Prodcom 29102230 - Motor vehicles with a petrol engine > 1 .500 cm. (including motor caravans of a capacity > 3 .000 cm.) (excluding vehicles for transporting . .10 persons, snowmobiles, golf cars and similar vehicles)
- Prodcom 29102250 - Motor caravans with a spark-ignition internal combustion reciprocating piston engine of a cylinder capacity > 1 .500 cm. but . 3 .000 cm.
- Prodcom 29102310 - Motor vehicles with a diesel or semi-diesel engine . 1 .500 cm. (excluding vehicles for transporting . .10 persons, s nowmobiles, golf cars and similar vehicles)
- Prodcom 29102330 - Motor vehicles with a diesel or semi-diesel engine > 1 .500 cm. but . 2 .500 cm. (excluding vehicles for transporting . .10 persons, motor caravans, snowmobiles, golf cars and similar vehicles)
- Prodcom 29102340 - Motor vehicles with a diesel or semi-diesel engine > 2 .500 cm. (excluding vehicles for transporting . .10 persons, motor caravans, snowmobiles, golf cars and similar vehicles)
- Prodcom 29102353 - Motor caravans with a compression-ignition internal combustion piston engine (diesel or semi-diesel) of a cylinder capacity > 1 .500 cm. but . 2 .500 cm.
- Prodcom 29102355 - Motor caravans with a compression-ignition internal combustion piston engine (diesel or semi-diesel) of a cylinder capacity > 2 .500 cm.
- Prodcom 29102400 - Other motor vehicles for the transport of persons (excluding vehicles for transporting . .10 persons, snowmobiles, golf cars and similar vehicles)
- Prodcom 29102410 -
- Prodcom 29102430 -
- Prodcom 29102450 -
- Prodcom 29102490 -
Country coverage:
- Japan
Data coverage:
- Market volume and value
- Per Capita consumption
- Forecast of the market dynamics in the medium term
- Trade (exports and imports) in Japan
- Export and import prices
- Market trends, drivers and restraints
- Key market players and their profiles
Reasons to buy this report:
- Take advantage of the latest data
- Find deeper insights into current market developments
- Discover vital success factors affecting the market
This report is designed for manufacturers, distributors, importers, and wholesalers, as well as for investors, consultants and advisors.
In this report, you can find information that helps you to make informed decisions on the following issues:
- How to diversify your business and benefit from new market opportunities
- How to load your idle production capacity
- How to boost your sales on overseas markets
- How to increase your profit margins
- How to make your supply chain more sustainable
- How to reduce your production and supply chain costs
- How to outsource production to other countries
- How to prepare your business for global expansion
While doing this research, we combine the accumulated expertise of our analysts and the capabilities of artificial intelligence. The AI-based platform, developed by our data scientists, constitutes the key working tool for business analysts, empowering them to discover deep insights and ideas from the marketing data.
-
1. INTRODUCTION
Making Data-Driven Decisions to Grow Your Business
- REPORT DESCRIPTION
- RESEARCH METHODOLOGY AND AI PLATFORM
- DATA-DRIVEN DECISIONS FOR YOUR BUSINESS
- GLOSSARY AND SPECIFIC TERMS
-
2. EXECUTIVE SUMMARY
A Quick Overview of Market Performance
- KEY FINDINGS
- MARKET TRENDS This Chapter is Available Only for the Professional Edition PRO
-
3. MARKET OVERVIEW
Understanding the Current State of The Market and Its Prospects
- MARKET SIZE
- MARKET STRUCTURE
- TRADE BALANCE
- PER CAPITA CONSUMPTION
- MARKET FORECAST TO 2030
-
4. MOST PROMISING PRODUCT
Finding New Products to Diversify Your Business
This Chapter is Available Only for the Professional Edition PRO- TOP PRODUCTS TO DIVERSIFY YOUR BUSINESS
- BEST-SELLING PRODUCTS
- MOST CONSUMED PRODUCT
- MOST TRADED PRODUCT
- MOST PROFITABLE PRODUCT FOR EXPORT
-
5. MOST PROMISING SUPPLYING COUNTRIES
Choosing the Best Countries to Establish Your Sustainable Supply Chain
This Chapter is Available Only for the Professional Edition PRO- TOP COUNTRIES TO SOURCE YOUR PRODUCT
- TOP PRODUCING COUNTRIES
- TOP EXPORTING COUNTRIES
- LOW-COST EXPORTING COUNTRIES
-
6. MOST PROMISING OVERSEAS MARKETS
Choosing the Best Countries to Boost Your Exports
This Chapter is Available Only for the Professional Edition PRO- TOP OVERSEAS MARKETS FOR EXPORTING YOUR PRODUCT
- TOP CONSUMING MARKETS
- UNSATURATED MARKETS
- TOP IMPORTING MARKETS
- MOST PROFITABLE MARKETS
7. PRODUCTION
The Latest Trends and Insights into The Industry
- PRODUCTION VOLUME AND VALUE
8. IMPORTS
The Largest Import Supplying Countries
- IMPORTS FROM 2012–2023
- IMPORTS BY COUNTRY
- IMPORT PRICES BY COUNTRY
9. EXPORTS
The Largest Destinations for Exports
- EXPORTS FROM 2012–2023
- EXPORTS BY COUNTRY
- EXPORT PRICES BY COUNTRY
-
10. PROFILES OF MAJOR PRODUCERS
The Largest Producers on The Market and Their Profiles
This Chapter is Available Only for the Professional Edition PRO -
LIST OF TABLES
- Key Findings In 2023
- Market Volume, In Physical Terms, 2012–2023
- Market Value, 2012–2023
- Per Capita Consumption In 2012-2023
- Imports, In Physical Terms, By Country, 2012–2023
- Imports, In Value Terms, By Country, 2012–2023
- Import Prices, By Country Of Origin, 2012–2023
- Exports, In Physical Terms, By Country, 2012–2023
- Exports, In Value Terms, By Country, 2012–2023
- Export Prices, By Country Of Destination, 2012–2023
-
LIST OF FIGURES
- Market Volume, In Physical Terms, 2012–2023
- Market Value, 2012–2023
- Market Structure – Domestic Supply vs. Imports, In Physical Terms, 2012-2023
- Market Structure – Domestic Supply vs. Imports, In Value Terms, 2012-2023
- Trade Balance, In Physical Terms, 2012-2023
- Trade Balance, In Value Terms, 2012-2023
- Per Capita Consumption, 2012-2023
- Market Volume Forecast to 2030
- Market Value Forecast to 2030
- Products: Market Size And Growth, By Type
- Products: Average Per Capita Consumption, By Type
- Products: Exports And Growth, By Type
- Products: Export Prices And Growth, By Type
- Production Volume And Growth
- Exports And Growth
- Export Prices And Growth
- Market Size And Growth
- Per Capita Consumption
- Imports And Growth
- Import Prices
- Production, In Physical Terms, 2012–2023
- Production, In Value Terms, 2012–2023
- Imports, In Physical Terms, 2012–2023
- Imports, In Value Terms, 2012–2023
- Imports, In Physical Terms, By Country, 2023
- Imports, In Physical Terms, By Country, 2012–2023
- Imports, In Value Terms, By Country, 2012–2023
- Import Prices, By Country Of Origin, 2012–2023
- Exports, In Physical Terms, 2012–2023
- Exports, In Value Terms, 2012–2023
- Exports, In Physical Terms, By Country, 2023
- Exports, In Physical Terms, By Country, 2012–2023
- Exports, In Value Terms, By Country, 2012–2023
- Export Prices, By Country Of Destination, 2012–2023


