
Spain - Vegetables And Melons - Market Analysis, Forecast, Size, Trends and Insights
Get instant access to more than 2 million reports, dashboards, and datasets on the IndexBox Platform.
View PricingAugust 2023 Sees a Significant Drop in Spain's Vegetable and Melon Export, Reaching $382M.
Spain Vegetable and Melon Exports
For the third month in a row, Spain recorded decline in shipments abroad of vegetables and melons, which decreased by -5.7% to 350K tons in August 2023. In general, exports continue to indicate a relatively flat trend pattern. The most prominent rate of growth was recorded in November 2022 when exports increased by 53% against the previous month.
In value terms, vegetable and melon exports shrank dramatically to $382M (IndexBox estimates) in August 2023. Overall, exports, however, continue to indicate a relatively flat trend pattern. The pace of growth was the most pronounced in November 2022 with an increase of 54% m-o-m.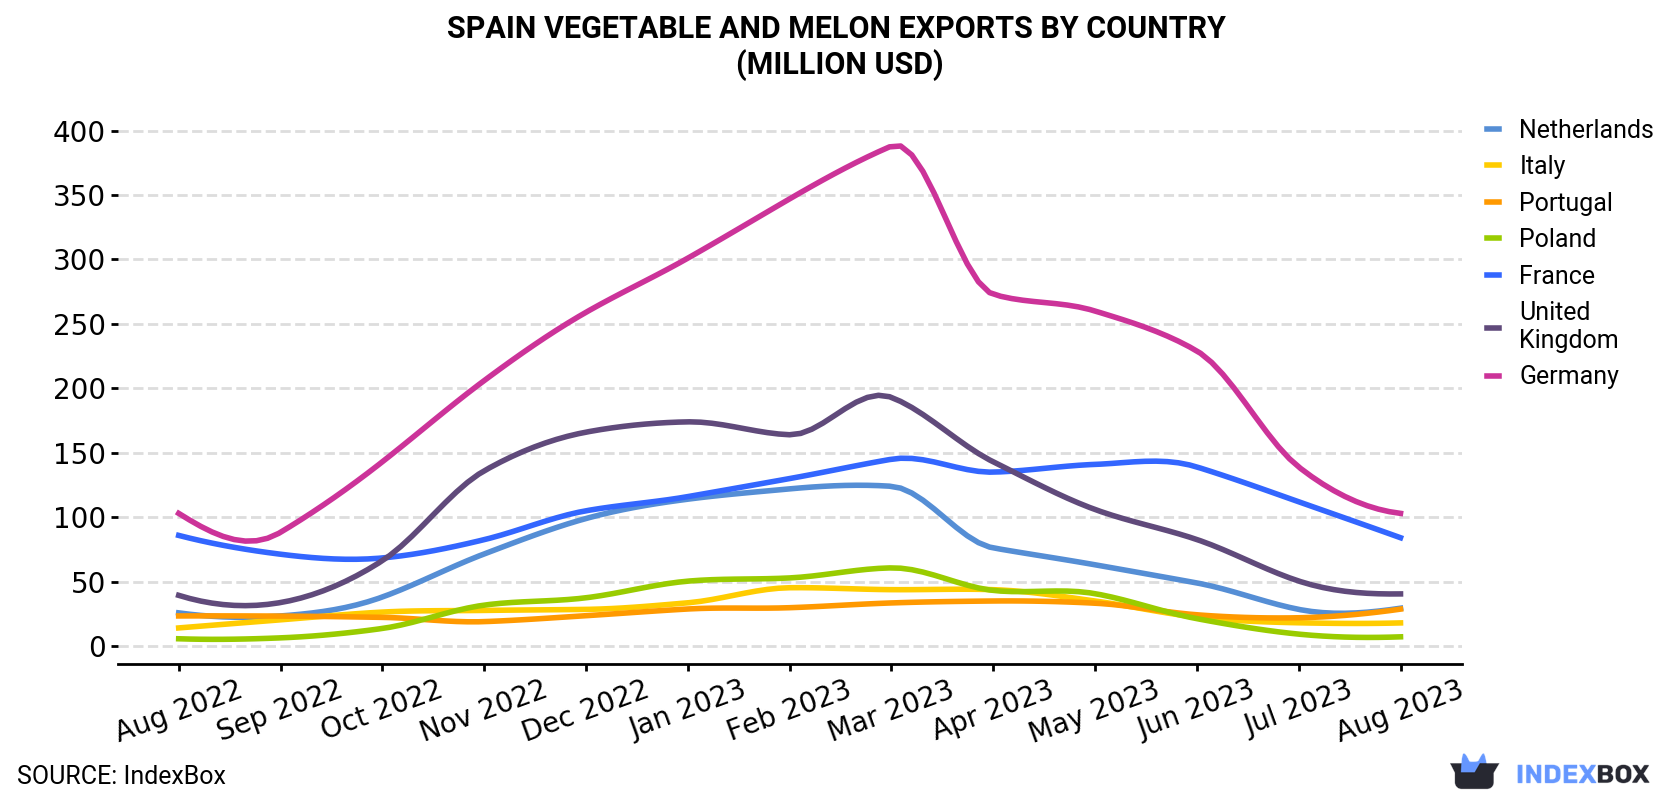
| COUNTRY | Export Value of Vegetable and Melon in Spain (million USD) | ||||||||||||
|---|---|---|---|---|---|---|---|---|---|---|---|---|---|
| Aug 2022 | Sep 2022 | Oct 2022 | Nov 2022 | Dec 2022 | Jan 2023 | Feb 2023 | Mar 2023 | Apr 2023 | May 2023 | Jun 2023 | Jul 2023 | Aug 2023 | |
| Germany | 103 | 88.3 | 143 | 206 | 259 | 301 | 347 | 388 | 273 | 260 | 229 | 139 | 103 |
| France | 85.9 | 71.3 | 68.4 | 82.6 | 105 | 116 | 130 | 145 | 135 | 141 | 139 | 112 | 84.1 |
| United Kingdom | 39.4 | 33.8 | 66.3 | 136 | 166 | 174 | 164 | 193 | 143 | 106 | 82.7 | 50.5 | 40.5 |
| Netherlands | 25.8 | 23.4 | 38.1 | 71.5 | 99.0 | 114 | 122 | 124 | 76.2 | 63.1 | 49.0 | 28.5 | 29.4 |
| Portugal | 23.4 | 23.3 | 22.3 | 19.0 | 23.6 | 28.8 | 29.8 | 33.5 | 35.0 | 33.3 | 24.3 | 22.0 | 28.7 |
| Italy | 14.1 | 20.4 | 26.4 | 27.7 | 28.5 | 33.6 | 45.3 | 43.8 | 43.8 | 35.0 | 22.5 | 18.1 | 18.0 |
| Poland | 5.7 | 6.4 | 13.7 | 31.8 | 37.5 | 50.4 | 52.9 | 60.7 | 43.2 | 40.7 | 21.3 | 9.3 | 7.2 |
| Others | 68.7 | 63.2 | 94.7 | 153 | 184 | 213 | 219 | 248 | 184 | 169 | 137 | 89.4 | 71.2 |
| Total | 365 | 330 | 474 | 728 | 904 | 1,032 | 1,110 | 1,236 | 934 | 847 | 705 | 469 | 382 |
Exports by Country
Germany (88K tons), France (74K tons) and Portugal (41K tons) were the main destinations of vegetable and melon exports from Spain, with a combined 58% share of total exports. These countries were followed by the UK, the Netherlands, Italy and Poland, which together accounted for a further 26%.
From August 2022 to August 2023, the biggest increases were in Poland (with a CAGR of +3.5%), while shipments for the other leaders experienced more modest paces of growth.
In value terms, Germany ($103M), France ($84M) and the UK ($41M) were the largest markets for vegetable and melon exported from Spain worldwide, with a combined 60% share of total exports. These countries were followed by the Netherlands, Portugal, Italy and Poland, which together accounted for a further 22%.
Among the main countries of destination, Italy, with a CAGR of +2.0%, recorded the highest growth rate of the value of exports, over the period under review, while shipments for the other leaders experienced more modest paces of growth.
Exports by Type
Watermelons (99K tons), potatoes (63K tons) and melons (57K tons) were the main products of vegetable and melon exports from Spain, with a combined 63% share of total exports. Onion and shallot, lettuce and chicory, fresh vegetables, nes, chilies and peppers (green), garlic, tomatoes, cucumbers and gherkins, carrots and turnips, eggplants (aubergines), cauliflower and broccoli, leeks and other alliaceous vegetables, green beans, cabbage and other brassicas, spinach, mushrooms and truffles, asparagus and peas (green) lagged somewhat behind, together accounting for a further 37%.
From August 2022 to August 2023, the most notable rate of growth in terms of shipments, amongst the major product types, was attained by green peas (with a CAGR of +2.5%), while the other products experienced more modest paces of growth.
In value terms, the most traded types of vegetables and melons in Spain were watermelons ($69M), melons ($53M) and chilies and peppers (green) ($41M), with a combined 43% share of total exports. These products were followed by garlic, potatoes, tomatoes, lettuce and chicory, onion and shallot, fresh vegetables, nes, cucumbers and gherkins, eggplants (aubergines), cauliflower and broccoli, carrots and turnips, green beans, asparagus, spinach, mushrooms and truffles, leeks and other alliaceous vegetables, cabbage and other brassicas and peas (green), which together accounted for a further 57%.
Green peas, with a CAGR of +10.5%, saw the highest rates of growth with regard to the value of exports, in terms of the main product categories over the period under review, while shipments for the other products experienced more modest paces of growth.
Export Prices by Country
In August 2023, the vegetable and melon price amounted to $1,091 per ton (FOB, Spain), reducing by -13.6% against the previous month. Over the period under review, export price indicated mild growth from August 2022 to August 2023: its price increased at an average monthly rate of +1.3% over the last twelve months. The trend pattern, however, indicated some noticeable fluctuations being recorded throughout the analyzed period. Based on August 2023 figures, vegetable and melon export price decreased by -46.9% against February 2023 indices. The most prominent rate of growth was recorded in February 2023 when the average export price increased by 27% month-to-month. As a result, the export price reached the peak level of $2,054 per ton. From March 2023 to August 2023, the the average export prices remained at a somewhat lower figure.
There were significant differences in the average prices for the major foreign markets. In August 2023, the country with the highest price was Italy ($1,437 per ton), while the average price for exports to Portugal ($692 per ton) was amongst the lowest.
From August 2022 to August 2023, the most notable rate of growth in terms of prices was recorded for supplies to France (+2.4%), while the prices for the other major destinations experienced more modest paces of growth.
This report provides an in-depth analysis of the vegetable and melon market in Spain. Within it, you will discover the latest data on market trends and opportunities by country, consumption, production and price developments, as well as the global trade (imports and exports). The forecast exhibits the market prospects through 2030.
Product coverage:
- FCL 116 - Potatoes
- FCL 388 - Tomatoes, fresh
- FCL 402 - Onions, shallots (green)
- FCL 403 - Onions, dry
- FCL 406 - Garlic
- FCL 407 - Leeks and other alliaceous vegetables
- FCL 393 - Cauliflowers and broccoli
- FCL 372 - Lettuce and chicory
- FCL 426 - Carrot
- FCL 397 - Cucumbers and gherkins
- FCL 417 - Peas, green
- FCL 414 - Beans, green
- FCL 423 - String Beans
- FCL 367 - Asparagus
- FCL 399 - Eggplants
- FCL 401 - Chillies and peppers (green)
- FCL 373 - Spinach
- FCL 260 - Olives
- FCL 394 - Pumpkins, squash and gourds
- FCL 463 - Vegetables, Fresh n.e.s.
- FCL 446 - Green Corn (Maize)
- FCL 430 - Okra
- FCL 394 - Pumpkins, squash and gourds
- FCL 378 - Cassava leaves
- FCL 366 - Artichokes
- FCL 260 - Olives
- FCL 358 - Cabbages
- FCL 449 - Mushrooms
- FCL 366 - Artichokes
Country coverage:
- Spain
Data coverage:
- Market volume and value
- Per Capita consumption
- Forecast of the market dynamics in the medium term
- Trade (exports and imports) in Spain
- Export and import prices
- Market trends, drivers and restraints
- Key market players and their profiles
Reasons to buy this report:
- Take advantage of the latest data
- Find deeper insights into current market developments
- Discover vital success factors affecting the market
This report is designed for manufacturers, distributors, importers, and wholesalers, as well as for investors, consultants and advisors.
In this report, you can find information that helps you to make informed decisions on the following issues:
- How to diversify your business and benefit from new market opportunities
- How to load your idle production capacity
- How to boost your sales on overseas markets
- How to increase your profit margins
- How to make your supply chain more sustainable
- How to reduce your production and supply chain costs
- How to outsource production to other countries
- How to prepare your business for global expansion
While doing this research, we combine the accumulated expertise of our analysts and the capabilities of artificial intelligence. The AI-based platform, developed by our data scientists, constitutes the key working tool for business analysts, empowering them to discover deep insights and ideas from the marketing data.
-
1. INTRODUCTION
Making Data-Driven Decisions to Grow Your Business
- REPORT DESCRIPTION
- RESEARCH METHODOLOGY AND AI PLATFORM
- DATA-DRIVEN DECISIONS FOR YOUR BUSINESS
- GLOSSARY AND SPECIFIC TERMS
-
2. EXECUTIVE SUMMARY
A Quick Overview of Market Performance
- KEY FINDINGS
- MARKET TRENDS This Chapter is Available Only for the Professional Edition PRO
-
3. MARKET OVERVIEW
Understanding the Current State of The Market and Its Prospects
- MARKET SIZE
- MARKET STRUCTURE
- TRADE BALANCE
- PER CAPITA CONSUMPTION
- MARKET FORECAST TO 2030
-
4. MOST PROMISING PRODUCT
Finding New Products to Diversify Your Business
This Chapter is Available Only for the Professional Edition PRO- TOP PRODUCTS TO DIVERSIFY YOUR BUSINESS
- BEST-SELLING PRODUCTS
- MOST CONSUMED PRODUCT
- MOST TRADED PRODUCT
- MOST PROFITABLE PRODUCT FOR EXPORT
-
5. MOST PROMISING SUPPLYING COUNTRIES
Choosing the Best Countries to Establish Your Sustainable Supply Chain
This Chapter is Available Only for the Professional Edition PRO- TOP COUNTRIES TO SOURCE YOUR PRODUCT
- TOP PRODUCING COUNTRIES
- COUNTRIES WITH TOP YIELDS
- TOP EXPORTING COUNTRIES
- LOW-COST EXPORTING COUNTRIES
-
6. MOST PROMISING OVERSEAS MARKETS
Choosing the Best Countries to Boost Your Exports
This Chapter is Available Only for the Professional Edition PRO- TOP OVERSEAS MARKETS FOR EXPORTING YOUR PRODUCT
- TOP CONSUMING MARKETS
- UNSATURATED MARKETS
- TOP IMPORTING MARKETS
- MOST PROFITABLE MARKETS
7. PRODUCTION
The Latest Trends and Insights into The Industry
- PRODUCTION, HARVESTED AREA AND YIELD
8. IMPORTS
The Largest Import Supplying Countries
- IMPORTS FROM 2012–2023
- IMPORTS BY COUNTRY
- IMPORT PRICES BY COUNTRY
9. EXPORTS
The Largest Destinations for Exports
- EXPORTS FROM 2012–2023
- EXPORTS BY COUNTRY
- EXPORT PRICES BY COUNTRY
-
10. PROFILES OF MAJOR PRODUCERS
The Largest Producers on The Market and Their Profiles
This Chapter is Available Only for the Professional Edition PRO -
LIST OF TABLES
- Key Findings In 2023
- Market Volume, In Physical Terms, 2012–2023
- Market Value, 2012–2023
- Per Capita Consumption In 2012-2023
- Imports, In Physical Terms, By Country, 2012–2023
- Imports, In Value Terms, By Country, 2012–2023
- Import Prices, By Country Of Origin, 2012–2023
- Exports, In Physical Terms, By Country, 2012–2023
- Exports, In Value Terms, By Country, 2012–2023
- Export Prices, By Country Of Destination, 2012–2023
-
LIST OF FIGURES
- Market Volume, In Physical Terms, 2012–2023
- Market Value, 2012–2023
- Market Structure – Domestic Supply vs. Imports, In Physical Terms, 2012-2023
- Market Structure – Domestic Supply vs. Imports, In Value Terms, 2012-2023
- Trade Balance, In Physical Terms, 2012-2023
- Trade Balance, In Value Terms, 2012-2023
- Per Capita Consumption, 2012-2023
- Market Volume Forecast to 2030
- Market Value Forecast to 2030
- Products: Market Size And Growth, By Type
- Products: Average Per Capita Consumption, By Type
- Products: Exports And Growth, By Type
- Products: Export Prices And Growth, By Type
- Production Volume And Growth
- Yield And Growth
- Exports And Growth
- Export Prices And Growth
- Market Size And Growth
- Per Capita Consumption
- Imports And Growth
- Import Prices
- Production, In Physical Terms, 2012–2023
- Production, In Value Terms, 2012–2023
- Area Harvested, 2012–2023
- Yield, 2012–2023
- Imports, In Physical Terms, 2012–2023
- Imports, In Value Terms, 2012–2023
- Imports, In Physical Terms, By Country, 2023
- Imports, In Physical Terms, By Country, 2012–2023
- Imports, In Value Terms, By Country, 2012–2023
- Import Prices, By Country Of Origin, 2012–2023
- Exports, In Physical Terms, 2012–2023
- Exports, In Value Terms, 2012–2023
- Exports, In Physical Terms, By Country, 2023
- Exports, In Physical Terms, By Country, 2012–2023
- Exports, In Value Terms, By Country, 2012–2023
- Export Prices, By Country Of Destination, 2012–2023


