Spain - Fruits - Market Analysis, Forecast, Size, Trends and Insights
Get instant access to more than 2 million reports, dashboards, and datasets on the IndexBox Platform.
View PricingSpain's September 2023 Fruit Exports See Modest Drop to $522M
Spain Fruit Exports
In September 2023, shipments abroad of fruits decreased by -23.2% to 359K tons, falling for the third month in a row after two months of growth. Over the period under review, total exports indicated a slight increase from September 2022 to September 2023: its volume increased at an average monthly rate of +1.5% over the last twelve months. The trend pattern, however, indicated some noticeable fluctuations being recorded throughout the analyzed period. Based on September 2023 figures, exports decreased by -45.0% against June 2023 indices. The growth pace was the most rapid in November 2022 with an increase of 67% month-to-month.
In value terms, fruit exports fell notably to $522M (IndexBox estimates) in September 2023. Overall, total exports indicated a mild increase from September 2022 to September 2023: its value increased at an average monthly rate of +1.7% over the last twelve-month period. The trend pattern, however, indicated some noticeable fluctuations being recorded throughout the analyzed period. Based on September 2023 figures, exports decreased by -40.3% against June 2023 indices. The pace of growth appeared the most rapid in May 2023 when exports increased by 57% month-to-month.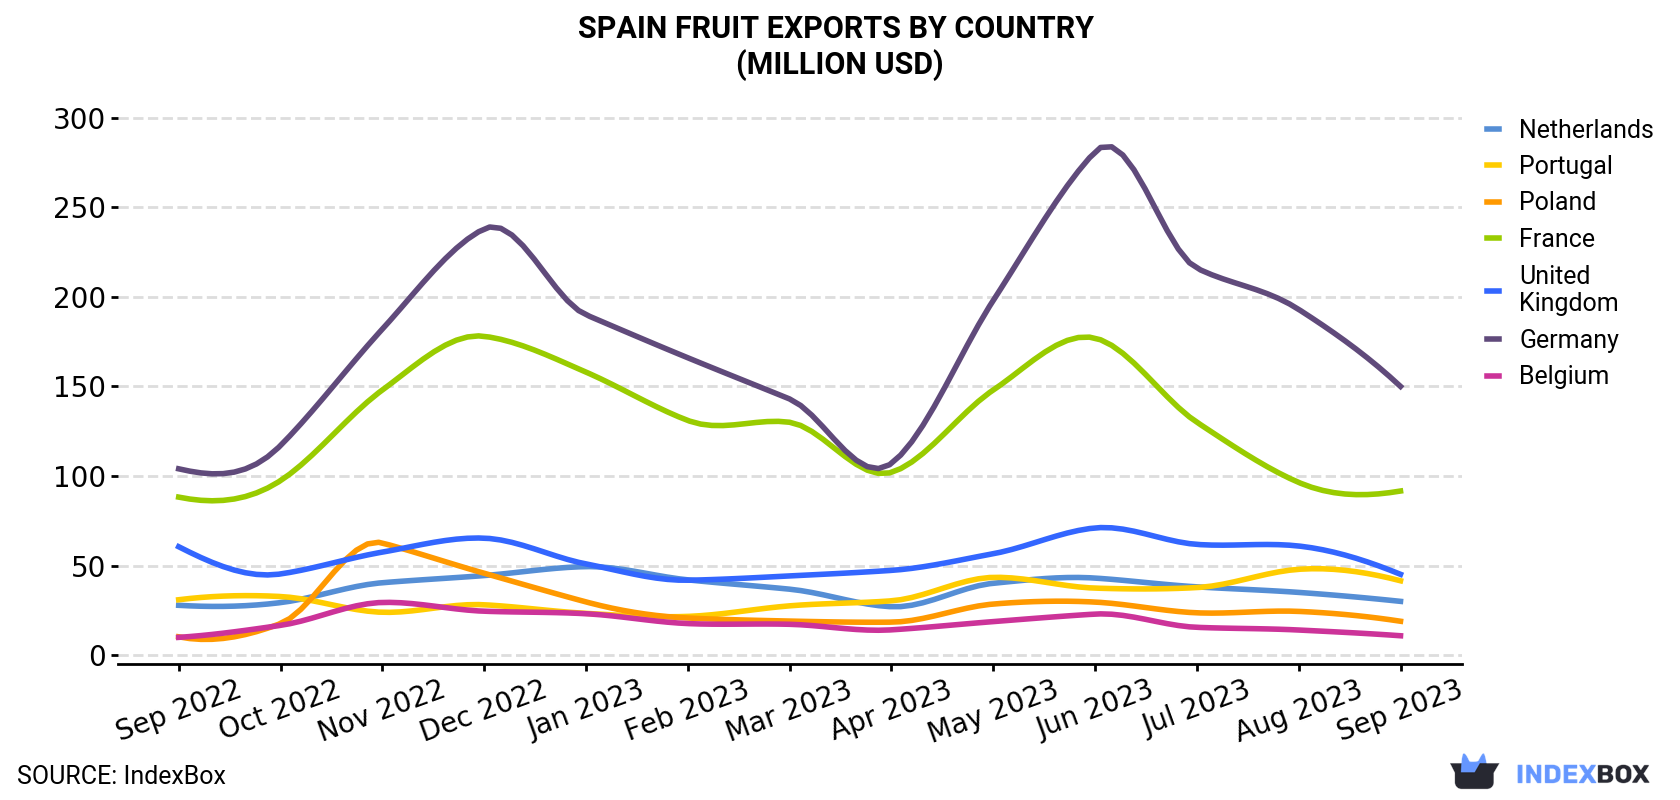
| COUNTRY | Export Value of Fruit in Spain (million USD) | ||||||||||||
|---|---|---|---|---|---|---|---|---|---|---|---|---|---|
| Sep 2022 | Oct 2022 | Nov 2022 | Dec 2022 | Jan 2023 | Feb 2023 | Mar 2023 | Apr 2023 | May 2023 | Jun 2023 | Jul 2023 | Aug 2023 | Sep 2023 | |
| Germany | 104 | 117 | 182 | 238 | 190 | 166 | 143 | 107 | 198 | 281 | 216 | 193 | 150 |
| France | 88.2 | 97.4 | 148 | 178 | 158 | 131 | 130 | 102 | 148 | 177 | 130 | 96.4 | 91.6 |
| United Kingdom | 60.5 | 45.3 | 57.5 | 65.3 | 50.9 | 41.8 | 44.2 | 47.3 | 56.6 | 71.0 | 61.8 | 60.9 | 45.1 |
| Portugal | 30.9 | 32.7 | 23.9 | 28.1 | 23.3 | 21.6 | 27.5 | 30.3 | 43.4 | 37.4 | 37.7 | 47.9 | 41.5 |
| Netherlands | 27.8 | 29.3 | 40.4 | 44.4 | 49.4 | 42.0 | 36.8 | 27.0 | 40.1 | 43.0 | 38.1 | 35.0 | 30.0 |
| Poland | 10.2 | 17.6 | 62.6 | 45.7 | 29.7 | 20.7 | 19.0 | 18.4 | 28.5 | 29.6 | 23.6 | 24.4 | 18.9 |
| Belgium | 9.9 | 16.6 | 29.4 | 24.5 | 23.1 | 17.6 | 17.2 | 14.1 | 18.7 | 22.9 | 15.5 | 14.0 | 10.8 |
| Others | 96.7 | 134 | 187 | 194 | 150 | 134 | 143 | 116 | 190 | 212 | 165 | 152 | 135 |
| Total | 429 | 489 | 731 | 817 | 674 | 575 | 560 | 462 | 724 | 874 | 688 | 624 | 522 |
Exports by Country
Germany (99K tons), France (67K tons) and Portugal (33K tons) were the main destinations of fruit exports from Spain, together accounting for 56% of total exports. The UK, the Netherlands, Poland and Belgium lagged somewhat behind, together accounting for a further 20%.
From September 2022 to September 2023, the most notable rate of growth in terms of shipments, amongst the main countries of destination, was attained by Poland (with a CAGR of +5.1%), while the other leaders experienced more modest paces of growth.
In value terms, Germany ($150M), France ($92M) and the UK ($45M) constituted the largest markets for fruit exported from Spain worldwide, with a combined 55% share of total exports. Portugal, the Netherlands, Poland and Belgium lagged somewhat behind, together comprising a further 19%.
Among the main countries of destination, Poland, with a CAGR of +5.3%, recorded the highest growth rate of the value of exports, over the period under review, while shipments for the other leaders experienced more modest paces of growth.
Exports by Type
Peaches and nectarines (93K tons), watermelons (56K tons) and melons (31K tons) were the main products of fruit exports from Spain, with a combined 50% share of total exports. Grapes, lemons and limes, pears and quinces, plums and sloes, tangerines, mandarins, clementines, satsumas, apples, oranges, bananas and plantains, avocados, mangoes, mangosteens and guavas, non-citrus fruits not elsewhere classified, persimmons, kiwi fruits, apricots, figs, pineapples, grapefruits, papayas, dates and citrus fruits not elsewhere classified lagged somewhat behind, together comprising a further 50%.
From September 2022 to September 2023, the most notable rate of growth in terms of shipments, amongst the major product types, was attained by watermelon (with a CAGR of +5.2%), while the other products experienced more modest paces of growth.
In value terms, the most traded types of fruits in Spain were peaches and nectarines ($133M), grapes ($67M) and lemons and limes ($47M), together accounting for 47% of total exports. These products were followed by watermelons, plums and sloes, avocados, pears and quinces, melons, mangoes, mangosteens and guavas, tangerines, mandarins, clementines, satsumas, oranges, apples, non-citrus fruits not elsewhere classified, bananas and plantains, kiwi fruits, persimmons, figs, apricots, pineapples, grapefruits, papayas, dates and citrus fruits not elsewhere classified, which together accounted for a further 53%.
Pears and quinces, with a CAGR of +5.2%, saw the highest rates of growth with regard to the value of exports, among the main product categories over the period under review, while shipments for the other products experienced more modest paces of growth.
Export Prices by Country
In September 2023, the fruit price stood at $1,453 per ton (FOB, Spain), increasing by 9% against the previous month. In general, the export price continues to indicate a relatively flat trend pattern. As a result, the export price reached the peak level and is likely to continue growth in the immediate term.
Prices varied noticeably by the country of destination: the country with the highest price was Belgium ($1,791 per ton), while the average price for exports to the Czech Republic ($1,123 per ton) was amongst the lowest.
From September 2022 to September 2023, the most notable rate of growth in terms of prices was recorded for supplies to Brazil (+2.2%), while the prices for the other major destinations experienced more modest paces of growth.
This report provides an in-depth analysis of the fruit market in Spain. Within it, you will discover the latest data on market trends and opportunities by country, consumption, production and price developments, as well as the global trade (imports and exports). The forecast exhibits the market prospects through 2030.
Product coverage:
- FCL 515 - Apples
- FCL 521 - Pears
- FCL 523 - Quinces
- FCL 526 - Apricots
- FCL 534 - Peaches and nectarines
- FCL 536 - Plums
- FCL 486 - Bananas
- FCL 489 - Plantains
- FCL 577 - Dates
- FCL 569 - Figs
- FCL 574 - Pineapples
- FCL 572 - Avocados
- FCL 571 - Mangoes
- FCL 490 - Oranges
- FCL 495 - Tangerines, mandarins, clementines, satsumas
- FCL 507 - Grapefruit and pomelo
- FCL 497 - Lemons and limes
- FCL 512 - Citrus fruit nes
- FCL 560 - Grapes
- FCL 567 - Watermelons
- FCL 568 - Melons, Cantaloupes
- FCL 600 - Papayas
Country coverage:
- Spain
Data coverage:
- Market volume and value
- Per Capita consumption
- Forecast of the market dynamics in the medium term
- Trade (exports and imports) in Spain
- Export and import prices
- Market trends, drivers and restraints
- Key market players and their profiles
Reasons to buy this report:
- Take advantage of the latest data
- Find deeper insights into current market developments
- Discover vital success factors affecting the market
This report is designed for manufacturers, distributors, importers, and wholesalers, as well as for investors, consultants and advisors.
In this report, you can find information that helps you to make informed decisions on the following issues:
- How to diversify your business and benefit from new market opportunities
- How to load your idle production capacity
- How to boost your sales on overseas markets
- How to increase your profit margins
- How to make your supply chain more sustainable
- How to reduce your production and supply chain costs
- How to outsource production to other countries
- How to prepare your business for global expansion
While doing this research, we combine the accumulated expertise of our analysts and the capabilities of artificial intelligence. The AI-based platform, developed by our data scientists, constitutes the key working tool for business analysts, empowering them to discover deep insights and ideas from the marketing data.
-
1. INTRODUCTION
Making Data-Driven Decisions to Grow Your Business
- REPORT DESCRIPTION
- RESEARCH METHODOLOGY AND AI PLATFORM
- DATA-DRIVEN DECISIONS FOR YOUR BUSINESS
- GLOSSARY AND SPECIFIC TERMS
-
2. EXECUTIVE SUMMARY
A Quick Overview of Market Performance
- KEY FINDINGS
- MARKET TRENDS This Chapter is Available Only for the Professional Edition PRO
-
3. MARKET OVERVIEW
Understanding the Current State of The Market and Its Prospects
- MARKET SIZE
- MARKET STRUCTURE
- TRADE BALANCE
- PER CAPITA CONSUMPTION
- MARKET FORECAST TO 2030
-
4. MOST PROMISING PRODUCT
Finding New Products to Diversify Your Business
This Chapter is Available Only for the Professional Edition PRO- TOP PRODUCTS TO DIVERSIFY YOUR BUSINESS
- BEST-SELLING PRODUCTS
- MOST CONSUMED PRODUCT
- MOST TRADED PRODUCT
- MOST PROFITABLE PRODUCT FOR EXPORT
-
5. MOST PROMISING SUPPLYING COUNTRIES
Choosing the Best Countries to Establish Your Sustainable Supply Chain
This Chapter is Available Only for the Professional Edition PRO- TOP COUNTRIES TO SOURCE YOUR PRODUCT
- TOP PRODUCING COUNTRIES
- COUNTRIES WITH TOP YIELDS
- TOP EXPORTING COUNTRIES
- LOW-COST EXPORTING COUNTRIES
-
6. MOST PROMISING OVERSEAS MARKETS
Choosing the Best Countries to Boost Your Exports
This Chapter is Available Only for the Professional Edition PRO- TOP OVERSEAS MARKETS FOR EXPORTING YOUR PRODUCT
- TOP CONSUMING MARKETS
- UNSATURATED MARKETS
- TOP IMPORTING MARKETS
- MOST PROFITABLE MARKETS
7. PRODUCTION
The Latest Trends and Insights into The Industry
- PRODUCTION, HARVESTED AREA AND YIELD
8. IMPORTS
The Largest Import Supplying Countries
- IMPORTS FROM 2012–2023
- IMPORTS BY COUNTRY
- IMPORT PRICES BY COUNTRY
9. EXPORTS
The Largest Destinations for Exports
- EXPORTS FROM 2012–2023
- EXPORTS BY COUNTRY
- EXPORT PRICES BY COUNTRY
-
10. PROFILES OF MAJOR PRODUCERS
The Largest Producers on The Market and Their Profiles
This Chapter is Available Only for the Professional Edition PRO -
LIST OF TABLES
- Key Findings In 2023
- Market Volume, In Physical Terms, 2012–2023
- Market Value, 2012–2023
- Per Capita Consumption In 2012-2023
- Imports, In Physical Terms, By Country, 2012–2023
- Imports, In Value Terms, By Country, 2012–2023
- Import Prices, By Country Of Origin, 2012–2023
- Exports, In Physical Terms, By Country, 2012–2023
- Exports, In Value Terms, By Country, 2012–2023
- Export Prices, By Country Of Destination, 2012–2023
-
LIST OF FIGURES
- Market Volume, In Physical Terms, 2012–2023
- Market Value, 2012–2023
- Market Structure – Domestic Supply vs. Imports, In Physical Terms, 2012-2023
- Market Structure – Domestic Supply vs. Imports, In Value Terms, 2012-2023
- Trade Balance, In Physical Terms, 2012-2023
- Trade Balance, In Value Terms, 2012-2023
- Per Capita Consumption, 2012-2023
- Market Volume Forecast to 2030
- Market Value Forecast to 2030
- Products: Market Size And Growth, By Type
- Products: Average Per Capita Consumption, By Type
- Products: Exports And Growth, By Type
- Products: Export Prices And Growth, By Type
- Production Volume And Growth
- Yield And Growth
- Exports And Growth
- Export Prices And Growth
- Market Size And Growth
- Per Capita Consumption
- Imports And Growth
- Import Prices
- Production, In Physical Terms, 2012–2023
- Production, In Value Terms, 2012–2023
- Area Harvested, 2012–2023
- Yield, 2012–2023
- Imports, In Physical Terms, 2012–2023
- Imports, In Value Terms, 2012–2023
- Imports, In Physical Terms, By Country, 2023
- Imports, In Physical Terms, By Country, 2012–2023
- Imports, In Value Terms, By Country, 2012–2023
- Import Prices, By Country Of Origin, 2012–2023
- Exports, In Physical Terms, 2012–2023
- Exports, In Value Terms, 2012–2023
- Exports, In Physical Terms, By Country, 2023
- Exports, In Physical Terms, By Country, 2012–2023
- Exports, In Value Terms, By Country, 2012–2023
- Export Prices, By Country Of Destination, 2012–2023


