World - Soya Beans - Market Analysis, Forecast, Size, Trends and Insights
Get instant access to more than 2 million reports, dashboards, and datasets on the IndexBox Platform.
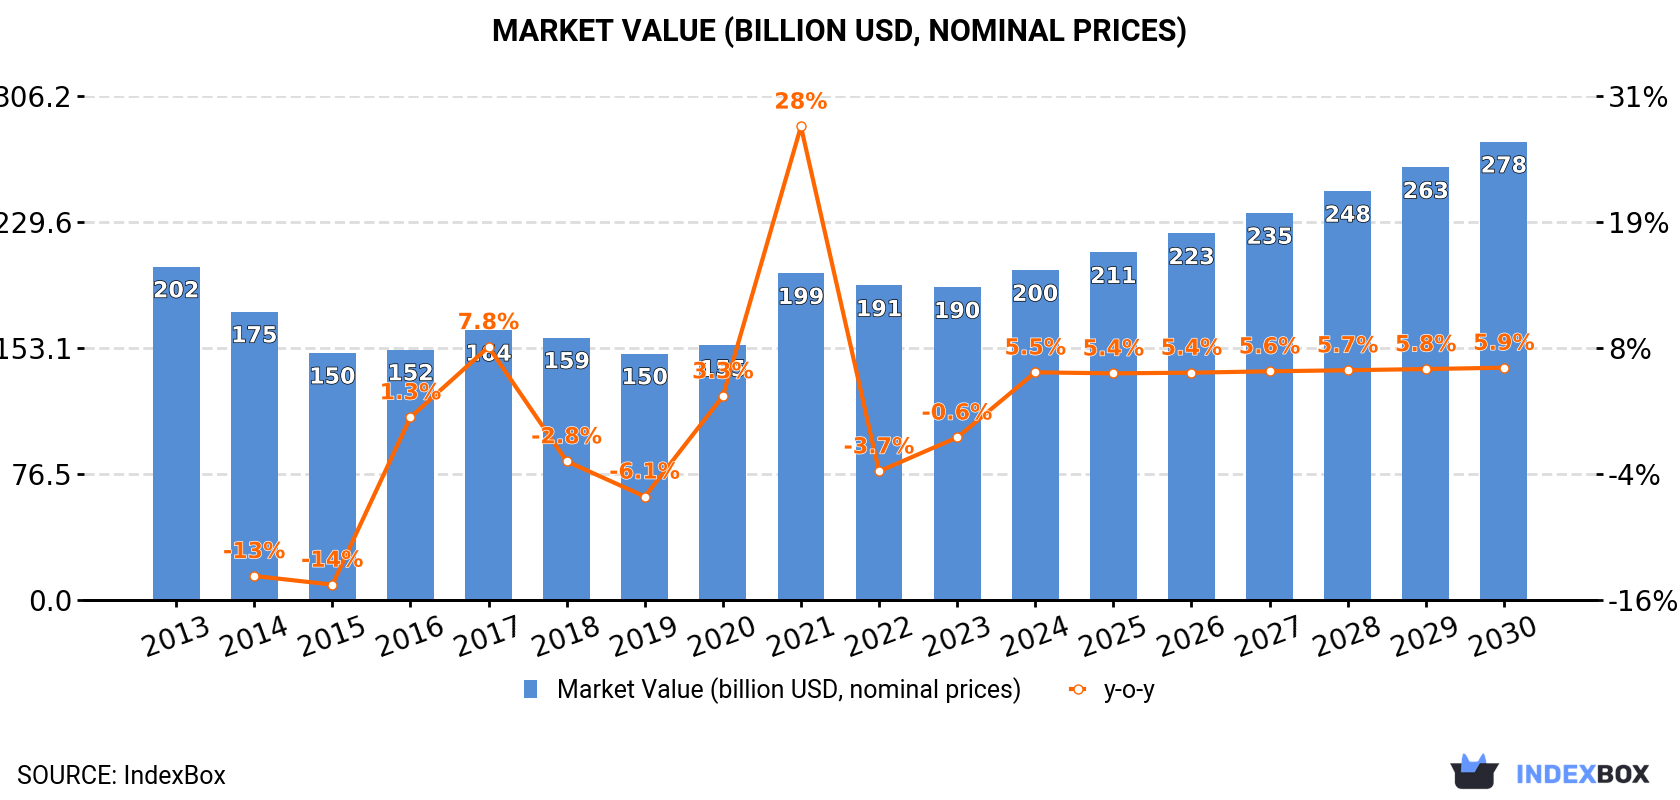
View PricingGlobal Soya Beans Market Expected to See Significant Growth with a CAGR of +3.5% to $278.3B by 2030
IndexBox has just published a new report: World - Soya Beans - Market Analysis, Forecast, Size, Trends and Insights.
The global market for soya beans is experiencing increasing demand, with consumption volumes on the rise. By 2030, the market is expected to reach 451M tons with a value of $278.3B. China, the United States, and Argentina are the top consuming countries, while Brazil dominates production. Import and export prices are fluctuating, but overall, the market is forecasted to continue growing in the coming years.
Market Forecast
Market Forecast
Driven by increasing demand for soya beans worldwide, the market is expected to continue an upward consumption trend over the next seven years. Market performance is forecast to accelerate, expanding with an anticipated CAGR of +3.5% for the period from 2023 to 2030, which is projected to bring the market volume to 451M tons by the end of 2030.
In value terms, the market is forecast to increase with an anticipated CAGR of +5.6% for the period from 2023 to 2030, which is projected to bring the market value to $278.3B (in nominal prices) by the end of 2030.
Consumption
Consumption
Global soya bean consumption expanded slightly to 355M tons in 2023, increasing by 2.7% against the previous year. The total consumption volume increased at an average annual rate of +1.3% over the period from 2013 to 2023; the trend pattern remained consistent, with somewhat noticeable fluctuations being recorded in certain years. Global consumption peaked at 374M tons in 2021; however, from 2022 to 2023, consumption failed to regain momentum.
The global soya bean market revenue shrank slightly to $190B in 2023, remaining stable against the previous year. This figure reflects the total revenues of producers and importers (excluding logistics costs, retail marketing costs, and retailers' margins, which will be included in the final consumer price). In general, consumption, however, showed a relatively flat trend pattern. Over the period under review, the global market attained the peak level at $202.5B in 2013; however, from 2014 to 2023, consumption failed to regain momentum.
Consumption By Country
The countries with the highest volumes of consumption in 2023 were China (118M tons), the United States (71M tons) and Argentina (54M tons), with a combined 68% share of global consumption. Brazil, India and Russia lagged somewhat behind, together comprising a further 13%.
From 2013 to 2023, the most notable rate of growth in terms of consumption, amongst the key consuming countries, was attained by Russia (with a CAGR of +7.8%), while consumption for the other global leaders experienced more modest paces of growth.
In value terms, the largest soya bean markets worldwide were China ($66.9B), the United States ($34.1B) and Argentina ($25.2B), with a combined 66% share of the global market. Brazil, India and Russia lagged somewhat behind, together accounting for a further 13%.
Russia, with a CAGR of +7.6%, recorded the highest rates of growth with regard to market size among the main consuming countries over the period under review, while market for the other global leaders experienced more modest paces of growth.
In 2023, the highest levels of soya bean per capita consumption was registered in Argentina (1,150 kg per person), followed by the United States (210 kg per person), Brazil (120 kg per person) and China (83 kg per person), while the world average per capita consumption of soya bean was estimated at 45 kg per person.
From 2013 to 2023, the average annual rate of growth in terms of the soya bean per capita consumption in Argentina amounted to +1.6%. The remaining consuming countries recorded the following average annual rates of per capita consumption growth: the United States (+2.2% per year) and Brazil (-10.3% per year).
Production
Production
In 2023, the amount of soya beans produced worldwide stood at 365M tons, increasing by 3.7% compared with 2022 figures. The total output volume increased at an average annual rate of +2.6% from 2013 to 2023; the trend pattern remained relatively stable, with only minor fluctuations throughout the analyzed period. The growth pace was the most rapid in 2014 when the production volume increased by 9.9%. Over the period under review, global production attained the peak volume at 376M tons in 2021; however, from 2022 to 2023, production remained at a lower figure. The general positive trend in terms output was largely conditioned by measured growth of the harvested area and a relatively flat trend pattern in yield figures.
In value terms, soya bean production reached $187.8B in 2023 estimated in export price. Overall, production, however, continues to indicate a pronounced contraction. The most prominent rate of growth was recorded in 2021 when the production volume increased by 36%. Global production peaked at $294.6B in 2013; however, from 2014 to 2023, production remained at a lower figure.
Production By Country
The countries with the highest volumes of production in 2023 were Brazil (128M tons), the United States (119M tons) and Argentina (45M tons), together accounting for 80% of global production.
From 2013 to 2023, the most notable rate of growth in terms of production, amongst the main producing countries, was attained by Brazil (with a CAGR of +4.6%), while production for the other global leaders experienced more modest paces of growth.
Yield
The global average soya bean yield rose rapidly to 2.8 tons per ha in 2023, picking up by 5% compared with 2022 figures. Overall, the yield recorded a relatively flat trend pattern. Over the period under review, the average soya bean yield hit record highs at 2.9 tons per ha in 2021; however, from 2022 to 2023, the yield remained at a lower figure.
Harvested Area
The global soya bean harvested area fell to 132M ha in 2023, remaining relatively unchanged against the previous year. The harvested area increased at an average annual rate of +1.7% over the period from 2013 to 2023; the trend pattern remained relatively stable, with somewhat noticeable fluctuations in certain years. The most prominent rate of growth was recorded in 2014 with an increase of 6%. Over the period under review, the harvested area dedicated to soya bean production attained the maximum at 134M ha in 2022, and then contracted in the following year.
Imports
Imports
In 2023, after two years of decline, there was significant growth in purchases abroad of soya beans, when their volume increased by 8.5% to 163M tons. The total import volume increased at an average annual rate of +4.5% from 2013 to 2023; however, the trend pattern indicated some noticeable fluctuations being recorded in certain years. The pace of growth appeared the most rapid in 2017 when imports increased by 19%. Over the period under review, global imports attained the maximum at 164M tons in 2020; however, from 2021 to 2023, imports failed to regain momentum.
In value terms, soya bean imports declined slightly to $99.8B in 2023. Overall, total imports indicated moderate growth from 2013 to 2023: its value increased at an average annual rate of +4.7% over the last decade. The trend pattern, however, indicated some noticeable fluctuations being recorded throughout the analyzed period. Based on 2023 figures, imports increased by +64.4% against 2019 indices. The pace of growth was the most pronounced in 2021 with an increase of 34%. Over the period under review, global imports reached the peak figure at $102.3B in 2022, and then contracted slightly in the following year.
Imports By Country
China dominates imports structure, amounting to 99M tons, which was approx. 61% of total imports in 2023. It was distantly followed by Argentina (10M tons), mixing up a 6.4% share of total imports. The following importers - the Netherlands (3.7M tons), Spain (3.5M tons), Japan (3.3M tons), Germany (3.3M tons), Thailand (3.3M tons), Turkey (2.9M tons) and Taiwan (Chinese) (2.7M tons) - each reached a 14% share of total imports.
Imports into China increased at an average annual rate of +4.6% from 2013 to 2023. At the same time, Argentina (+146.8%), Turkey (+10.1%), Thailand (+6.9%), Taiwan (Chinese) (+2.2%) and Japan (+1.8%) displayed positive paces of growth. Moreover, Argentina emerged as the fastest-growing importer imported in the world, with a CAGR of +146.8% from 2013-2023. The Netherlands and Spain experienced a relatively flat trend pattern. By contrast, Germany (-1.0%) illustrated a downward trend over the same period. From 2013 to 2023, the share of Argentina increased by +6.4 percentage points, while the shares of the other countries remained relatively stable throughout the analyzed period.
In value terms, China ($59.7B) constitutes the largest market for imported soya beans worldwide, comprising 60% of global imports. The second position in the ranking was taken by Argentina ($5.6B), with a 5.6% share of global imports. It was followed by Japan, with a 2.4% share.
In China, soya bean imports increased at an average annual rate of +4.6% over the period from 2013-2023. In the other countries, the average annual rates were as follows: Argentina (+121.5% per year) and Japan (+2.3% per year).
Import Prices By Country
In 2023, the average soya bean import price amounted to $612 per ton, reducing by -10.1% against the previous year. Overall, the import price, however, continues to indicate a relatively flat trend pattern. The most prominent rate of growth was recorded in 2021 when the average import price increased by 38% against the previous year. Global import price peaked at $681 per ton in 2022, and then fell in the following year.
Average prices varied somewhat amongst the major importing countries. In 2023, major importing countries recorded the following prices: in Japan ($713 per ton) and Germany ($635 per ton), while Argentina ($542 per ton) and Taiwan (Chinese) ($557 per ton) were amongst the lowest.
From 2013 to 2023, the most notable rate of growth in terms of prices was attained by Germany (+0.9%), while the other global leaders experienced more modest paces of growth.
Exports
Exports
In 2023, overseas shipments of soya beans increased by 10% to 174M tons for the first time since 2020, thus ending a two-year declining trend. Overall, total exports indicated strong growth from 2013 to 2023: its volume increased at an average annual rate of +8.9% over the last decade. The trend pattern, however, indicated some noticeable fluctuations being recorded throughout the analyzed period. The pace of growth was the most pronounced in 2014 with an increase of 47% against the previous year. Over the period under review, the global exports attained the peak figure in 2023 and are likely to see gradual growth in years to come.
In value terms, soya bean exports shrank modestly to $93.7B in 2023. Over the period under review, total exports indicated a remarkable increase from 2013 to 2023: its value increased at an average annual rate of +5.0% over the last decade. The trend pattern, however, indicated some noticeable fluctuations being recorded throughout the analyzed period. Based on 2023 figures, exports increased by +69.3% against 2019 indices. The most prominent rate of growth was recorded in 2021 with an increase of 21% against the previous year. Over the period under review, the global exports attained the peak figure at $94.1B in 2022, and then fell in the following year.
Exports By Country
In 2023, Brazil (102M tons) represented the largest exporter of soya beans, generating 59% of total exports. It was distantly followed by the United States (49M tons), constituting a 28% share of total exports. Paraguay (6.5M tons), Canada (4.5M tons) and Ukraine (3.5M tons) took a little share of total exports.
Brazil was also the fastest-growing in terms of the soya beans exports, with a CAGR of +25.5% from 2013 to 2023. At the same time, Ukraine (+8.9%), Paraguay (+2.5%), Canada (+2.4%) and the United States (+2.1%) displayed positive paces of growth. From 2013 to 2023, the share of Brazil increased by +44 percentage points. The shares of the other countries remained relatively stable throughout the analyzed period.
In value terms, Brazil ($53.2B), the United States ($28B) and Paraguay ($3.4B) were the countries with the highest levels of exports in 2023, together comprising 90% of global exports.
Brazil, with a CAGR of +8.8%, saw the highest growth rate of the value of exports, in terms of the main exporting countries over the period under review, while shipments for the other global leaders experienced more modest paces of growth.
Export Prices By Country
The average soya bean export price stood at $539 per ton in 2023, declining by -9.8% against the previous year. In general, the export price showed a noticeable slump. The pace of growth was the most pronounced in 2021 when the average export price increased by 30% against the previous year. Over the period under review, the average export prices attained the peak figure at $774 per ton in 2013; however, from 2014 to 2023, the export prices remained at a lower figure.
There were significant differences in the average prices amongst the major exporting countries. In 2023, amid the top suppliers, the country with the highest price was Canada ($589 per ton), while Ukraine ($367 per ton) was amongst the lowest.
From 2013 to 2023, the most notable rate of growth in terms of prices was attained by Paraguay (+0.6%), while the other global leaders experienced more modest paces of growth.
This report provides an in-depth analysis of the global soya bean market. Within it, you will discover the latest data on market trends and opportunities by country, consumption, production and price developments, as well as the global trade (imports and exports). The forecast exhibits the market prospects through 2030.
Product coverage:
- FCL 236 - Soybeans
Country coverage:
Worldwide - the report contains statistical data for 200 countries and includes detailed profiles of the 50 largest consuming countries:
- USA
- China
- Japan
- Germany
- United Kingdom
- France
- Brazil
- Italy
- Russian Federation
- India
- Canada
- Australia
- Republic of Korea
- Spain
- Mexico
- Indonesia
- Netherlands
- Turkey
- Saudi Arabia
- Switzerland
- Sweden
- Nigeria
- Poland
- Belgium
- Argentina
- Norway
- Austria
- Thailand
- United Arab Emirates
- Colombia
- Denmark
- South Africa
- Malaysia
- Israel
- Singapore
- Egypt
- Philippines
- Finland
- Chile
- Ireland
- Pakistan
- Greece
- Portugal
- Kazakhstan
- Algeria
- Czech Republic
- Qatar
- Peru
- Romania
- Vietnam
+ the largest producing countries
Data coverage:
- Global market volume and value
- Per Capita consumption
- Forecast of the market dynamics in the medium term
- Global production, split by region and country
- Global trade (exports and imports)
- Export and import prices
- Market trends, drivers and restraints
- Key market players and their profiles
Company coverage:
Reasons to buy this report:
- Take advantage of the latest data
- Find deeper insights into current market developments
- Discover vital success factors affecting the market
This report is designed for manufacturers, distributors, importers, and wholesalers, as well as for investors, consultants and advisors.
In this report, you can find information that helps you to make informed decisions on the following issues:
- How to diversify your business and benefit from new market opportunities
- How to load your idle production capacity
- How to boost your sales on overseas markets
- How to increase your profit margins
- How to make your supply chain more sustainable
- How to reduce your production and supply chain costs
- How to outsource production to other countries
- How to prepare your business for global expansion
While doing this research, we combine the accumulated expertise of our analysts and the capabilities of artificial intelligence. The AI-based platform, developed by our data scientists, constitutes the key working tool for business analysts, empowering them to discover deep insights and ideas from the marketing data.
-
1. INTRODUCTION
Making Data-Driven Decisions to Grow Your Business
- REPORT DESCRIPTION
- RESEARCH METHODOLOGY AND AI PLATFORM
- DATA-DRIVEN DECISIONS FOR YOUR BUSINESS
- GLOSSARY AND SPECIFIC TERMS
-
2. EXECUTIVE SUMMARY
A Quick Overview of Market Performance
- KEY FINDINGS
- MARKET TRENDS This Chapter is Available Only for the Professional Edition PRO
-
3. MARKET OVERVIEW
Understanding the Current State of The Market and Its Prospects
- MARKET SIZE
- CONSUMPTION BY COUNTRY
- MARKET FORECAST TO 2030
-
4. MOST PROMISING PRODUCT
Finding New Products to Diversify Your Business
This Chapter is Available Only for the Professional Edition PRO- TOP PRODUCTS TO DIVERSIFY YOUR BUSINESS
- BEST-SELLING PRODUCTS
- MOST CONSUMED PRODUCT
- MOST TRADED PRODUCT
- MOST PROFITABLE PRODUCT FOR EXPORT
-
5. MOST PROMISING SUPPLYING COUNTRIES
Choosing the Best Countries to Establish Your Sustainable Supply Chain
This Chapter is Available Only for the Professional Edition PRO- TOP COUNTRIES TO SOURCE YOUR PRODUCT
- TOP PRODUCING COUNTRIES
- COUNTRIES WITH TOP YIELDS
- TOP EXPORTING COUNTRIES
- LOW-COST EXPORTING COUNTRIES
-
6. MOST PROMISING OVERSEAS MARKETS
Choosing the Best Countries to Boost Your Exports
This Chapter is Available Only for the Professional Edition PRO- TOP OVERSEAS MARKETS FOR EXPORTING YOUR PRODUCT
- TOP CONSUMING MARKETS
- UNSATURATED MARKETS
- TOP IMPORTING MARKETS
- MOST PROFITABLE MARKETS
7. GLOBAL PRODUCTION
The Latest Trends and Insights into The Industry
- PRODUCTION VOLUME AND VALUE
- PRODUCTION BY COUNTRY
- HARVESTED AREA AND YIELD BY COUNTRY
8. GLOBAL IMPORTS
The Largest Importers on The Market and How They Succeed
- IMPORTS FROM 2012–2023
- IMPORTS BY COUNTRY
- IMPORT PRICES BY COUNTRY
9. GLOBAL EXPORTS
The Largest Exporters on The Market and How They Succeed
- EXPORTS FROM 2012–2023
- EXPORTS BY COUNTRY
- EXPORT PRICES BY COUNTRY
-
10. PROFILES OF MAJOR PRODUCERS
The Largest Producers on The Market and Their Profiles
This Chapter is Available Only for the Professional Edition PRO -
11. COUNTRY PROFILES
The Largest Markets And Their Profiles
This Chapter is Available Only for the Professional Edition PRO- United States
- China
- Japan
- Germany
- United Kingdom
- France
- Brazil
- Italy
- Russian Federation
- India
- Canada
- Australia
- Republic of Korea
- Spain
- Mexico
- Indonesia
- Netherlands
- Turkey
- Saudi Arabia
- Switzerland
- Sweden
- Nigeria
- Poland
- Belgium
- Argentina
- Norway
- Austria
- Thailand
- United Arab Emirates
- Colombia
- Denmark
- South Africa
- Malaysia
- Israel
- Singapore
- Egypt
- Philippines
- Finland
- Chile
- Ireland
- Pakistan
- Greece
- Portugal
- Kazakhstan
- Algeria
- Czech Republic
- Qatar
- Peru
- Romania
- Vietnam
-
LIST OF TABLES
- Key Findings In 2023
- Market Volume, In Physical Terms, 2012–2023
- Market Value, 2012–2023
- Per Capita Consumption, By Country, 2018–2023
- Production, In Physical Terms, By Country, 2012–2023
- Harvested Area, By Country, 2012-2023
- Yield, By Country, 2012-2023
- Imports, In Physical Terms, By Country, 2012–2023
- Imports, In Value Terms, By Country, 2012–2023
- Import Prices, By Country Of Destination, 2012–2023
- Exports, In Physical Terms, By Country, 2012–2023
- Exports, In Value Terms, By Country, 2012–2023
- Export Prices, By Country Of Origin, 2012–2023
-
LIST OF FIGURES
- Market Volume, In Physical Terms, 2012–2023
- Market Value, 2012–2023
- Consumption, By Country, 2023
- Market Volume Forecast to 2030
- Market Value Forecast to 2030
- Products: Market Size And Growth, By Type
- Products: Average Per Capita Consumption, By Type
- Products: Exports And Growth, By Type
- Products: Export Prices And Growth, By Type
- Production Volume And Growth
- Yield And Growth
- Exports And Growth
- Export Prices And Growth
- Market Size And Growth
- Per Capita Consumption
- Imports And Growth
- Import Prices
- Production, In Physical Terms, 2012–2023
- Production, In Value Terms, 2012–2023
- Area Harvested, 2012–2023
- Yield, 2012–2023
- Production, By Country, 2023
- Production, In Physical Terms, By Country, 2012–2023
- Harvested Area, By Country, 2023
- Harvested Area, By Country, 2012-2023
- Yield, By Country, 2012-2023
- Imports, In Physical Terms, 2012–2023
- Imports, In Value Terms, 2012–2023
- Imports, In Physical Terms, By Country, 2023
- Imports, In Physical Terms, By Country, 2012–2023
- Imports, In Value Terms, By Country, 2012–2023
- Import Prices, By Country, 2012–2023
- Exports, In Physical Terms, 2012–2023
- Exports, In Value Terms, 2012–2023
- Exports, In Physical Terms, By Country, 2023
- Exports, In Physical Terms, By Country, 2012–2023
- Exports, In Value Terms, By Country, 2012–2023
- Export Prices, 2012–2023


