
South Africa - Plastic Baths, Wash-Basins, Lavatory Pans And Covers And Similar Sanitary Ware - Market Analysis, Forecast, Size, Trends and Insights
Get instant access to more than 2 million reports, dashboards, and datasets on the IndexBox Platform.
View PricingSouth Africa's Plastic Bathroom Fixture Exports Plummet to $1.4M in July 2023
South Africa Plastic Sanitary Ware Exports
In July 2023, shipments abroad of plastic baths, wash-basins, lavatory pans and covers and similar sanitary ware increased by 31% to 189K units, rising for the third month in a row after two months of decline. In general, exports recorded a modest increase. The pace of growth appeared the most rapid in February 2023 with an increase of 92% month-to-month. Over the period under review, the exports hit record highs in July 2023.
In value terms, plastic sanitary ware exports shrank markedly to $1.4M (IndexBox estimates) in July 2023. Over the period under review, exports, however, showed a noticeable setback. The pace of growth was the most pronounced in February 2023 when exports increased by 93% m-o-m. Over the period under review, the exports attained the peak figure at 2.4M units in June 2023, and then contracted rapidly in the following month.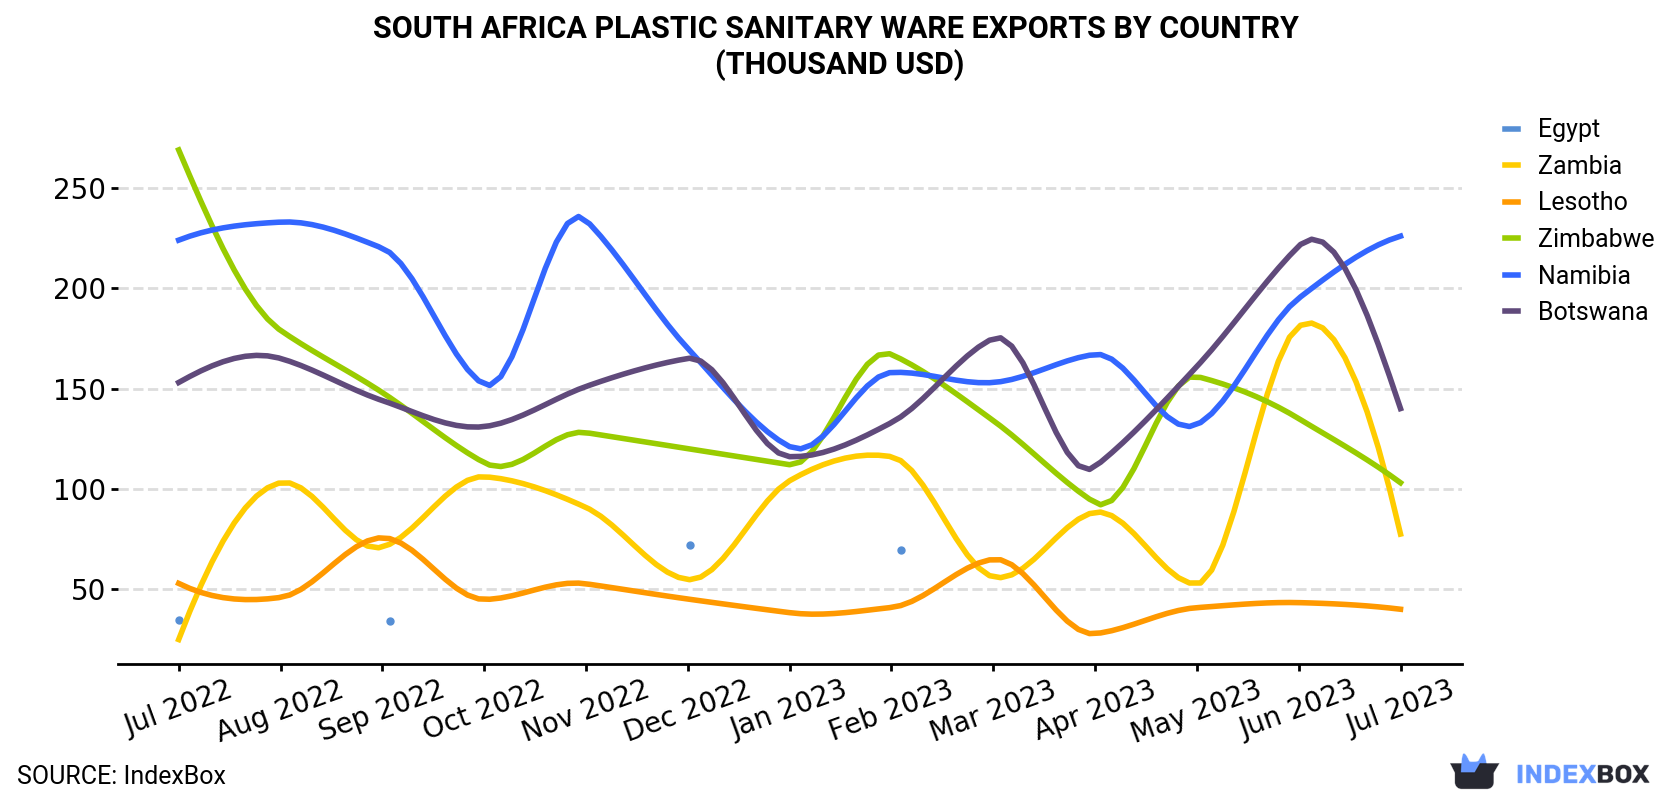
| COUNTRY | Export Value of Plastic Sanitary Ware in South Africa (thousand USD) | ||||||||||||
|---|---|---|---|---|---|---|---|---|---|---|---|---|---|
| Jul 2022 | Aug 2022 | Sep 2022 | Oct 2022 | Nov 2022 | Dec 2022 | Jan 2023 | Feb 2023 | Mar 2023 | Apr 2023 | May 2023 | Jun 2023 | Jul 2023 | |
| Namibia | 224 | 233 | 220 | 152 | 234 | 170 | 121 | 158 | 153 | 167 | 132 | 195 | 226 |
| Botswana | 153 | 165 | 144 | 131 | 151 | 165 | 116 | 133 | 175 | 111 | 161 | 221 | 140 |
| Zimbabwe | 269 | 179 | 148 | 113 | 128 | 120 | 112 | 167 | 134 | 93.0 | 156 | 135 | 103 |
| Zambia | 24.8 | 103 | 70.9 | 106 | 90.7 | 54.7 | 104 | 116 | 56.0 | 88.3 | 52.5 | 181 | 77.4 |
| Lesotho | 52.8 | 45.8 | 75.6 | 44.8 | 52.6 | 45.0 | 38.2 | 40.8 | 64.8 | 27.7 | 40.7 | 43.2 | 39.9 |
| Egypt | 34.6 | N/A | 34.0 | N/A | N/A | 72.1 | N/A | 69.4 | N/A | N/A | N/A | N/A | N/A |
| Others | 1,681 | 1,119 | 1,584 | 1,014 | 1,352 | 1,379 | 417 | 1,066 | 1,416 | 1,400 | 1,192 | 1,671 | 837 |
| Total | 2,439 | 1,845 | 2,277 | 1,562 | 2,008 | 2,006 | 907 | 1,752 | 1,998 | 1,888 | 1,735 | 2,447 | 1,424 |
Exports by Country
Botswana (67K units), Namibia (37K units) and Zimbabwe (22K units) were the main destinations of plastic sanitary ware exports from South Africa, together accounting for 67% of total exports.
From July 2022 to July 2023, the biggest increases were in Botswana (with a CAGR of +10.7%), while shipments for the other leaders experienced more modest paces of growth.
In value terms, Namibia ($226K), Botswana ($140K) and Zimbabwe ($103K) appeared to be the largest markets for plastic sanitary ware exported from South Africa worldwide, together accounting for 33% of total exports. These countries were followed by Zambia and Lesotho, which together accounted for a further 8.2%.
Zambia, with a CAGR of +9.9%, saw the highest rates of growth with regard to the value of exports, in terms of the main countries of destination over the period under review, while shipments for the other leaders experienced mixed trend patterns.
Exports by Type
Plastics bidets, lavatory pans and flushing cisterns (120K units) was the largest type of plastic sanitary ware exported from South Africa, with a 63% share of total exports. Moreover, plastics bidets, lavatory pans and flushing cisterns exceeded the volume of the second product type, plastic lavatory seats and covers (56K units), twofold.
From July 2022 to July 2023, the average monthly rate of growth in terms of the volume of export of plastics bidets, lavatory pans and flushing cisterns amounted to +5.7%. With regard to the other exported products, the following average monthly rates of growth were recorded: plastic lavatory seats and covers (-1.3% per month) and plastic baths, shower-baths, sinks and wash-basins (-5.6% per month).
In value terms, plastic baths, shower-baths, sinks and wash-basins ($932K) remains the largest type of plastic sanitary ware exported from South Africa, comprising 65% of total exports. The second position in the ranking was taken by plastics bidets, lavatory pans and flushing cisterns ($378K), with a 27% share of total exports.
From July 2022 to July 2023, the average monthly rate of growth in terms of the export volume of plastic baths, shower-baths, sinks and wash-basins totaled -5.4%. With regard to the other exported products, the following average monthly rates of growth were recorded: plastics bidets, lavatory pans and flushing cisterns (-1.6% per month) and plastic lavatory seats and covers (-3.0% per month).
Export Prices by Country
In July 2023, the plastic sanitary ware price amounted to $7.5 per unit (FOB, South Africa), declining by -55.8% against the previous month. Over the period under review, the export price recorded a abrupt contraction. The growth pace was the most rapid in March 2023 an increase of 55% against the previous month. The export price peaked at $24.1 per unit in April 2023; however, from May 2023 to July 2023, the export prices remained at a lower figure.
There were significant differences in the average prices for the major export markets. In July 2023, the country with the highest price was Zambia ($8.2 per unit), while the average price for exports to Botswana ($2.1 per unit) was amongst the lowest.
From July 2022 to July 2023, the most notable rate of growth in terms of prices was recorded for supplies to Swaziland (+9.8%), while the prices for the other major destinations experienced more modest paces of growth.
This report provides an in-depth analysis of the plastic sanitary ware market in South Africa. Within it, you will discover the latest data on market trends and opportunities by country, consumption, production and price developments, as well as the global trade (imports and exports). The forecast exhibits the market prospects through 2030.
Product coverage:
- Prodcom 22231250 - Plastic baths, shower-baths, sinks and wash-basins
- Prodcom 22231270 - Plastic lavatory seats and covers
- Prodcom 22231290 - Plastic bidets, lavatory pans, flushing cisterns and similar sanitary ware (excluding baths, showers-baths, sinks and wash-basins, lavatory seats and covers)
Country coverage:
- South Africa
Data coverage:
- Market volume and value
- Per Capita consumption
- Forecast of the market dynamics in the medium term
- Trade (exports and imports) in South Africa
- Export and import prices
- Market trends, drivers and restraints
- Key market players and their profiles
Reasons to buy this report:
- Take advantage of the latest data
- Find deeper insights into current market developments
- Discover vital success factors affecting the market
This report is designed for manufacturers, distributors, importers, and wholesalers, as well as for investors, consultants and advisors.
In this report, you can find information that helps you to make informed decisions on the following issues:
- How to diversify your business and benefit from new market opportunities
- How to load your idle production capacity
- How to boost your sales on overseas markets
- How to increase your profit margins
- How to make your supply chain more sustainable
- How to reduce your production and supply chain costs
- How to outsource production to other countries
- How to prepare your business for global expansion
While doing this research, we combine the accumulated expertise of our analysts and the capabilities of artificial intelligence. The AI-based platform, developed by our data scientists, constitutes the key working tool for business analysts, empowering them to discover deep insights and ideas from the marketing data.
-
1. INTRODUCTION
Making Data-Driven Decisions to Grow Your Business
- REPORT DESCRIPTION
- RESEARCH METHODOLOGY AND AI PLATFORM
- DATA-DRIVEN DECISIONS FOR YOUR BUSINESS
- GLOSSARY AND SPECIFIC TERMS
-
2. EXECUTIVE SUMMARY
A Quick Overview of Market Performance
- KEY FINDINGS
- MARKET TRENDS This Chapter is Available Only for the Professional Edition PRO
-
3. MARKET OVERVIEW
Understanding the Current State of The Market and Its Prospects
- MARKET SIZE
- MARKET STRUCTURE
- TRADE BALANCE
- PER CAPITA CONSUMPTION
- MARKET FORECAST TO 2030
-
4. MOST PROMISING PRODUCT
Finding New Products to Diversify Your Business
This Chapter is Available Only for the Professional Edition PRO- TOP PRODUCTS TO DIVERSIFY YOUR BUSINESS
- BEST-SELLING PRODUCTS
- MOST CONSUMED PRODUCT
- MOST TRADED PRODUCT
- MOST PROFITABLE PRODUCT FOR EXPORT
-
5. MOST PROMISING SUPPLYING COUNTRIES
Choosing the Best Countries to Establish Your Sustainable Supply Chain
This Chapter is Available Only for the Professional Edition PRO- TOP COUNTRIES TO SOURCE YOUR PRODUCT
- TOP PRODUCING COUNTRIES
- TOP EXPORTING COUNTRIES
- LOW-COST EXPORTING COUNTRIES
-
6. MOST PROMISING OVERSEAS MARKETS
Choosing the Best Countries to Boost Your Exports
This Chapter is Available Only for the Professional Edition PRO- TOP OVERSEAS MARKETS FOR EXPORTING YOUR PRODUCT
- TOP CONSUMING MARKETS
- UNSATURATED MARKETS
- TOP IMPORTING MARKETS
- MOST PROFITABLE MARKETS
7. PRODUCTION
The Latest Trends and Insights into The Industry
- PRODUCTION VOLUME AND VALUE
8. IMPORTS
The Largest Import Supplying Countries
- IMPORTS FROM 2012–2023
- IMPORTS BY COUNTRY
- IMPORT PRICES BY COUNTRY
9. EXPORTS
The Largest Destinations for Exports
- EXPORTS FROM 2012–2023
- EXPORTS BY COUNTRY
- EXPORT PRICES BY COUNTRY
-
10. PROFILES OF MAJOR PRODUCERS
The Largest Producers on The Market and Their Profiles
This Chapter is Available Only for the Professional Edition PRO -
LIST OF TABLES
- Key Findings In 2023
- Market Volume, In Physical Terms, 2012–2023
- Market Value, 2012–2023
- Per Capita Consumption In 2012-2023
- Imports, In Physical Terms, By Country, 2012–2023
- Imports, In Value Terms, By Country, 2012–2023
- Import Prices, By Country Of Origin, 2012–2023
- Exports, In Physical Terms, By Country, 2012–2023
- Exports, In Value Terms, By Country, 2012–2023
- Export Prices, By Country Of Destination, 2012–2023
-
LIST OF FIGURES
- Market Volume, In Physical Terms, 2012–2023
- Market Value, 2012–2023
- Market Structure – Domestic Supply vs. Imports, In Physical Terms, 2012-2023
- Market Structure – Domestic Supply vs. Imports, In Value Terms, 2012-2023
- Trade Balance, In Physical Terms, 2012-2023
- Trade Balance, In Value Terms, 2012-2023
- Per Capita Consumption, 2012-2023
- Market Volume Forecast to 2030
- Market Value Forecast to 2030
- Products: Market Size And Growth, By Type
- Products: Average Per Capita Consumption, By Type
- Products: Exports And Growth, By Type
- Products: Export Prices And Growth, By Type
- Production Volume And Growth
- Exports And Growth
- Export Prices And Growth
- Market Size And Growth
- Per Capita Consumption
- Imports And Growth
- Import Prices
- Production, In Physical Terms, 2012–2023
- Production, In Value Terms, 2012–2023
- Imports, In Physical Terms, 2012–2023
- Imports, In Value Terms, 2012–2023
- Imports, In Physical Terms, By Country, 2023
- Imports, In Physical Terms, By Country, 2012–2023
- Imports, In Value Terms, By Country, 2012–2023
- Import Prices, By Country Of Origin, 2012–2023
- Exports, In Physical Terms, 2012–2023
- Exports, In Value Terms, 2012–2023
- Exports, In Physical Terms, By Country, 2023
- Exports, In Physical Terms, By Country, 2012–2023
- Exports, In Value Terms, By Country, 2012–2023
- Export Prices, By Country Of Destination, 2012–2023


