Worldwide Sour Cherries Market to Expand at 1.1% CAGR, Reaching $3.2B by 2035
IndexBox has just published a new report: World - Sour Cherries - Market Analysis, Forecast, Size, Trends and Insights.
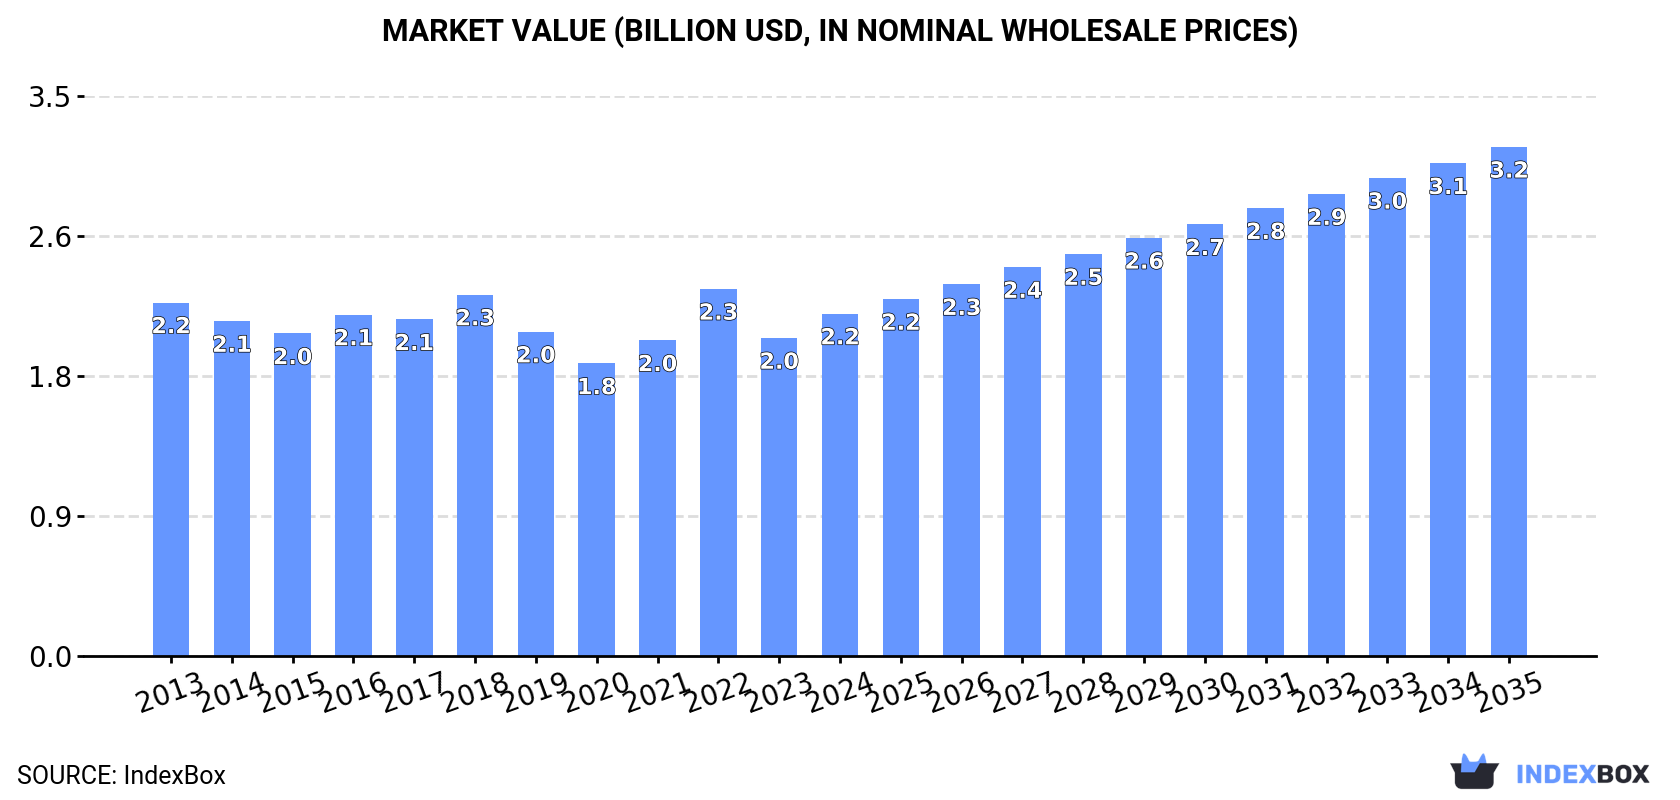
Driven by rising demand, the sour cherry market is projected to grow steadily, reaching a volume of 1.8M tons and a value of $3.2B by the end of 2035. The anticipated CAGR of +1.1% for volume and +3.7% for value indicates a positive outlook for the market in the coming years.
Market Forecast
Driven by increasing demand for sour cherries worldwide, the market is expected to continue an upward consumption trend over the next decade. Market performance is forecast to retain its current trend pattern, expanding with an anticipated CAGR of +1.1% for the period from 2024 to 2035, which is projected to bring the market volume to 1.8M tons by the end of 2035.
In value terms, the market is forecast to increase with an anticipated CAGR of +3.7% for the period from 2024 to 2035, which is projected to bring the market value to $3.2B (in nominal wholesale prices) by the end of 2035.
Consumption
World's Consumption of Sour Cherries
In 2024, global consumption of sour cherries expanded to 1.6M tons, with an increase of 2.5% on the previous year's figure. Over the period under review, consumption saw a relatively flat trend pattern. Over the period under review, global consumption attained the peak volume at 1.6M tons in 2022; afterwards, it flattened through to 2024.
The global sour cherry market revenue totaled $2.2B in 2024, with an increase of 7.7% against the previous year. This figure reflects the total revenues of producers and importers (excluding logistics costs, retail marketing costs, and retailers' margins, which will be included in the final consumer price). In general, consumption, however, showed a relatively flat trend pattern. As a result, consumption reached the peak level of $2.3B. From 2023 to 2024, the growth of the global market remained at a somewhat lower figure.
Consumption By Country
The countries with the highest volumes of consumption in 2024 were Russia (290K tons), Turkey (194K tons) and Poland (174K tons), with a combined 41% share of global consumption. Ukraine, Serbia, Iran, the United States, Uzbekistan and Hungary lagged somewhat behind, together comprising a further 43%.
From 2013 to 2024, the most notable rate of growth in terms of consumption, amongst the main consuming countries, was attained by Uzbekistan (with a CAGR of +6.7%), while consumption for the other global leaders experienced more modest paces of growth.
In value terms, the United States ($464M), Russia ($306M) and Poland ($252M) constituted the countries with the highest levels of market value in 2024, with a combined 47% share of the global market. Turkey, Iran, Serbia, Ukraine, Uzbekistan and Hungary lagged somewhat behind, together comprising a further 35%.
Among the main consuming countries, Uzbekistan, with a CAGR of +7.7%, recorded the highest growth rate of market size over the period under review, while market for the other global leaders experienced more modest paces of growth.
In 2024, the highest levels of sour cherry per capita consumption was registered in Serbia (22 kg per person), followed by Hungary (5.4 kg per person), Poland (4.6 kg per person) and Ukraine (4 kg per person), while the world average per capita consumption of sour cherry was estimated at 0.2 kg per person.
In Serbia, sour cherry per capita consumption expanded at an average annual rate of +1.9% over the period from 2013-2024. In the other countries, the average annual rates were as follows: Hungary (+0.2% per year) and Poland (-0.2% per year).
Production
World's Production of Sour Cherries
Global sour cherry production rose to 1.6M tons in 2024, increasing by 2.7% on the previous year. Overall, production recorded a relatively flat trend pattern. The pace of growth was the most pronounced in 2018 when the production volume increased by 16%. Global production peaked at 1.6M tons in 2022; afterwards, it flattened through to 2024. The general positive trend in terms output was largely conditioned by a relatively flat trend pattern of the harvested area and a relatively flat trend pattern in yield figures.
In value terms, sour cherry production expanded significantly to $2.2B in 2024 estimated in export price. Over the period under review, production, however, recorded a relatively flat trend pattern. The most prominent rate of growth was recorded in 2022 with an increase of 12%. Over the period under review, global production hit record highs at $2.3B in 2018; however, from 2019 to 2024, production remained at a lower figure.
Production By Country
The countries with the highest volumes of production in 2024 were Russia (283K tons), Turkey (194K tons) and Poland (176K tons), together comprising 41% of global production. Ukraine, Serbia, Iran, the United States, Uzbekistan and Hungary lagged somewhat behind, together accounting for a further 44%.
From 2013 to 2024, the biggest increases were recorded for Uzbekistan (with a CAGR of +6.9%), while production for the other global leaders experienced more modest paces of growth.
Yield
The global average sour cherry yield amounted to 7 tons per ha in 2024, therefore, remained relatively stable against the previous year. Over the period under review, the yield showed a relatively flat trend pattern. The most prominent rate of growth was recorded in 2018 when the yield increased by 11% against the previous year. As a result, the yield attained the peak level of 7.2 tons per ha. From 2019 to 2024, the growth of the average sour cherry yield failed to regain momentum.
Harvested Area
In 2024, the total area harvested in terms of sour cherries production worldwide stood at 225K ha, remaining relatively unchanged against the year before. In general, the harvested area continues to indicate a relatively flat trend pattern. The pace of growth appeared the most rapid in 2018 when the harvested area increased by 4.9% against the previous year. The global harvested area peaked at 228K ha in 2022; however, from 2023 to 2024, the harvested area remained at a lower figure.
Imports
World's Imports of Sour Cherries
In 2024, overseas purchases of sour cherries were finally on the rise to reach 50K tons for the first time since 2020, thus ending a three-year declining trend. In general, imports, however, recorded a pronounced decline. The most prominent rate of growth was recorded in 2018 when imports increased by 34% against the previous year. As a result, imports attained the peak of 80K tons. From 2019 to 2024, the growth of global imports failed to regain momentum.
In value terms, sour cherry imports surged to $99M in 2024. Over the period under review, imports, however, recorded a relatively flat trend pattern. Global imports peaked at $114M in 2020; however, from 2021 to 2024, imports failed to regain momentum.
Imports By Country
In 2024, Germany (11K tons), distantly followed by Russia (7.4K tons), Saudi Arabia (6.2K tons), Austria (2.7K tons), Italy (2.6K tons), the Netherlands (2.5K tons) and Egypt (2.3K tons) represented the largest importers of sour cherries, together making up 70% of total imports. The following importers - Romania (1.4K tons), Azerbaijan (1K tons) and Palestine (0.9K tons) - together made up 6.5% of total imports.
From 2013 to 2024, the most notable rate of growth in terms of purchases, amongst the key importing countries, was attained by Azerbaijan (with a CAGR of +58.5%), while imports for the other global leaders experienced more modest paces of growth.
In value terms, the largest sour cherry importing markets worldwide were Germany ($17M), Russia ($9.2M) and Saudi Arabia ($8.8M), together comprising 36% of global imports. Italy, Egypt, the Netherlands, Austria, Palestine, Romania and Azerbaijan lagged somewhat behind, together accounting for a further 24%.
Among the main importing countries, Azerbaijan, with a CAGR of +63.0%, recorded the highest growth rate of the value of imports, over the period under review, while purchases for the other global leaders experienced more modest paces of growth.
Import Prices By Country
The average sour cherry import price stood at $1,975 per ton in 2024, picking up by 14% against the previous year. Over the last eleven-year period, it increased at an average annual rate of +2.4%. The pace of growth was the most pronounced in 2017 an increase of 22%. Global import price peaked in 2024 and is likely to see steady growth in years to come.
There were significant differences in the average prices amongst the major importing countries. In 2024, amid the top importers, the country with the highest price was Italy ($2,994 per ton), while Azerbaijan ($1,000 per ton) was amongst the lowest.
From 2013 to 2024, the most notable rate of growth in terms of prices was attained by Italy (+5.7%), while the other global leaders experienced more modest paces of growth.
Exports
World's Exports of Sour Cherries
In 2024, shipments abroad of sour cherries was finally on the rise to reach 46K tons after three years of decline. Over the period under review, exports, however, continue to indicate a noticeable descent. Over the period under review, the global exports hit record highs at 81K tons in 2015; however, from 2016 to 2024, the exports stood at a somewhat lower figure.
In value terms, sour cherry exports soared to $80M in 2024. Overall, exports, however, showed a noticeable curtailment. The most prominent rate of growth was recorded in 2017 with an increase of 33% against the previous year. As a result, the exports attained the peak of $133M. From 2018 to 2024, the growth of the global exports failed to regain momentum.
Exports By Country
The shipments of the three major exporters of sour cherries, namely Hungary, Serbia and Spain, represented more than third of total export. It was distantly followed by Iran (3.1K tons), Moldova (2.8K tons), Poland (2.6K tons) and Uzbekistan (2.3K tons), together comprising a 24% share of total exports. Bulgaria (1.8K tons), Lebanon (1.8K tons) and the Czech Republic (1.6K tons) followed a long way behind the leaders.
From 2013 to 2024, the most notable rate of growth in terms of shipments, amongst the key exporting countries, was attained by Uzbekistan (with a CAGR of +87.3%), while the other global leaders experienced more modest paces of growth.
In value terms, the largest sour cherry supplying countries worldwide were Spain ($17M), Hungary ($11M) and Serbia ($6.3M), together comprising 44% of global exports. Poland, Iran, Uzbekistan, Lebanon, Moldova, Bulgaria and the Czech Republic lagged somewhat behind, together accounting for a further 27%.
In terms of the main exporting countries, Uzbekistan, with a CAGR of +108.8%, recorded the highest growth rate of the value of exports, over the period under review, while shipments for the other global leaders experienced more modest paces of growth.
Export Prices By Country
The average sour cherry export price stood at $1,727 per ton in 2024, approximately equating the previous year. Overall, the export price, however, showed a relatively flat trend pattern. The most prominent rate of growth was recorded in 2017 an increase of 33% against the previous year. The global export price peaked at $1,855 per ton in 2014; however, from 2015 to 2024, the export prices remained at a lower figure.
There were significant differences in the average prices amongst the major exporting countries. In 2024, amid the top suppliers, the country with the highest price was Spain ($3,118 per ton), while Moldova ($845 per ton) was amongst the lowest.
From 2013 to 2024, the most notable rate of growth in terms of prices was attained by Uzbekistan (+11.5%), while the other global leaders experienced more modest paces of growth.
-
1. INTRODUCTION
Making Data-Driven Decisions to Grow Your Business
- REPORT DESCRIPTION
- RESEARCH METHODOLOGY AND THE AI PLATFORM
- DATA-DRIVEN DECISIONS FOR YOUR BUSINESS
- GLOSSARY AND SPECIFIC TERMS
-
2. EXECUTIVE SUMMARY
A Quick Overview of Market Performance
- KEY FINDINGS
- MARKET TRENDS This Chapter is Available Only for the Professional Edition PRO
-
3. MARKET OVERVIEW
Understanding the Current State of The Market and its Prospects
- MARKET SIZE: HISTORICAL DATA (2012–2025) AND FORECAST (2026–2035)
- CONSUMPTION BY COUNTRY: HISTORICAL DATA (2012–2025) AND FORECAST (2026–2035)
- MARKET FORECAST TO 2035
-
4. MOST PROMISING PRODUCTS FOR DIVERSIFICATION
Finding New Products to Diversify Your Business
- TOP PRODUCTS TO DIVERSIFY YOUR BUSINESS
- BEST-SELLING PRODUCTS
- MOST CONSUMED PRODUCTS
- MOST TRADED PRODUCTS
- MOST PROFITABLE PRODUCTS FOR EXPORT
-
5. MOST PROMISING SUPPLYING COUNTRIES
Choosing the Best Countries to Establish Your Sustainable Supply Chain
- TOP COUNTRIES TO SOURCE YOUR PRODUCT
- TOP PRODUCING COUNTRIES
- COUNTRIES WITH TOP YIELDS
- TOP EXPORTING COUNTRIES
- LOW-COST EXPORTING COUNTRIES
-
6. MOST PROMISING OVERSEAS MARKETS
Choosing the Best Countries to Boost Your Export
- TOP OVERSEAS MARKETS FOR EXPORTING YOUR PRODUCT
- TOP CONSUMING MARKETS
- UNSATURATED MARKETS
- TOP IMPORTING MARKETS
- MOST PROFITABLE MARKETS
-
7. PRODUCTION
The Latest Trends and Insights into The Industry
- PRODUCTION VOLUME AND VALUE: HISTORICAL DATA (2012–2025) AND FORECAST (2026–2035)
- PRODUCTION BY COUNTRY: HISTORICAL DATA (2012–2025) AND FORECAST (2026–2035)
- HARVESTED AREA AND YIELD BY COUNTRY: HISTORICAL DATA (2012–2025) AND FORECAST (2026–2035)
-
8. IMPORTS
The Largest Import Supplying Countries
- IMPORTS: HISTORICAL DATA (2012–2025) AND FORECAST (2026–2035)
- IMPORTS BY COUNTRY: HISTORICAL DATA (2012–2025) AND FORECAST (2026–2035)
- IMPORT PRICES BY COUNTRY: HISTORICAL DATA (2012–2025) AND FORECAST (2026–2035)
-
9. EXPORTS
The Largest Destinations for Exports
- EXPORTS: HISTORICAL DATA (2012–2025) AND FORECAST (2026–2035)
- EXPORTS BY COUNTRY: HISTORICAL DATA (2012–2025) AND FORECAST (2026–2035)
- EXPORT PRICES BY COUNTRY: HISTORICAL DATA (2012–2025) AND FORECAST (2026–2035)
-
10. PROFILES OF MAJOR PRODUCERS
The Largest Producers on The Market and Their Profiles
-
11. COUNTRY PROFILES
The Largest Markets And Their Profiles
This Chapter is Available Only for the Professional Edition PRO- 11.1United States
- Market Size
- Production
- Imports
- Exports
- 11.2China
- Market Size
- Production
- Imports
- Exports
- 11.3Japan
- Market Size
- Production
- Imports
- Exports
- 11.4Germany
- Market Size
- Production
- Imports
- Exports
- 11.5United Kingdom
- Market Size
- Production
- Imports
- Exports
- 11.6France
- Market Size
- Production
- Imports
- Exports
- 11.7Brazil
- Market Size
- Production
- Imports
- Exports
- 11.8Italy
- Market Size
- Production
- Imports
- Exports
- 11.9Russian Federation
- Market Size
- Production
- Imports
- Exports
- 11.10India
- Market Size
- Production
- Imports
- Exports
- 11.11Canada
- Market Size
- Production
- Imports
- Exports
- 11.12Australia
- Market Size
- Production
- Imports
- Exports
- 11.13Republic of Korea
- Market Size
- Production
- Imports
- Exports
- 11.14Spain
- Market Size
- Production
- Imports
- Exports
- 11.15Mexico
- Market Size
- Production
- Imports
- Exports
- 11.16Indonesia
- Market Size
- Production
- Imports
- Exports
- 11.17Netherlands
- Market Size
- Production
- Imports
- Exports
- 11.18Turkey
- Market Size
- Production
- Imports
- Exports
- 11.19Saudi Arabia
- Market Size
- Production
- Imports
- Exports
- 11.20Switzerland
- Market Size
- Production
- Imports
- Exports
- 11.21Sweden
- Market Size
- Production
- Imports
- Exports
- 11.22Nigeria
- Market Size
- Production
- Imports
- Exports
- 11.23Poland
- Market Size
- Production
- Imports
- Exports
- 11.24Belgium
- Market Size
- Production
- Imports
- Exports
- 11.25Argentina
- Market Size
- Production
- Imports
- Exports
- 11.26Norway
- Market Size
- Production
- Imports
- Exports
- 11.27Austria
- Market Size
- Production
- Imports
- Exports
- 11.28Thailand
- Market Size
- Production
- Imports
- Exports
- 11.29United Arab Emirates
- Market Size
- Production
- Imports
- Exports
- 11.30Colombia
- Market Size
- Production
- Imports
- Exports
- 11.31Denmark
- Market Size
- Production
- Imports
- Exports
- 11.32South Africa
- Market Size
- Production
- Imports
- Exports
- 11.33Malaysia
- Market Size
- Production
- Imports
- Exports
- 11.34Israel
- Market Size
- Production
- Imports
- Exports
- 11.35Singapore
- Market Size
- Production
- Imports
- Exports
- 11.36Egypt
- Market Size
- Production
- Imports
- Exports
- 11.37Philippines
- Market Size
- Production
- Imports
- Exports
- 11.38Finland
- Market Size
- Production
- Imports
- Exports
- 11.39Chile
- Market Size
- Production
- Imports
- Exports
- 11.40Ireland
- Market Size
- Production
- Imports
- Exports
- 11.41Pakistan
- Market Size
- Production
- Imports
- Exports
- 11.42Greece
- Market Size
- Production
- Imports
- Exports
- 11.43Portugal
- Market Size
- Production
- Imports
- Exports
- 11.44Kazakhstan
- Market Size
- Production
- Imports
- Exports
- 11.45Algeria
- Market Size
- Production
- Imports
- Exports
- 11.46Czech Republic
- Market Size
- Production
- Imports
- Exports
- 11.47Qatar
- Market Size
- Production
- Imports
- Exports
- 11.48Peru
- Market Size
- Production
- Imports
- Exports
- 11.49Romania
- Market Size
- Production
- Imports
- Exports
- 11.50Vietnam
- Market Size
- Production
- Imports
- Exports
-
LIST OF TABLES
- Key Findings In 2025
- Market Volume, In Physical Terms: Historical Data (2012–2025) and Forecast (2026–2035)
- Market Value: Historical Data (2012–2025) and Forecast (2026–2035)
- Per Capita Consumption, by Country, 2022–2025
- Production, In Physical Terms, By Country: Historical Data (2012–2025) and Forecast (2026–2035)
- Harvested Area, by Country: Historical Data (2012–2025) and Forecast (2026–2035)
- Yield, by Country: Historical Data (2012–2025) and Forecast (2026–2035)
- Imports, in Physical Terms, by Country: Historical Data (2012–2025) and Forecast (2026–2035)
- Imports, in Value Terms, by Country: Historical Data (2012–2025) and Forecast (2026–2035)
- Import Prices, by Country: Historical Data (2012–2025) and Forecast (2026–2035)
- Exports, in Physical Terms, by Country: Historical Data (2012–2025) and Forecast (2026–2035)
- Exports, in Value Terms, by Country: Historical Data (2012–2025) and Forecast (2026–2035)
- Export Prices, by Country: Historical Data (2012–2025) and Forecast (2026–2035)
-
LIST OF FIGURES
- Market Volume, in Physical Terms: Historical Data (2012–2025) and Forecast (2026–2035)
- Market Value: Historical Data (2012–2025) and Forecast (2026–2035)
- Consumption, by Country, 2025
- Market Volume Forecast to 2035
- Market Value Forecast to 2035
- Market Size and Growth, by Product
- Average Per Capita Consumption, by Product
- Exports and Growth, by Product
- Export Prices and Growth, by Product
- Production Volume and Growth
- Yield and Growth
- Exports and Growth
- Export Prices and Growth
- Market Size and Growth
- Per Capita Consumption
- Imports and Growth
- Import Prices
- Production, in Physical Terms: Historical Data (2012–2025) and Forecast (2026–2035)
- Production, in Value Terms: Historical Data (2012–2025) and Forecast (2026–2035)
- Harvested Area: Historical Data (2012–2025) and Forecast (2026–2035)
- Yield: Historical Data (2012–2025) and Forecast (2026–2035)
- Production, in Physical Terms, by Country: Historical Data (2012–2025) and Forecast (2026–2035)
- Harvested Area, by Country, 2025
- Harvested Area, by Country: Historical Data (2012–2025) and Forecast (2026–2035)
- Yield, by Country: Historical Data (2012–2025) and Forecast (2026–2035)
- Imports, in Physical Terms: Historical Data (2012–2025) and Forecast (2026–2035)
- Imports, in Value Terms: Historical Data (2012–2025) and Forecast (2026–2035)
- Imports, in Physical Terms, by Country, 2025
- Imports, in Physical Terms, by Country: Historical Data (2012–2025) and Forecast (2026–2035)
- Imports, in Value Terms, by Country: Historical Data (2012–2025) and Forecast (2026–2035)
- Import Prices, by Country: Historical Data (2012–2025) and Forecast (2026–2035)
- Exports, in Physical Terms: Historical Data (2012–2025) and Forecast (2026–2035)
- Exports, in Value Terms: Historical Data (2012–2025) and Forecast (2026–2035)
- Exports, in Physical Terms, by Country, 2025
- Exports, in Physical Terms, by Country: Historical Data (2012–2025) and Forecast (2026–2035)
- Exports, in Value Terms, by Country: Historical Data (2012–2025) and Forecast (2026–2035)
- Export Prices, by Country: Historical Data (2012–2025) and Forecast (2026–2035)
Recommended posts
Free Data: Sour Cherries - World
Instant access. No credit card needed.


