
Northern America - Flours, Meals And Pellets Of Fish Or Of Crustaceans And Molluscs - Market Analysis, Forecast, Size, Trends And Insights
Get instant access to more than 2 million reports, dashboards, and datasets on the IndexBox Platform.
View PricingNorthern America's Seafood Meals and Pellets Market Poised for Steady Growth With a +0.7% CAGR in Value
IndexBox has just published a new report: Northern America - Flours, Meals And Pellets Of Fish Or Of Crustaceans And Molluscs - Market Analysis, Forecast, Size, Trends And Insights.
The article provides a comprehensive analysis of the Northern American market for flours, meals, and pellets of fish, crustaceans, and molluscs from 2013-2024, with forecasts to 2035. In 2024, consumption was 572K tons ($904M), with the United States accounting for 86% of volume. Production was 551K tons ($855M), also heavily concentrated in the US. The market is forecast to grow at a CAGR of +0.5% in volume and +0.7% in value through 2035, reaching 604K tons and $976M. Imports have grown to 132K tons ($263M), while exports have declined to 110K tons ($178M). The US is the dominant producer, consumer, and exporter, while both the US and Canada are significant importers.
Key Findings
- Market forecast to reach 604K tons and $976M by 2035, growing at CAGRs of +0.5% and +0.7% respectively
- The United States dominates the market, constituting 86% of consumption and 95% of production in 2024
- Imports are growing steadily, reaching 132K tons in 2024, driven by demand in both the US and Canada
- Exports have contracted, with the US as the sole significant supplier, facing a -10.7% decline in volume in 2024
- Per capita consumption is highest in Canada at 2.1 kg, compared to 1.4 kg in the United States
Market Forecast
Driven by increasing demand for flours, meals and pellets of fish or of crustaceans and molluscs in Northern America, the market is expected to continue an upward consumption trend over the next decade. Market performance is forecast to retain its current trend pattern, expanding with an anticipated CAGR of +0.5% for the period from 2024 to 2035, which is projected to bring the market volume to 604K tons by the end of 2035.
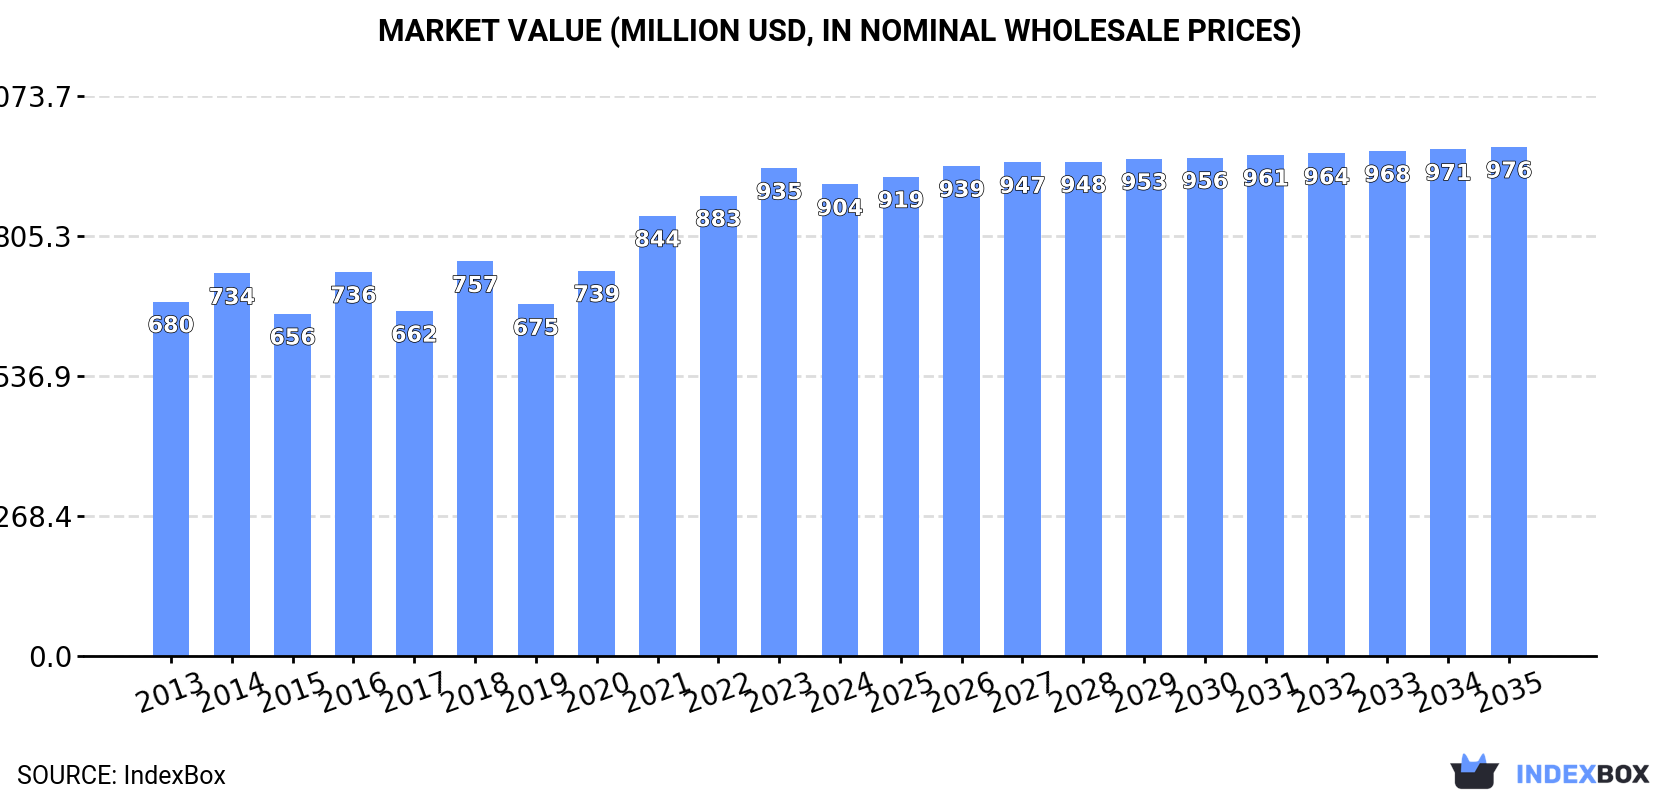
In value terms, the market is forecast to increase with an anticipated CAGR of +0.7% for the period from 2024 to 2035, which is projected to bring the market value to $976M (in nominal wholesale prices) by the end of 2035.
Consumption
Northern America's Consumption of Flours, Meals And Pellets Of Fish Or Of Crustaceans And Molluscs
Seafood meals and pellets consumption fell to 572K tons in 2024, approximately equating 2023. Over the period under review, consumption, however, continues to indicate a relatively flat trend pattern. The pace of growth appeared the most rapid in 2023 when the consumption volume increased by 3.6%. As a result, consumption attained the peak volume of 580K tons, and then dropped slightly in the following year.
The revenue of the seafood meals and pellets market in Northern America declined to $904M in 2024, which is down by -3.3% against the previous year. This figure reflects the total revenues of producers and importers (excluding logistics costs, retail marketing costs, and retailers' margins, which will be included in the final consumer price). The market value increased at an average annual rate of +2.6% from 2013 to 2024; the trend pattern indicated some noticeable fluctuations being recorded throughout the analyzed period. Over the period under review, the market attained the maximum level at $935M in 2023, and then fell modestly in the following year.
Consumption By Country
The United States (491K tons) constituted the country with the largest volume of seafood meals and pellets consumption, accounting for 86% of total volume. Moreover, seafood meals and pellets consumption in the United States exceeded the figures recorded by the second-largest consumer, Canada (81K tons), sixfold.
From 2013 to 2024, the average annual growth rate of volume in the United States was relatively modest.
In value terms, the United States ($744M) led the market, alone. The second position in the ranking was taken by Canada ($160M).
From 2013 to 2024, the average annual rate of growth in terms of value in the United States amounted to +2.6%.
The countries with the highest levels of seafood meals and pellets per capita consumption in 2024 were Canada (2.1 kg per person) and the United States (1.4 kg per person).
From 2013 to 2024, the biggest increases were recorded for the United States (with a CAGR of +0.2%).
Production
Northern America's Production of Flours, Meals And Pellets Of Fish Or Of Crustaceans And Molluscs
In 2024, approx. 551K tons of flours, meals and pellets of fish or of crustaceans and molluscs were produced in Northern America; waning by -4.3% on the previous year's figure. Over the period under review, production showed a relatively flat trend pattern. The pace of growth was the most pronounced in 2023 with an increase of 12% against the previous year. The volume of production peaked at 596K tons in 2019; however, from 2020 to 2024, production remained at a lower figure.
In value terms, seafood meals and pellets production fell to $855M in 2024 estimated in export price. The total output value increased at an average annual rate of +1.5% from 2013 to 2024; the trend pattern remained consistent, with somewhat noticeable fluctuations in certain years. The growth pace was the most rapid in 2018 with an increase of 18%. Over the period under review, production hit record highs at $903M in 2023, and then contracted in the following year.
Production By Country
The country with the largest volume of seafood meals and pellets production was the United States (525K tons), accounting for 95% of total volume. Moreover, seafood meals and pellets production in the United States exceeded the figures recorded by the second-largest producer, Canada (25K tons), more than tenfold.
In the United States, seafood meals and pellets production remained relatively stable over the period from 2013-2024.
Imports
Northern America's Imports of Flours, Meals And Pellets Of Fish Or Of Crustaceans And Molluscs
Seafood meals and pellets imports expanded slightly to 132K tons in 2024, picking up by 3.3% compared with the previous year's figure. The total import volume increased at an average annual rate of +3.4% from 2013 to 2024; however, the trend pattern indicated some noticeable fluctuations being recorded in certain years. The growth pace was the most rapid in 2014 when imports increased by 27% against the previous year. Over the period under review, imports reached the peak figure at 141K tons in 2022; however, from 2023 to 2024, imports stood at a somewhat lower figure.
In value terms, seafood meals and pellets imports reached $263M in 2024. Total imports indicated a buoyant expansion from 2013 to 2024: its value increased at an average annual rate of +5.2% over the last eleven-year period. The trend pattern, however, indicated some noticeable fluctuations being recorded throughout the analyzed period. Based on 2024 figures, imports increased by +37.8% against 2018 indices. The pace of growth was the most pronounced in 2014 when imports increased by 23% against the previous year. Over the period under review, imports attained the maximum in 2024 and are expected to retain growth in the immediate term.
Imports By Country
The purchases of the two major importers of flours, meals and pellets of fish or of crustaceans and molluscs, namely the United States and Canada, represented more than two-thirds of total import.
From 2013 to 2024, the biggest increases were recorded for the United States (with a CAGR of +4.3%).
In value terms, the United States ($147M) and Canada ($116M) appeared to be the countries with the highest levels of imports in 2024.
The United States, with a CAGR of +6.0%, recorded the highest rates of growth with regard to the value of imports, among the main importing countries over the period under review.
Import Prices By Country
The import price in Northern America stood at $1,995 per ton in 2024, remaining stable against the previous year. Over the last eleven-year period, it increased at an average annual rate of +1.8%. The most prominent rate of growth was recorded in 2022 when the import price increased by 12% against the previous year. Over the period under review, import prices hit record highs in 2024 and is likely to continue growth in years to come.
Average prices varied noticeably amongst the major importing countries. In 2024, amid the top importers, the country with the highest price was Canada ($2,075 per ton), while the United States totaled $1,937 per ton.
From 2013 to 2024, the most notable rate of growth in terms of prices was attained by Canada (+2.1%).
Exports
Northern America's Exports of Flours, Meals And Pellets Of Fish Or Of Crustaceans And Molluscs
Seafood meals and pellets exports contracted to 110K tons in 2024, falling by -10.7% compared with 2023. Over the period under review, exports continue to indicate a perceptible reduction. The most prominent rate of growth was recorded in 2023 with an increase of 32%. Over the period under review, the exports attained the maximum at 173K tons in 2019; however, from 2020 to 2024, the exports failed to regain momentum.
In value terms, seafood meals and pellets exports contracted to $178M in 2024. Overall, exports continue to indicate a relatively flat trend pattern. The pace of growth appeared the most rapid in 2023 when exports increased by 41% against the previous year. The level of export peaked at $231M in 2016; however, from 2017 to 2024, the exports remained at a lower figure.
Exports By Country
The United States (110K tons) represented roughly 100% of total exports in 2024.
The United States was also the fastest-growing in terms of the flours, meals and pellets of fish or of crustaceans and molluscs exports, with a CAGR of -2.8% from 2013 to 2024. The United States (+3.9 p.p.) significantly strengthened its position in terms of the total exports, while the shares of the other countries remained relatively stable throughout the analyzed period.
In value terms, the United States ($177M) also remains the largest seafood meals and pellets supplier in Northern America.
In the United States, seafood meals and pellets exports remained relatively stable over the period from 2013-2024.
Export Prices By Country
In 2024, the export price in Northern America amounted to $1,611 per ton, dropping by -2.9% against the previous year. Over the period from 2013 to 2024, it increased at an average annual rate of +2.4%. The most prominent rate of growth was recorded in 2018 when the export price increased by 20% against the previous year. Over the period under review, the export prices hit record highs at $1,659 per ton in 2023, and then shrank modestly in the following year.
As there is only one major export destination, the average price level is determined by prices for the United States.
From 2013 to 2024, the rate of growth in terms of prices for the United States amounted to +2.4% per year.
This report provides a comprehensive view of the seafood meals and pellets industry in Northern America, tracking demand, supply, and trade flows across the regional value chain. It explains how demand across key channels and end-use segments shapes consumption patterns, while also mapping the role of input availability, production efficiency, and regulatory standards on supply.
Beyond headline metrics, the study benchmarks prices, margins, and trade routes so you can see where value is created and how it moves between exporters and importers within Northern America. The analysis is designed to support strategic planning, market entry, portfolio prioritization, and risk management in the seafood meals and pellets landscape in Northern America.
Quick navigation
- Key findings
- Report scope
- Product coverage
- Country coverage
- Methodology
- Forecasts to 2035
- Price analysis
- Market participants
- Country profiles
- How to use this report
- FAQ
Key findings
- Regional demand is shaped by both household and industrial usage, with trade flows linking supply hubs to import-reliant countries.
- Pricing dynamics reflect unit values, freight costs, exchange rates, and regulatory shifts that affect sourcing decisions.
- Supply depends on input availability and production efficiency, creating distinct cost curves across Northern America.
- Market concentration varies by country, creating different competitive landscapes and entry barriers.
- The 2035 outlook highlights where capacity investment and demand growth are most aligned within the region.
Report scope
The report combines market sizing with trade intelligence and price analytics for Northern America. It covers both historical performance and the forward outlook to 2035, allowing you to compare cycles, structural shifts, and policy impacts across countries and sub-regions.
- Market size and growth in value and volume terms
- Consumption structure by end-use segments and countries
- Production capacity, output, and cost dynamics
- Regional trade flows, exporters, importers, and balances
- Price benchmarks, unit values, and margin signals
- Competitive context and market entry conditions
Product coverage
- Prodcom 10204100 - Flours, meals and pellets of fish or of crustaceans, molluscs or other aquatic invertebrates, unfit for human consumption
Country coverage
- Bermuda
- Canada
- Greenland
- Saint Pierre and Miquelon
- United States
Country profiles and benchmarks
For the regional report, country profiles provide a consistent view of market size, trade balance, prices, and per-capita indicators across Northern America. The profiles highlight the largest consuming and producing markets and allow direct benchmarking across peers.
Methodology
The analysis is built on a multi-source framework that combines official statistics, trade records, company disclosures, and expert validation. Data are standardized, reconciled, and cross-checked to ensure consistency across time series.
- International trade data (exports, imports, and mirror statistics)
- National production and consumption statistics
- Company-level information from financial filings and public releases
- Price series and unit value benchmarks
- Analyst review, outlier checks, and time-series validation
All data are normalized to a common product definition and mapped to a consistent set of codes. This ensures that comparisons across time are aligned and actionable.
Forecasts to 2035
The forecast horizon extends to 2035 and is based on a structured model that links seafood meals and pellets demand and supply to macroeconomic indicators, trade patterns, and sector-specific drivers. The model captures both cyclical and structural factors and reflects known policy and technology shifts within Northern America.
- Historical baseline: 2012-2025
- Forecast horizon: 2026-2035
- Scenario-based sensitivity to income growth, substitution, and regulation
- Capacity and investment outlook for major producing countries
Each country projection is built from its own historical pattern and the regional context, allowing the report to show where growth is concentrated and where risks are elevated.
Price analysis and trade dynamics
Prices are analyzed in detail, including export and import unit values, regional spreads, and changes in trade costs. The report highlights how seasonality, freight rates, exchange rates, and supply disruptions influence pricing and margins.
- Price benchmarks by country and sub-region
- Export and import unit value trends
- Seasonality and calendar effects in trade flows
- Price outlook to 2035 under baseline assumptions
Profiles of market participants
Key producers, exporters, and distributors are profiled with a focus on their operational scale, geographic footprint, product mix, and market positioning. This helps identify competitive pressure points, partnership opportunities, and routes to differentiation.
- Business focus and production capabilities
- Geographic reach and distribution networks
- Cost structure and pricing strategy indicators
- Compliance, certification, and sustainability context
How to use this report
- Quantify regional demand and identify the most attractive country markets
- Evaluate export opportunities and prioritize target destinations
- Track price dynamics and protect margins
- Benchmark performance against regional competitors
- Build evidence-based forecasts for investment decisions
This report is designed for manufacturers, distributors, importers, wholesalers, investors, and advisors who need a clear, data-driven picture of seafood meals and pellets dynamics in Northern America.
FAQ
What is included in the seafood meals and pellets market in Northern America?
The market size aggregates consumption and trade data at country and sub-regional levels, presented in both value and volume terms.
How are the forecasts to 2035 built?
The projections combine historical trends with macroeconomic indicators, trade dynamics, and sector-specific drivers.
Does the report cover prices and margins?
Yes, it includes export and import unit values, regional spreads, and a pricing outlook to 2035.
Which countries are profiled in detail?
The report provides profiles for the largest consuming and producing countries in Northern America.
Can this report support market entry decisions?
Yes, it highlights demand hotspots, trade routes, pricing trends, and competitive context.
1. INTRODUCTION
Making Data-Driven Decisions to Grow Your Business
- REPORT DESCRIPTION
- RESEARCH METHODOLOGY AND THE AI PLATFORM
- DATA-DRIVEN DECISIONS FOR YOUR BUSINESS
- GLOSSARY AND SPECIFIC TERMS
2. EXECUTIVE SUMMARY
A Quick Overview of Market Performance
- KEY FINDINGS
- MARKET TRENDS This Chapter is Available Only for the Professional EditionPRO
3. MARKET OVERVIEW
Understanding the Current State of The Market and its Prospects
- MARKET SIZE: HISTORICAL DATA (2012–2025) AND FORECAST (2026–2035)
- CONSUMPTION BY COUNTRY: HISTORICAL DATA (2012–2025) AND FORECAST (2026–2035)
- MARKET FORECAST TO 2035
4. MOST PROMISING PRODUCTS FOR DIVERSIFICATION
Finding New Products to Diversify Your Business
- TOP PRODUCTS TO DIVERSIFY YOUR BUSINESS
- BEST-SELLING PRODUCTS
- MOST CONSUMED PRODUCTS
- MOST TRADED PRODUCTS
- MOST PROFITABLE PRODUCTS FOR EXPORT
5. MOST PROMISING SUPPLYING COUNTRIES
Choosing the Best Countries to Establish Your Sustainable Supply Chain
- TOP COUNTRIES TO SOURCE YOUR PRODUCT
- TOP PRODUCING COUNTRIES
- TOP EXPORTING COUNTRIES
- LOW-COST EXPORTING COUNTRIES
6. MOST PROMISING OVERSEAS MARKETS
Choosing the Best Countries to Boost Your Export
- TOP OVERSEAS MARKETS FOR EXPORTING YOUR PRODUCT
- TOP CONSUMING MARKETS
- UNSATURATED MARKETS
- TOP IMPORTING MARKETS
- MOST PROFITABLE MARKETS
7. PRODUCTION
The Latest Trends and Insights into The Industry
- PRODUCTION VOLUME AND VALUE: HISTORICAL DATA (2012–2025) AND FORECAST (2026–2035)
- PRODUCTION BY COUNTRY: HISTORICAL DATA (2012–2025) AND FORECAST (2026–2035)
8. IMPORTS
The Largest Import Supplying Countries
- IMPORTS: HISTORICAL DATA (2012–2025) AND FORECAST (2026–2035)
- IMPORTS BY COUNTRY: HISTORICAL DATA (2012–2025) AND FORECAST (2026–2035)
- IMPORT PRICES BY COUNTRY: HISTORICAL DATA (2012–2025) AND FORECAST (2026–2035)
9. EXPORTS
The Largest Destinations for Exports
- EXPORTS: HISTORICAL DATA (2012–2025) AND FORECAST (2026–2035)
- EXPORTS BY COUNTRY: HISTORICAL DATA (2012–2025) AND FORECAST (2026–2035)
- EXPORT PRICES BY COUNTRY: HISTORICAL DATA (2012–2025) AND FORECAST (2026–2035)
10. PROFILES OF MAJOR PRODUCERS
The Largest Producers on The Market and Their Profiles
-
11. COUNTRY PROFILES
The Largest Markets And Their Profiles
This Chapter is Available Only for the Professional Edition PRO LIST OF TABLES
- Key Findings In 2025
- Market Volume, In Physical Terms: Historical Data (2012–2025) and Forecast (2026–2035)
- Market Value: Historical Data (2012–2025) and Forecast (2026–2035)
- Per Capita Consumption, by Country, 2022–2025
- Production, In Physical Terms, By Country: Historical Data (2012–2025) and Forecast (2026–2035)
- Imports, In Physical Terms, By Country: Historical Data (2012–2025) and Forecast (2026–2035)
- Imports, In Value Terms, By Country: Historical Data (2012–2025) and Forecast (2026–2035)
- Import Prices, By Country: Historical Data (2012–2025) and Forecast (2026–2035)
- Exports, In Physical Terms, By Country: Historical Data (2012–2025) and Forecast (2026–2035)
- Exports, In Value Terms, By Country: Historical Data (2012–2025) and Forecast (2026–2035)
- Export Prices, By Country: Historical Data (2012–2025) and Forecast (2026–2035)
LIST OF FIGURES
- Market Volume, In Physical Terms: Historical Data (2012–2025) and Forecast (2026–2035)
- Market Value: Historical Data (2012–2025) and Forecast (2026–2035)
- Consumption, by Country, 2025
- Market Volume Forecast to 2035
- Market Value Forecast to 2035
- Market Size and Growth, By Product
- Average Per Capita Consumption, By Product
- Exports and Growth, By Product
- Export Prices and Growth, By Product
- Production Volume and Growth
- Exports and Growth
- Export Prices and Growth
- Market Size and Growth
- Per Capita Consumption
- Imports and Growth
- Import Prices
- Production, In Physical Terms: Historical Data (2012–2025) and Forecast (2026–2035)
- Production, In Value Terms: Historical Data (2012–2025) and Forecast (2026–2035)
- Production, by Country, 2025
- Production, In Physical Terms, by Country: Historical Data (2012–2025) and Forecast (2026–2035)
- Imports, In Physical Terms: Historical Data (2012–2025) and Forecast (2026–2035)
- Imports, In Value Terms: Historical Data (2012–2025) and Forecast (2026–2035)
- Imports, In Physical Terms, By Country, 2025
- Imports, In Physical Terms, By Country: Historical Data (2012–2025) and Forecast (2026–2035)
- Imports, In Value Terms, By Country: Historical Data (2012–2025) and Forecast (2026–2035)
- Import Prices, By Country: Historical Data (2012–2025) and Forecast (2026–2035)
- Exports, In Physical Terms: Historical Data (2012–2025) and Forecast (2026–2035)
- Exports, In Value Terms: Historical Data (2012–2025) and Forecast (2026–2035)
- Exports, In Physical Terms, By Country, 2025
- Exports, In Physical Terms, By Country: Historical Data (2012–2025) and Forecast (2026–2035)
- Exports, In Value Terms, By Country: Historical Data (2012–2025) and Forecast (2026–2035)
- Export Prices, By Country: Historical Data (2012–2025) and Forecast (2026–2035)
Recommended posts
Free Data: Flours, Meals And Pellets Of Fish Or Of Crustaceans And Molluscs - Northern America
Instant access. No credit card needed.


