
Qatar - Nonwoven Fabric - Market Analysis, Forecast, Size, Trends and Insights
Get instant access to more than 2 million reports, dashboards, and datasets on the IndexBox Platform.
View PricingPrice of Nonwoven Fabric in Qatar Soars to $3,256 per Ton Following Three Months of Continuous Growth
Qatar Nonwoven Fabric Import Price in April 2023
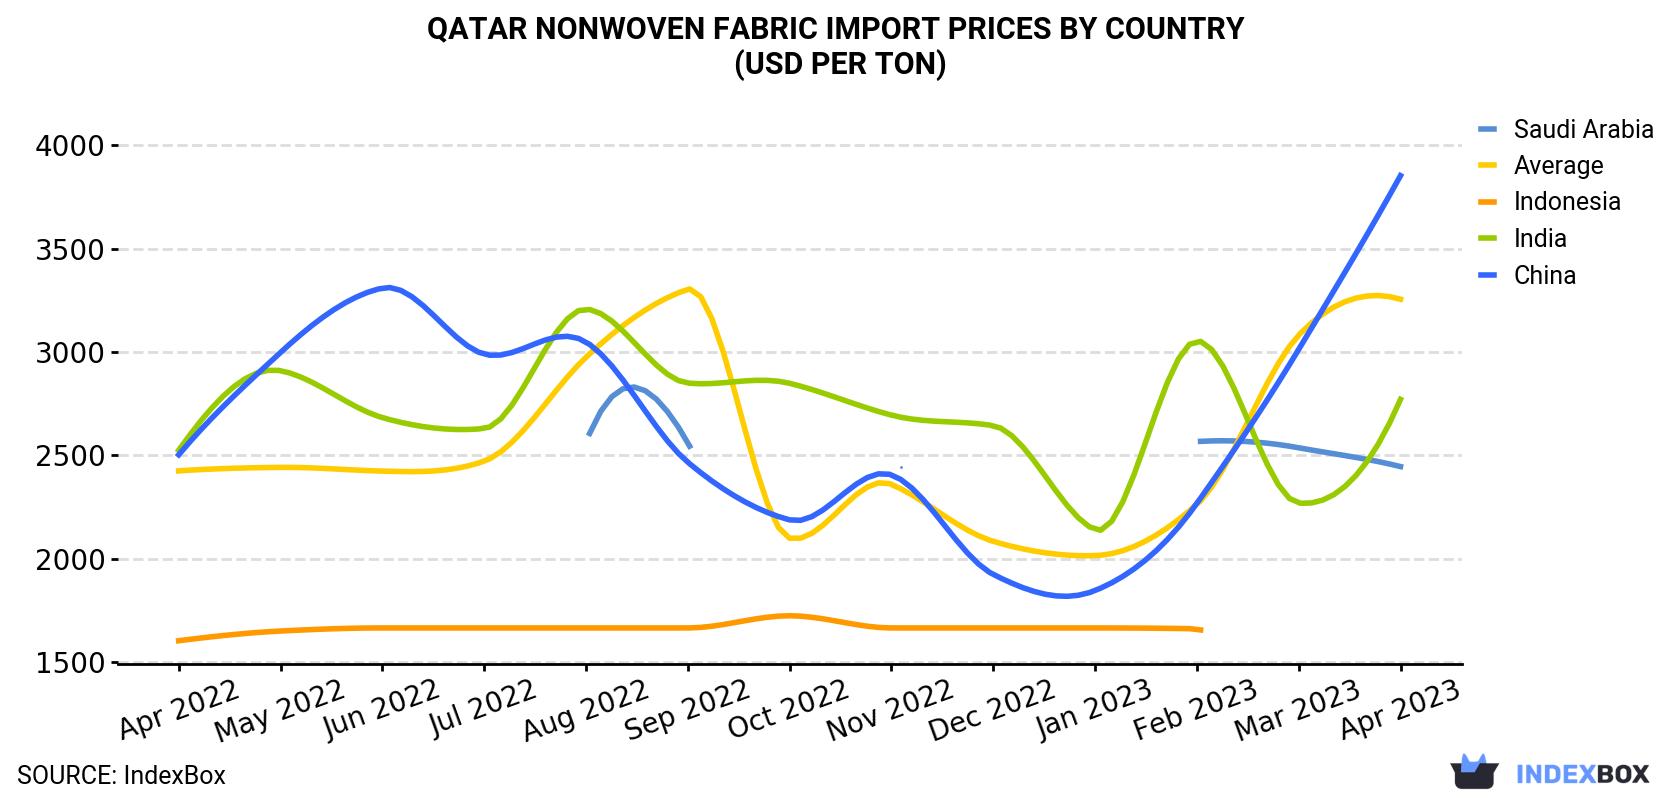
In April 2023, the nonwoven fabric price amounted to $3,256 per ton (CIF, Qatar), with an increase of 5.7% against the previous month. Overall, import price indicated a temperate increase from April 2022 to April 2023: its price increased at an average monthly rate of +2.5% over the last twelve-month period. The trend pattern, however, indicated some noticeable fluctuations being recorded throughout the analyzed period. Based on April 2023 figures, nonwoven fabric import price increased by +61.6% against January 2023 indices. The growth pace was the most rapid in March 2023 an increase of 36% against the previous month. Over the period under review, average import prices hit record highs at $3,304 per ton in September 2022; afterwards, it flattened through to April 2023.
There were significant differences in the average prices amongst the major supplying countries. In April 2023, the country with the highest price was China ($3,854 per ton), while the price for Saudi Arabia ($2,446 per ton) was amongst the lowest.
From April 2022 to April 2023, the most notable rate of growth in terms of prices was attained by China (+3.7%), while the prices for the other major suppliers experienced more modest paces of growth.
| COUNTRY | Import Price of Nonwoven Fabric in Qatar (USD per ton) | ||||||||||||
|---|---|---|---|---|---|---|---|---|---|---|---|---|---|
| Apr 2022 | May 2022 | Jun 2022 | Jul 2022 | Aug 2022 | Sep 2022 | Oct 2022 | Nov 2022 | Dec 2022 | Jan 2023 | Feb 2023 | Mar 2023 | Apr 2023 | |
| China | 2,503 | 2,998 | 3,310 | 2,990 | 3,049 | 2,467 | 2,188 | 2,406 | 1,924 | 1,846 | 2,268 | 3,013 | 3,854 |
| India | 2,525 | 2,910 | 2,683 | 2,630 | 3,208 | 2,850 | 2,849 | 2,695 | 2,644 | 2,140 | 3,054 | 2,269 | 2,771 |
| Saudi Arabia | N/A | N/A | N/A | N/A | 2,562 | 2,562 | N/A | 2,562 | N/A | N/A | 2,567 | 2,537 | 2,446 |
| Indonesia | 1,603 | 1,650 | 1,665 | 1,665 | 1,665 | 1,665 | 1,724 | 1,665 | 1,665 | 1,665 | 1,661 | N/A | N/A |
| Average | 2,425 | 2,442 | 2,424 | 2,472 | 2,975 | 3,304 | 2,099 | 2,360 | 2,084 | 2,015 | 2,263 | 3,082 | 3,256 |
Qatar Nonwoven Fabric Imports
In April 2023, the amount of nonwoven fabrics imported into Qatar declined to 209 tons, reducing by -8.9% against the month before. In general, imports recorded a abrupt contraction. The growth pace was the most rapid in October 2022 when imports increased by 119% against the previous month.
In value terms, nonwoven fabric imports shrank modestly to $680K (IndexBox estimates) in April 2023. Over the period under review, imports continue to indicate a deep downturn. The most prominent rate of growth was recorded in August 2022 with an increase of 43% against the previous month. As a result, imports reached the peak of $2.7M. From September 2022 to April 2023, the growth of imports failed to regain momentum.
Qatar Nonwoven Fabric Imports by Country
In April 2023, India (112 tons) constituted the largest nonwoven fabric supplier to Qatar, with a 54% share of total imports. Moreover, nonwoven fabric imports from India exceeded the figures recorded by the second-largest supplier, China (49 tons), twofold.
From April 2022 to April 2023, the average monthly rate of growth in terms of volume from India totaled -9.4%. The remaining supplying countries recorded the following average monthly rates of imports growth: China (-6.9% per month) and Saudi Arabia (+14.7% per month).
In value terms, India ($311K), China ($188K) and Saudi Arabia ($107K) constituted the largest nonwoven fabric suppliers to Qatar, with a combined 89% share of total imports.
Saudi Arabia, with a CAGR of +14.1%, saw the highest rates of growth with regard to the value of imports, in terms of the main suppliers over the period under review, while purchases for the other leaders experienced a decline.
This report provides an in-depth analysis of the nonwoven fabric market in Qatar. Within it, you will discover the latest data on market trends and opportunities by country, consumption, production and price developments, as well as the global trade (imports and exports). The forecast exhibits the market prospects through 2030.
Product coverage:
- Prodcom 13951010 - Non-wovens of a weight . .25 g/m. (including articles made from non-wovens) (excluding articles of apparel, coated or covered)
- Prodcom 13951020 - Non-wovens of a weight of > .25 g/m. but . .70 g/m. (including articles made from non-wovens) (excluding articles of apparel, coated or covered)
- Prodcom 13951030 - Non-wovens of a weight of > .70 g/m. but . .150 g/m. (including articles made from non-wovens) (excluding articles of apparel, coated or covered)
- Prodcom 13951050 - Non-wovens of a weight of > .150 g/m. (including articles made from non-wovens) (excluding articles of apparel, coated or covered)
- Prodcom 13951070 - Non-wovens, coated or covered (including articles made from non-wovens) (excluding articles of apparel)
Country coverage:
- Qatar
Data coverage:
- Market volume and value
- Per Capita consumption
- Forecast of the market dynamics in the medium term
- Trade (exports and imports) in Qatar
- Export and import prices
- Market trends, drivers and restraints
- Key market players and their profiles
Reasons to buy this report:
- Take advantage of the latest data
- Find deeper insights into current market developments
- Discover vital success factors affecting the market
This report is designed for manufacturers, distributors, importers, and wholesalers, as well as for investors, consultants and advisors.
In this report, you can find information that helps you to make informed decisions on the following issues:
- How to diversify your business and benefit from new market opportunities
- How to load your idle production capacity
- How to boost your sales on overseas markets
- How to increase your profit margins
- How to make your supply chain more sustainable
- How to reduce your production and supply chain costs
- How to outsource production to other countries
- How to prepare your business for global expansion
While doing this research, we combine the accumulated expertise of our analysts and the capabilities of artificial intelligence. The AI-based platform, developed by our data scientists, constitutes the key working tool for business analysts, empowering them to discover deep insights and ideas from the marketing data.
-
1. INTRODUCTION
Making Data-Driven Decisions to Grow Your Business
- REPORT DESCRIPTION
- RESEARCH METHODOLOGY AND AI PLATFORM
- DATA-DRIVEN DECISIONS FOR YOUR BUSINESS
- GLOSSARY AND SPECIFIC TERMS
-
2. EXECUTIVE SUMMARY
A Quick Overview of Market Performance
- KEY FINDINGS
- MARKET TRENDS This Chapter is Available Only for the Professional Edition PRO
-
3. MARKET OVERVIEW
Understanding the Current State of The Market and Its Prospects
- MARKET SIZE
- MARKET STRUCTURE
- TRADE BALANCE
- PER CAPITA CONSUMPTION
- MARKET FORECAST TO 2030
-
4. MOST PROMISING PRODUCT
Finding New Products to Diversify Your Business
This Chapter is Available Only for the Professional Edition PRO- TOP PRODUCTS TO DIVERSIFY YOUR BUSINESS
- BEST-SELLING PRODUCTS
- MOST CONSUMED PRODUCT
- MOST TRADED PRODUCT
- MOST PROFITABLE PRODUCT FOR EXPORT
-
5. MOST PROMISING SUPPLYING COUNTRIES
Choosing the Best Countries to Establish Your Sustainable Supply Chain
This Chapter is Available Only for the Professional Edition PRO- TOP COUNTRIES TO SOURCE YOUR PRODUCT
- TOP PRODUCING COUNTRIES
- TOP EXPORTING COUNTRIES
- LOW-COST EXPORTING COUNTRIES
-
6. MOST PROMISING OVERSEAS MARKETS
Choosing the Best Countries to Boost Your Exports
This Chapter is Available Only for the Professional Edition PRO- TOP OVERSEAS MARKETS FOR EXPORTING YOUR PRODUCT
- TOP CONSUMING MARKETS
- UNSATURATED MARKETS
- TOP IMPORTING MARKETS
- MOST PROFITABLE MARKETS
7. PRODUCTION
The Latest Trends and Insights into The Industry
- PRODUCTION VOLUME AND VALUE
8. IMPORTS
The Largest Import Supplying Countries
- IMPORTS FROM 2012–2023
- IMPORTS BY COUNTRY
- IMPORT PRICES BY COUNTRY
9. EXPORTS
The Largest Destinations for Exports
- EXPORTS FROM 2012–2023
- EXPORTS BY COUNTRY
- EXPORT PRICES BY COUNTRY
-
10. PROFILES OF MAJOR PRODUCERS
The Largest Producers on The Market and Their Profiles
This Chapter is Available Only for the Professional Edition PRO -
LIST OF TABLES
- Key Findings In 2023
- Market Volume, In Physical Terms, 2012–2023
- Market Value, 2012–2023
- Per Capita Consumption In 2012-2023
- Imports, In Physical Terms, By Country, 2012–2023
- Imports, In Value Terms, By Country, 2012–2023
- Import Prices, By Country Of Origin, 2012–2023
- Exports, In Physical Terms, By Country, 2012–2023
- Exports, In Value Terms, By Country, 2012–2023
- Export Prices, By Country Of Destination, 2012–2023
-
LIST OF FIGURES
- Market Volume, In Physical Terms, 2012–2023
- Market Value, 2012–2023
- Market Structure – Domestic Supply vs. Imports, In Physical Terms, 2012-2023
- Market Structure – Domestic Supply vs. Imports, In Value Terms, 2012-2023
- Trade Balance, In Physical Terms, 2012-2023
- Trade Balance, In Value Terms, 2012-2023
- Per Capita Consumption, 2012-2023
- Market Volume Forecast to 2030
- Market Value Forecast to 2030
- Products: Market Size And Growth, By Type
- Products: Average Per Capita Consumption, By Type
- Products: Exports And Growth, By Type
- Products: Export Prices And Growth, By Type
- Production Volume And Growth
- Exports And Growth
- Export Prices And Growth
- Market Size And Growth
- Per Capita Consumption
- Imports And Growth
- Import Prices
- Production, In Physical Terms, 2012–2023
- Production, In Value Terms, 2012–2023
- Imports, In Physical Terms, 2012–2023
- Imports, In Value Terms, 2012–2023
- Imports, In Physical Terms, By Country, 2023
- Imports, In Physical Terms, By Country, 2012–2023
- Imports, In Value Terms, By Country, 2012–2023
- Import Prices, By Country Of Origin, 2012–2023
- Exports, In Physical Terms, 2012–2023
- Exports, In Value Terms, 2012–2023
- Exports, In Physical Terms, By Country, 2023
- Exports, In Physical Terms, By Country, 2012–2023
- Exports, In Value Terms, By Country, 2012–2023
- Export Prices, By Country Of Destination, 2012–2023


