
Qatar - Mowers - Market Analysis, Forecast, Size, Trends and Insights
Get instant access to more than 2 million reports, dashboards, and datasets on the IndexBox Platform.
View PricingQatar's August 2023 Import of Mowers Soars 345%, Reaching $246K
Qatar Mower Imports
After two months of decline, purchases abroad of mowers increased by 1,433% to 322 units in August 2023. Overall, imports, however, recorded a relatively flat trend pattern. Over the period under review, imports attained the maximum at 490 units in May 2023; however, from June 2023 to August 2023, imports remained at a lower figure.
In value terms, mower imports skyrocketed to $246K (IndexBox estimates) in August 2023. In general, imports posted a buoyant increase. Imports peaked at 298K units in May 2023; however, from June 2023 to August 2023, imports failed to regain momentum.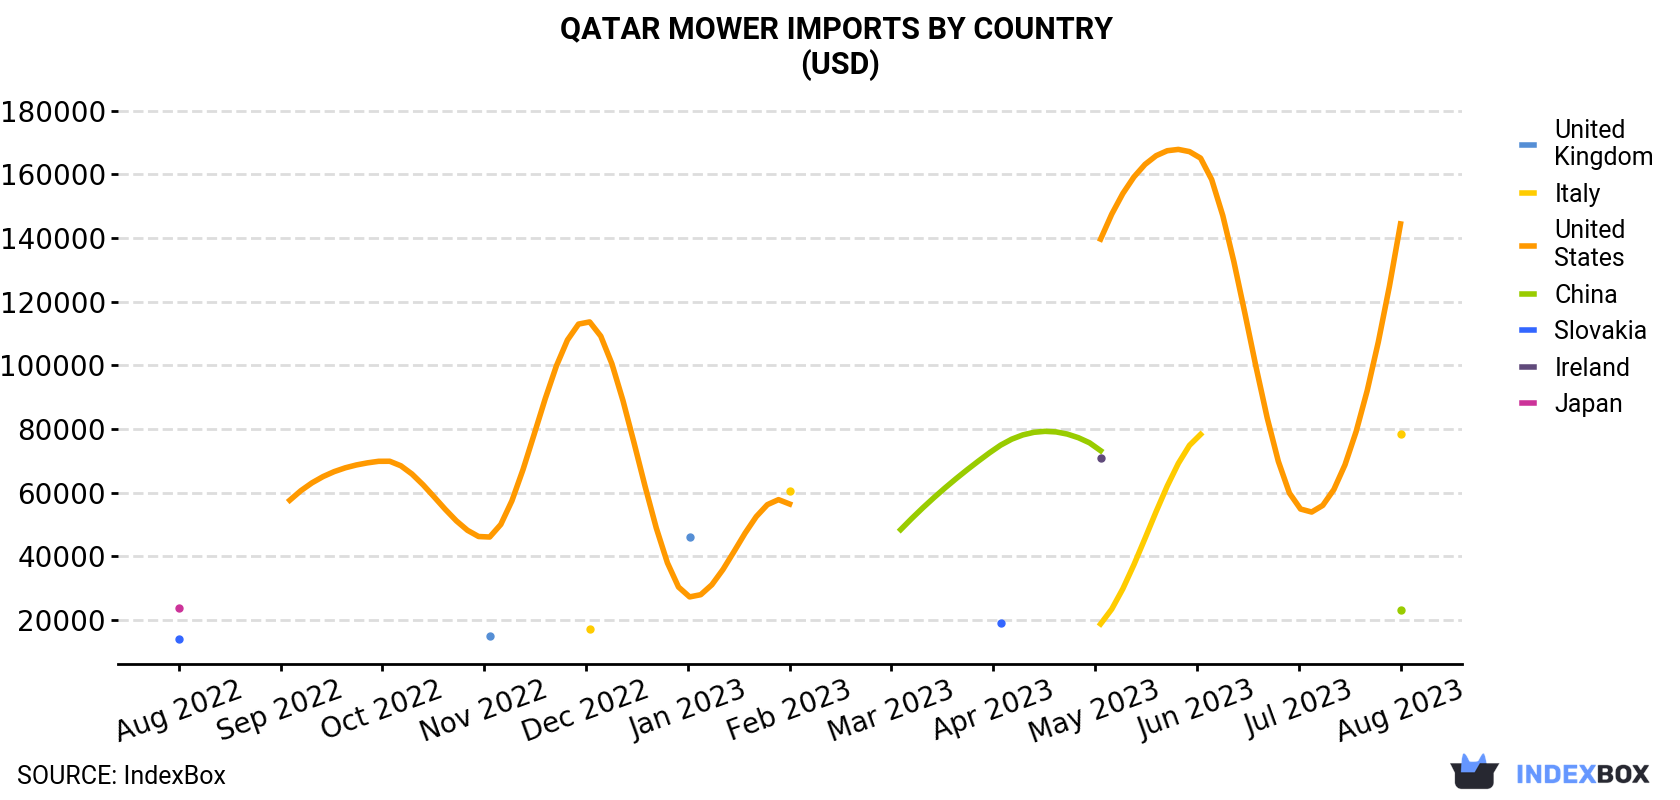
| COUNTRY | Import Value of Mower in Qatar (USD) | ||||||||||||
|---|---|---|---|---|---|---|---|---|---|---|---|---|---|
| Aug 2022 | Sep 2022 | Oct 2022 | Nov 2022 | Dec 2022 | Jan 2023 | Feb 2023 | Mar 2023 | Apr 2023 | May 2023 | Jun 2023 | Jul 2023 | Aug 2023 | |
| United States | N/A | 54,617 | 69,947 | 45,705 | 113,937 | 27,392 | 56,399 | N/A | N/A | 135,186 | 166,041 | 55,286 | 144,387 |
| Italy | 38,565 | N/A | N/A | N/A | 16,983 | N/A | 60,636 | N/A | N/A | 17,218 | 77,529 | N/A | 78,431 |
| China | N/A | N/A | N/A | N/A | N/A | N/A | N/A | 45,276 | 73,333 | 74,661 | N/A | N/A | 23,224 |
| United Kingdom | N/A | N/A | N/A | 14,893 | N/A | 45,963 | N/A | N/A | N/A | N/A | N/A | N/A | N/A |
| Slovakia | 13,838 | N/A | N/A | N/A | N/A | N/A | N/A | N/A | 19,143 | N/A | N/A | N/A | N/A |
| Ireland | N/A | N/A | N/A | N/A | N/A | N/A | N/A | N/A | N/A | 70,942 | N/A | N/A | N/A |
| Japan | 23,856 | N/A | N/A | N/A | N/A | N/A | N/A | N/A | N/A | N/A | N/A | N/A | N/A |
| Others | 39,096 | N/A | 35,261 | N/A | N/A | N/A | N/A | N/A | N/A | N/A | N/A | N/A | N/A |
| Total | 115,355 | 54,617 | 105,208 | 60,598 | 130,920 | 73,355 | 117,035 | 45,276 | 92,476 | 298,007 | 243,570 | 55,286 | 246,042 |
Imports by Country
The United States (175 units), Italy (113 units) and China (34 units) were the main suppliers of mower imports to Qatar, together accounting for 99.9% of total imports.
From August 2022 to August 2023, the biggest increases were in the United States (with a CAGR of +25.0%), while purchases for the other leaders experienced mixed trend patterns.
In value terms, the largest mower suppliers to Qatar were the United States ($144K), Italy ($78K) and China ($23K).
The United States, with a CAGR of +9.2%, recorded the highest growth rate of the value of imports, in terms of the main suppliers over the period under review, while purchases for the other leaders experienced mixed trend patterns.
Imports by Type
In August 2023, mowers for lawns, parks, golf courses or sports grounds (322 units) was the main type of mower supplied to Qatar, accounting for a approximately 100% share of total imports.
From August 2022 to August 2023, the average monthly rate of growth in terms of the volume of import of mowers for lawns, parks, golf courses or sports grounds stood at +6.1%.
In value terms, mowers for lawns, parks, golf courses or sports grounds ($246K) constituted the largest type of mower supplied to Qatar.
Import Prices by Country
In August 2023, the mower price amounted to $764 per unit (CIF, Qatar), with a decrease of -71% against the previous month. Over the period under review, the import price, however, showed a resilient increase. The growth pace was the most rapid in September 2022 when the average import price increased by 951% against the previous month. The import price peaked at $15,150 per unit in November 2022; however, from December 2022 to August 2023, import prices failed to regain momentum.
Average prices varied noticeably amongst the major supplying countries. In August 2023, the country with the highest price was the United States ($825 per unit), while the price for China ($683 per unit) was amongst the lowest.
From August 2022 to August 2023, the most notable rate of growth in terms of prices was attained by Slovakia (+14.0%), while the prices for the other major suppliers experienced more modest paces of growth.
This report provides an in-depth analysis of the mower market in Qatar. Within it, you will discover the latest data on market trends and opportunities by country, consumption, production and price developments, as well as the global trade (imports and exports). The forecast exhibits the market prospects through 2030.
Product coverage:
- Prodcom 28304010 - Electric mowers for lawns, parks, golf courses or sports grounds
- Prodcom 28304030 - Mowers for lawns, parks or sports grounds, powered nonelectrically, w ith the cutting device rotating in a horizontal plane
- Prodcom 28304050 - Motor mowers for lawns, parks or sports grounds, powered non-electrically, with the cutting device rotating in a vertical plane or with cutter bars
- Prodcom 28304070 - Non-motorised mowers for lawns, parks, golf courses or sports grounds (such as push cylinder mowers) (excluding with the cutting device rotating in a horizontal plane)
- Prodcom 28305130 - Motor mowers (excluding for lawns, parks, golf courses or sports grounds)
- Prodcom 28305153 -
- Prodcom 28305155 -
- Prodcom 28305150 - Mowers, including cutter bars, designed to be carried on or hauled by a tractor
- Prodcom 28305170 - Mowers (excluding those with motors, for lawns, parks, golf courses or sports grounds, those designed to be hauled or carried by a tractor)
Country coverage:
- Qatar
Data coverage:
- Market volume and value
- Per Capita consumption
- Forecast of the market dynamics in the medium term
- Trade (exports and imports) in Qatar
- Export and import prices
- Market trends, drivers and restraints
- Key market players and their profiles
Reasons to buy this report:
- Take advantage of the latest data
- Find deeper insights into current market developments
- Discover vital success factors affecting the market
This report is designed for manufacturers, distributors, importers, and wholesalers, as well as for investors, consultants and advisors.
In this report, you can find information that helps you to make informed decisions on the following issues:
- How to diversify your business and benefit from new market opportunities
- How to load your idle production capacity
- How to boost your sales on overseas markets
- How to increase your profit margins
- How to make your supply chain more sustainable
- How to reduce your production and supply chain costs
- How to outsource production to other countries
- How to prepare your business for global expansion
While doing this research, we combine the accumulated expertise of our analysts and the capabilities of artificial intelligence. The AI-based platform, developed by our data scientists, constitutes the key working tool for business analysts, empowering them to discover deep insights and ideas from the marketing data.
-
1. INTRODUCTION
Making Data-Driven Decisions to Grow Your Business
- REPORT DESCRIPTION
- RESEARCH METHODOLOGY AND AI PLATFORM
- DATA-DRIVEN DECISIONS FOR YOUR BUSINESS
- GLOSSARY AND SPECIFIC TERMS
-
2. EXECUTIVE SUMMARY
A Quick Overview of Market Performance
- KEY FINDINGS
- MARKET TRENDS This Chapter is Available Only for the Professional Edition PRO
-
3. MARKET OVERVIEW
Understanding the Current State of The Market and Its Prospects
- MARKET SIZE
- MARKET STRUCTURE
- TRADE BALANCE
- PER CAPITA CONSUMPTION
- MARKET FORECAST TO 2030
-
4. MOST PROMISING PRODUCT
Finding New Products to Diversify Your Business
This Chapter is Available Only for the Professional Edition PRO- TOP PRODUCTS TO DIVERSIFY YOUR BUSINESS
- BEST-SELLING PRODUCTS
- MOST CONSUMED PRODUCT
- MOST TRADED PRODUCT
- MOST PROFITABLE PRODUCT FOR EXPORT
-
5. MOST PROMISING SUPPLYING COUNTRIES
Choosing the Best Countries to Establish Your Sustainable Supply Chain
This Chapter is Available Only for the Professional Edition PRO- TOP COUNTRIES TO SOURCE YOUR PRODUCT
- TOP PRODUCING COUNTRIES
- TOP EXPORTING COUNTRIES
- LOW-COST EXPORTING COUNTRIES
-
6. MOST PROMISING OVERSEAS MARKETS
Choosing the Best Countries to Boost Your Exports
This Chapter is Available Only for the Professional Edition PRO- TOP OVERSEAS MARKETS FOR EXPORTING YOUR PRODUCT
- TOP CONSUMING MARKETS
- UNSATURATED MARKETS
- TOP IMPORTING MARKETS
- MOST PROFITABLE MARKETS
7. PRODUCTION
The Latest Trends and Insights into The Industry
- PRODUCTION VOLUME AND VALUE
8. IMPORTS
The Largest Import Supplying Countries
- IMPORTS FROM 2012–2023
- IMPORTS BY COUNTRY
- IMPORT PRICES BY COUNTRY
9. EXPORTS
The Largest Destinations for Exports
- EXPORTS FROM 2012–2023
- EXPORTS BY COUNTRY
- EXPORT PRICES BY COUNTRY
-
10. PROFILES OF MAJOR PRODUCERS
The Largest Producers on The Market and Their Profiles
This Chapter is Available Only for the Professional Edition PRO -
LIST OF TABLES
- Key Findings In 2023
- Market Volume, In Physical Terms, 2012–2023
- Market Value, 2012–2023
- Per Capita Consumption In 2012-2023
- Imports, In Physical Terms, By Country, 2012–2023
- Imports, In Value Terms, By Country, 2012–2023
- Import Prices, By Country Of Origin, 2012–2023
- Exports, In Physical Terms, By Country, 2012–2023
- Exports, In Value Terms, By Country, 2012–2023
- Export Prices, By Country Of Destination, 2012–2023
-
LIST OF FIGURES
- Market Volume, In Physical Terms, 2012–2023
- Market Value, 2012–2023
- Market Structure – Domestic Supply vs. Imports, In Physical Terms, 2012-2023
- Market Structure – Domestic Supply vs. Imports, In Value Terms, 2012-2023
- Trade Balance, In Physical Terms, 2012-2023
- Trade Balance, In Value Terms, 2012-2023
- Per Capita Consumption, 2012-2023
- Market Volume Forecast to 2030
- Market Value Forecast to 2030
- Products: Market Size And Growth, By Type
- Products: Average Per Capita Consumption, By Type
- Products: Exports And Growth, By Type
- Products: Export Prices And Growth, By Type
- Production Volume And Growth
- Exports And Growth
- Export Prices And Growth
- Market Size And Growth
- Per Capita Consumption
- Imports And Growth
- Import Prices
- Production, In Physical Terms, 2012–2023
- Production, In Value Terms, 2012–2023
- Imports, In Physical Terms, 2012–2023
- Imports, In Value Terms, 2012–2023
- Imports, In Physical Terms, By Country, 2023
- Imports, In Physical Terms, By Country, 2012–2023
- Imports, In Value Terms, By Country, 2012–2023
- Import Prices, By Country Of Origin, 2012–2023
- Exports, In Physical Terms, 2012–2023
- Exports, In Value Terms, 2012–2023
- Exports, In Physical Terms, By Country, 2023
- Exports, In Physical Terms, By Country, 2012–2023
- Exports, In Value Terms, By Country, 2012–2023
- Export Prices, By Country Of Destination, 2012–2023


