Qatar - Figs - Market Analysis, Forecast, Size, Trends and Insights
Get instant access to more than 2 million reports, dashboards, and datasets on the IndexBox Platform.
View PricingQatar's October 2023 Import of Figs Sees a Modest Decrease to $612K
Qatar Fig Imports
After two months of growth, supplies from abroad of figs decreased by -3.8% to 137 tons in October 2023. In general, imports saw a pronounced setback. The pace of growth appeared the most rapid in September 2023 with an increase of 43% against the previous month.
In value terms, fig imports dropped remarkably to $612K (IndexBox estimates) in October 2023. Overall, imports recorded a slight decrease. The pace of growth appeared the most rapid in September 2023 with an increase of 64% against the previous month.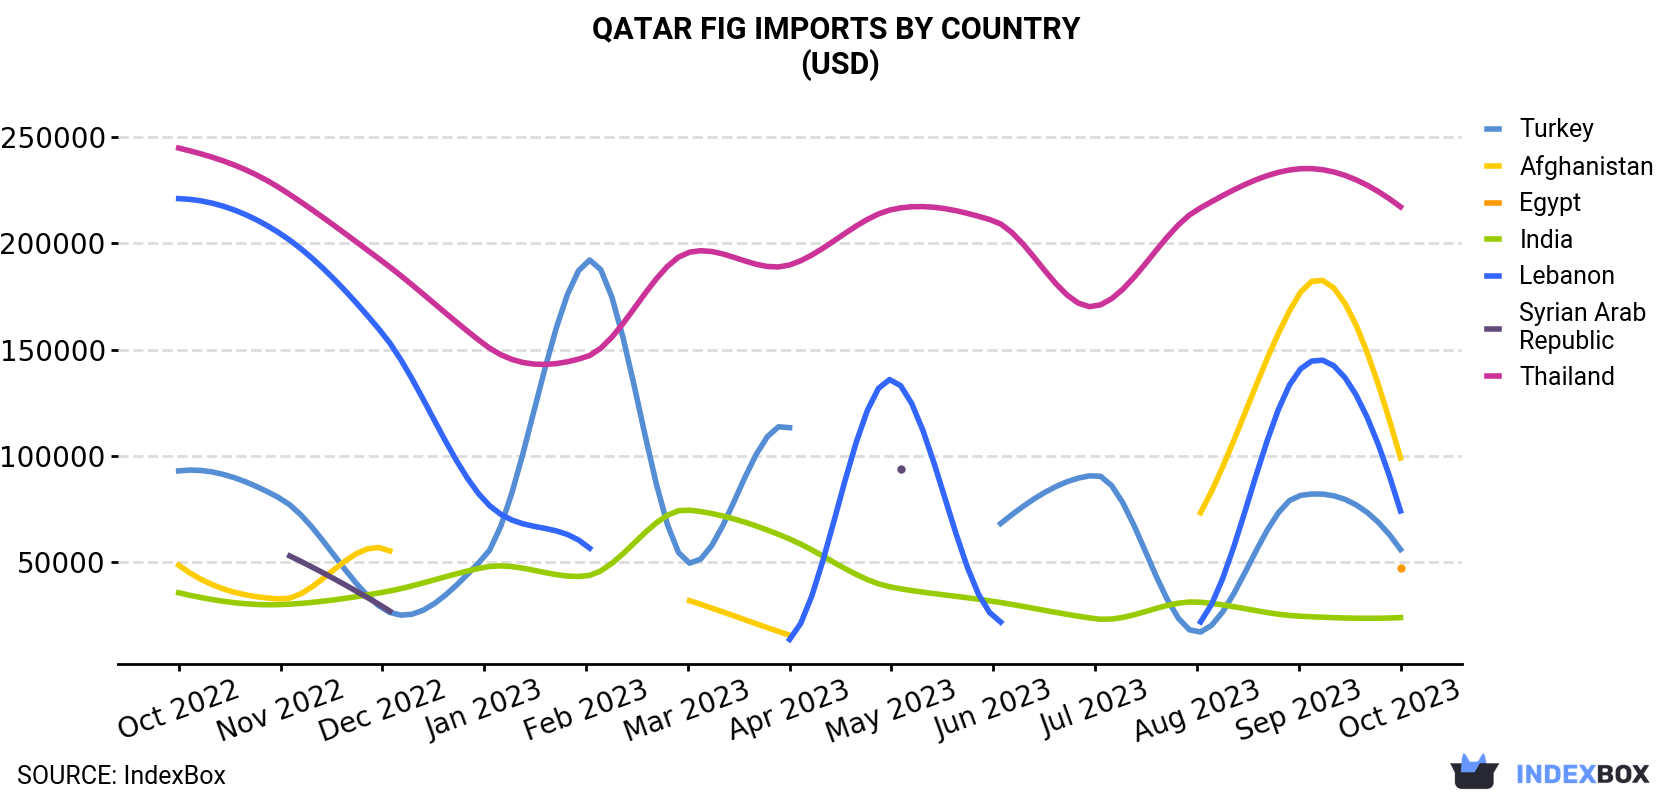
| COUNTRY | Import Value of Fig in Qatar (USD) | ||||||||||||
|---|---|---|---|---|---|---|---|---|---|---|---|---|---|
| Oct 2022 | Nov 2022 | Dec 2022 | Jan 2023 | Feb 2023 | Mar 2023 | Apr 2023 | May 2023 | Jun 2023 | Jul 2023 | Aug 2023 | Sep 2023 | Oct 2023 | |
| Thailand | 244,748 | 225,742 | 191,542 | 152,543 | 146,565 | 195,591 | 189,793 | 215,808 | 210,660 | 170,323 | 215,654 | 234,988 | 217,127 |
| Afghanistan | 48,720 | 32,811 | 56,808 | N/A | N/A | 32,313 | 15,796 | N/A | N/A | N/A | 70,364 | 175,731 | 99,126 |
| Lebanon | 220,997 | 204,467 | 157,749 | 79,244 | 58,139 | N/A | 13,815 | 135,938 | 24,763 | N/A | 20,309 | 140,001 | 74,197 |
| Turkey | 93,018 | 80,010 | 28,425 | 52,397 | 191,388 | 49,860 | 113,344 | N/A | 65,419 | 90,968 | 17,112 | 81,338 | 56,091 |
| Egypt | N/A | N/A | N/A | N/A | N/A | N/A | N/A | N/A | N/A | N/A | N/A | N/A | 47,247 |
| India | 35,755 | 30,195 | 35,928 | 47,711 | 43,607 | 74,662 | 61,033 | 38,383 | 31,710 | 23,543 | 31,399 | 24,767 | 24,086 |
| Syrian Arab Republic | N/A | 55,107 | 29,376 | N/A | N/A | N/A | N/A | 94,148 | N/A | N/A | N/A | N/A | N/A |
| Others | 100,483 | 204,775 | 88,437 | 212,512 | 179,892 | 136,521 | 123,951 | 94,473 | 230,161 | 65,438 | 92,737 | 76,741 | 93,745 |
| Total | 743,721 | 833,107 | 588,265 | 544,407 | 619,591 | 488,947 | 517,732 | 578,750 | 562,713 | 350,272 | 447,575 | 733,566 | 611,619 |
Imports by Country
Thailand (34 tons), Egypt (30 tons) and Lebanon (14 tons) were the main suppliers of fig imports to Qatar, together comprising 57% of total imports.
From October 2022 to October 2023, the most notable rate of growth in terms of purchases, amongst the main suppliers, was attained by Egypt (with a CAGR of 0.0%), while imports for the other leaders experienced a decline.
In value terms, Thailand ($217K) constituted the largest supplier of fig to Qatar, comprising 36% of total imports. The second position in the ranking was held by Afghanistan ($99K), with a 16% share of total imports. It was followed by Lebanon, with a 12% share.
From October 2022 to October 2023, the average monthly rate of growth in terms of value from Thailand was relatively modest. The remaining supplying countries recorded the following average monthly rates of imports growth: Afghanistan (+6.1% per month) and Lebanon (-8.7% per month).
Import Prices by Country
In October 2023, the fig price amounted to $4,457 per ton (CIF, Qatar), dropping by -13.3% against the previous month. Over the period under review, the import price, however, recorded a relatively flat trend pattern. The growth pace was the most rapid in May 2023 an increase of 27% against the previous month. Over the period under review, average import prices attained the peak figure at $5,142 per ton in September 2023, and then reduced in the following month.
There were significant differences in the average prices amongst the major supplying countries. In October 2023, the country with the highest price was Afghanistan ($7,893 per ton), while the price for Egypt ($1,571 per ton) was amongst the lowest.
From October 2022 to October 2023, the most notable rate of growth in terms of prices was attained by Afghanistan (+12.9%), while the prices for the other major suppliers experienced more modest paces of growth.
This report provides an in-depth analysis of the fig market in Qatar. Within it, you will discover the latest data on market trends and opportunities by country, consumption, production and price developments, as well as the global trade (imports and exports). The forecast exhibits the market prospects through 2030.
Product coverage:
- FCL 569 - Figs
Country coverage:
- Qatar
Data coverage:
- Market volume and value
- Per Capita consumption
- Forecast of the market dynamics in the medium term
- Trade (exports and imports) in Qatar
- Export and import prices
- Market trends, drivers and restraints
- Key market players and their profiles
Reasons to buy this report:
- Take advantage of the latest data
- Find deeper insights into current market developments
- Discover vital success factors affecting the market
This report is designed for manufacturers, distributors, importers, and wholesalers, as well as for investors, consultants and advisors.
In this report, you can find information that helps you to make informed decisions on the following issues:
- How to diversify your business and benefit from new market opportunities
- How to load your idle production capacity
- How to boost your sales on overseas markets
- How to increase your profit margins
- How to make your supply chain more sustainable
- How to reduce your production and supply chain costs
- How to outsource production to other countries
- How to prepare your business for global expansion
While doing this research, we combine the accumulated expertise of our analysts and the capabilities of artificial intelligence. The AI-based platform, developed by our data scientists, constitutes the key working tool for business analysts, empowering them to discover deep insights and ideas from the marketing data.
-
1. INTRODUCTION
Making Data-Driven Decisions to Grow Your Business
- REPORT DESCRIPTION
- RESEARCH METHODOLOGY AND AI PLATFORM
- DATA-DRIVEN DECISIONS FOR YOUR BUSINESS
- GLOSSARY AND SPECIFIC TERMS
-
2. EXECUTIVE SUMMARY
A Quick Overview of Market Performance
- KEY FINDINGS
- MARKET TRENDS This Chapter is Available Only for the Professional Edition PRO
-
3. MARKET OVERVIEW
Understanding the Current State of The Market and Its Prospects
- MARKET SIZE
- MARKET STRUCTURE
- TRADE BALANCE
- PER CAPITA CONSUMPTION
- MARKET FORECAST TO 2030
-
4. MOST PROMISING PRODUCT
Finding New Products to Diversify Your Business
This Chapter is Available Only for the Professional Edition PRO- TOP PRODUCTS TO DIVERSIFY YOUR BUSINESS
- BEST-SELLING PRODUCTS
- MOST CONSUMED PRODUCT
- MOST TRADED PRODUCT
- MOST PROFITABLE PRODUCT FOR EXPORT
-
5. MOST PROMISING SUPPLYING COUNTRIES
Choosing the Best Countries to Establish Your Sustainable Supply Chain
This Chapter is Available Only for the Professional Edition PRO- TOP COUNTRIES TO SOURCE YOUR PRODUCT
- TOP PRODUCING COUNTRIES
- COUNTRIES WITH TOP YIELDS
- TOP EXPORTING COUNTRIES
- LOW-COST EXPORTING COUNTRIES
-
6. MOST PROMISING OVERSEAS MARKETS
Choosing the Best Countries to Boost Your Exports
This Chapter is Available Only for the Professional Edition PRO- TOP OVERSEAS MARKETS FOR EXPORTING YOUR PRODUCT
- TOP CONSUMING MARKETS
- UNSATURATED MARKETS
- TOP IMPORTING MARKETS
- MOST PROFITABLE MARKETS
7. PRODUCTION
The Latest Trends and Insights into The Industry
- PRODUCTION, HARVESTED AREA AND YIELD
8. IMPORTS
The Largest Import Supplying Countries
- IMPORTS FROM 2012–2023
- IMPORTS BY COUNTRY
- IMPORT PRICES BY COUNTRY
9. EXPORTS
The Largest Destinations for Exports
- EXPORTS FROM 2012–2023
- EXPORTS BY COUNTRY
- EXPORT PRICES BY COUNTRY
-
10. PROFILES OF MAJOR PRODUCERS
The Largest Producers on The Market and Their Profiles
This Chapter is Available Only for the Professional Edition PRO -
LIST OF TABLES
- Key Findings In 2023
- Market Volume, In Physical Terms, 2012–2023
- Market Value, 2012–2023
- Per Capita Consumption In 2012-2023
- Imports, In Physical Terms, By Country, 2012–2023
- Imports, In Value Terms, By Country, 2012–2023
- Import Prices, By Country Of Origin, 2012–2023
- Exports, In Physical Terms, By Country, 2012–2023
- Exports, In Value Terms, By Country, 2012–2023
- Export Prices, By Country Of Destination, 2012–2023
-
LIST OF FIGURES
- Market Volume, In Physical Terms, 2012–2023
- Market Value, 2012–2023
- Market Structure – Domestic Supply vs. Imports, In Physical Terms, 2012-2023
- Market Structure – Domestic Supply vs. Imports, In Value Terms, 2012-2023
- Trade Balance, In Physical Terms, 2012-2023
- Trade Balance, In Value Terms, 2012-2023
- Per Capita Consumption, 2012-2023
- Market Volume Forecast to 2030
- Market Value Forecast to 2030
- Products: Market Size And Growth, By Type
- Products: Average Per Capita Consumption, By Type
- Products: Exports And Growth, By Type
- Products: Export Prices And Growth, By Type
- Production Volume And Growth
- Yield And Growth
- Exports And Growth
- Export Prices And Growth
- Market Size And Growth
- Per Capita Consumption
- Imports And Growth
- Import Prices
- Production, In Physical Terms, 2012–2023
- Production, In Value Terms, 2012–2023
- Area Harvested, 2012–2023
- Yield, 2012–2023
- Imports, In Physical Terms, 2012–2023
- Imports, In Value Terms, 2012–2023
- Imports, In Physical Terms, By Country, 2023
- Imports, In Physical Terms, By Country, 2012–2023
- Imports, In Value Terms, By Country, 2012–2023
- Import Prices, By Country Of Origin, 2012–2023
- Exports, In Physical Terms, 2012–2023
- Exports, In Value Terms, 2012–2023
- Exports, In Physical Terms, By Country, 2023
- Exports, In Physical Terms, By Country, 2012–2023
- Exports, In Value Terms, By Country, 2012–2023
- Export Prices, By Country Of Destination, 2012–2023


